. 2018 Nov 1;175(4):984-997.e24.
doi: 10.1016/j.cell.2018.09.006.

A Cancer Cell Program Promotes T Cell Exclusion and Resistance to Checkpoint Blockade

Affiliations

A Cancer Cell Program Promotes T Cell Exclusion and Resistance to Checkpoint Blockade

Livnat Jerby-Arnon et al. Cell. .

Abstract

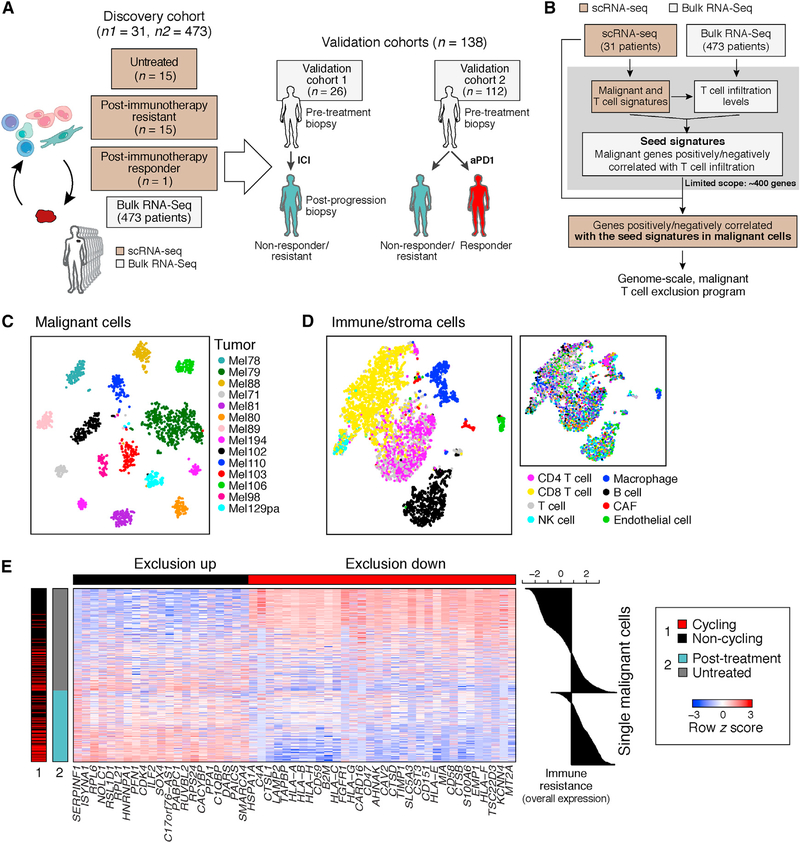
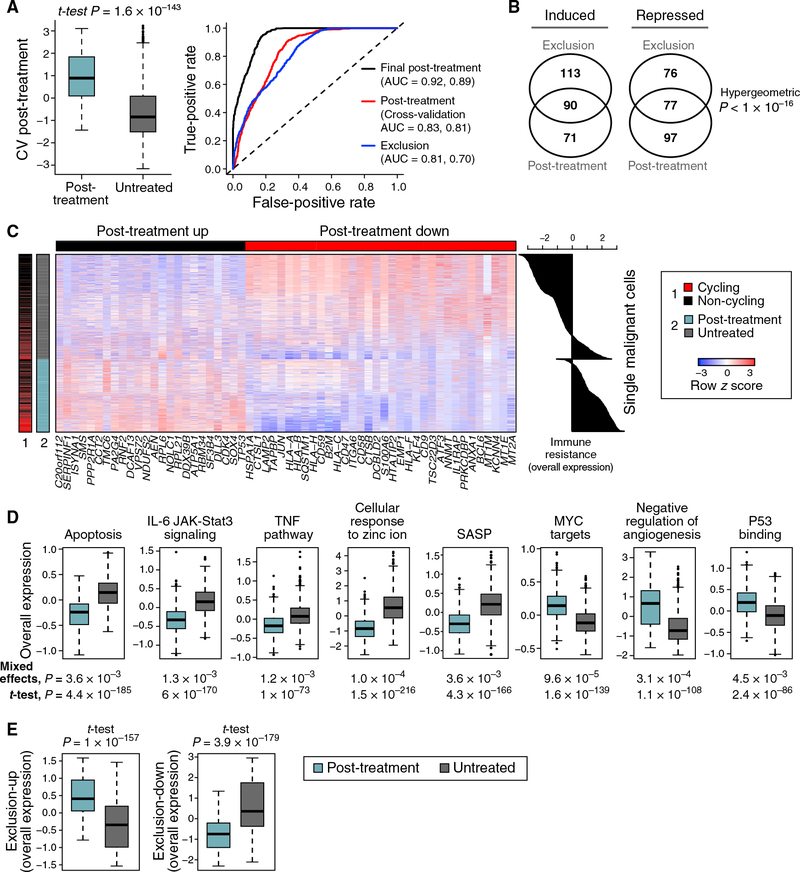
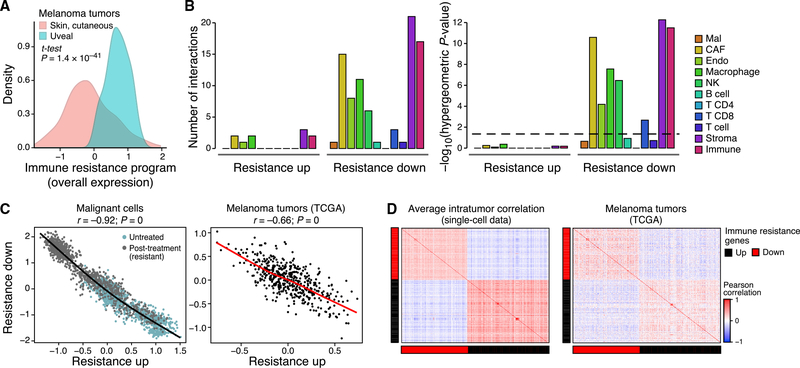
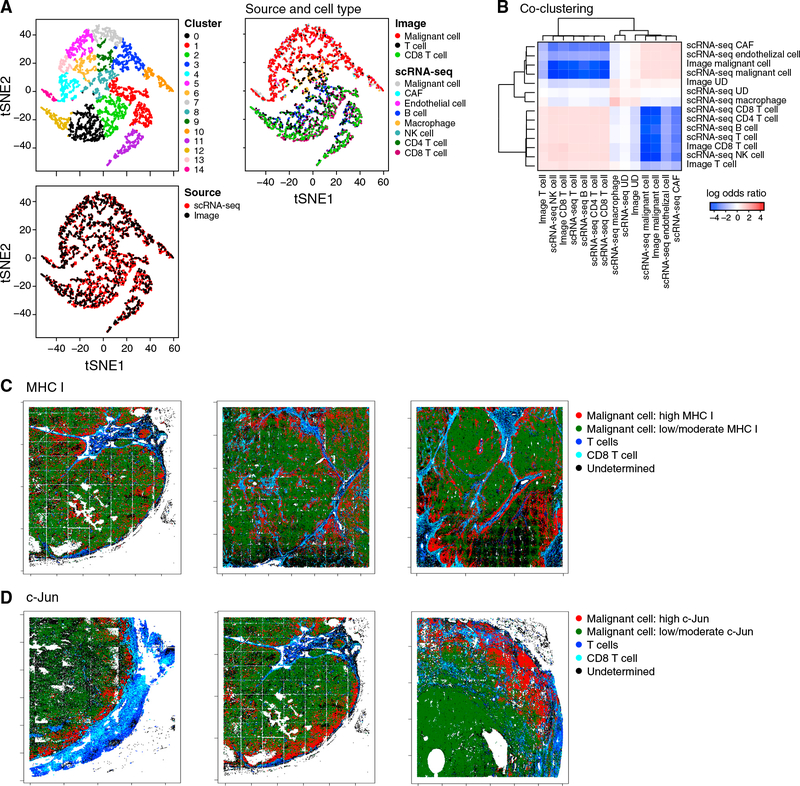
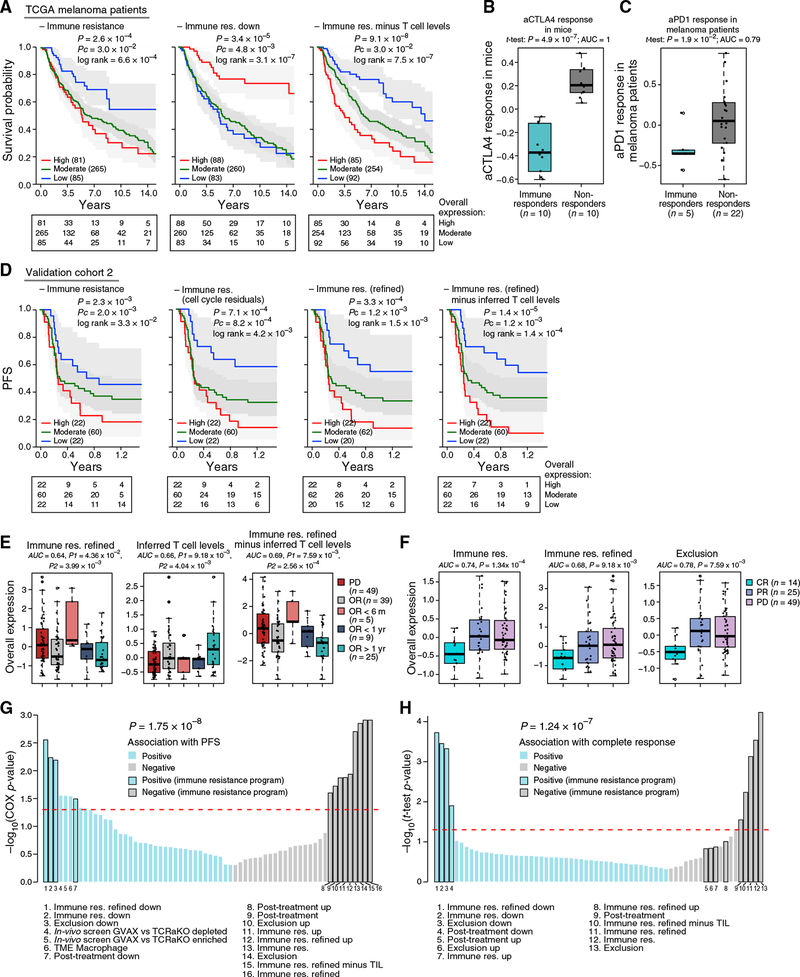
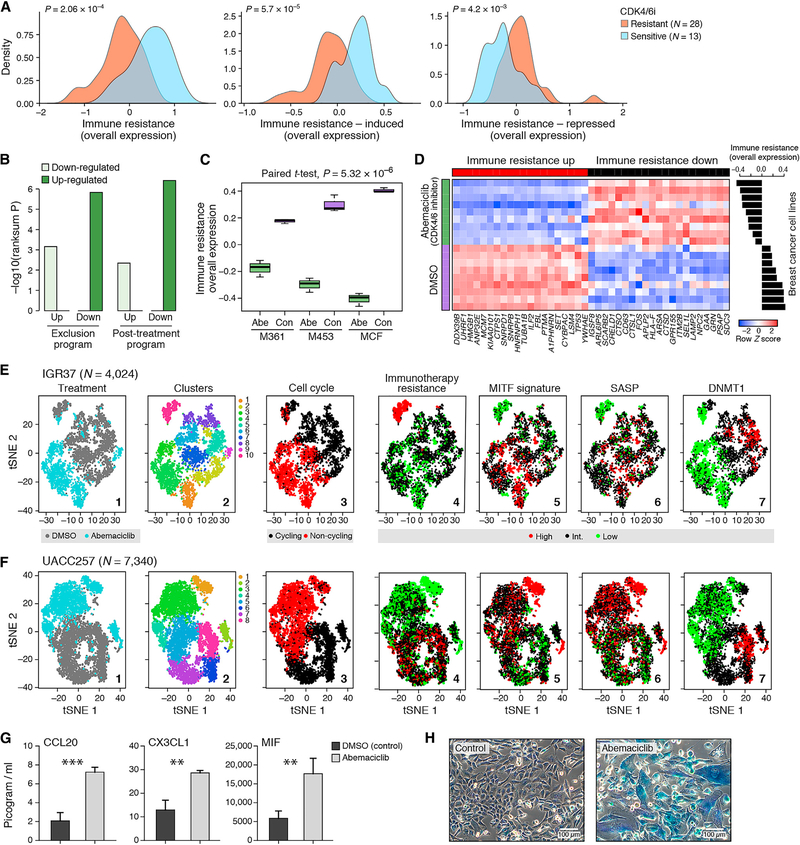
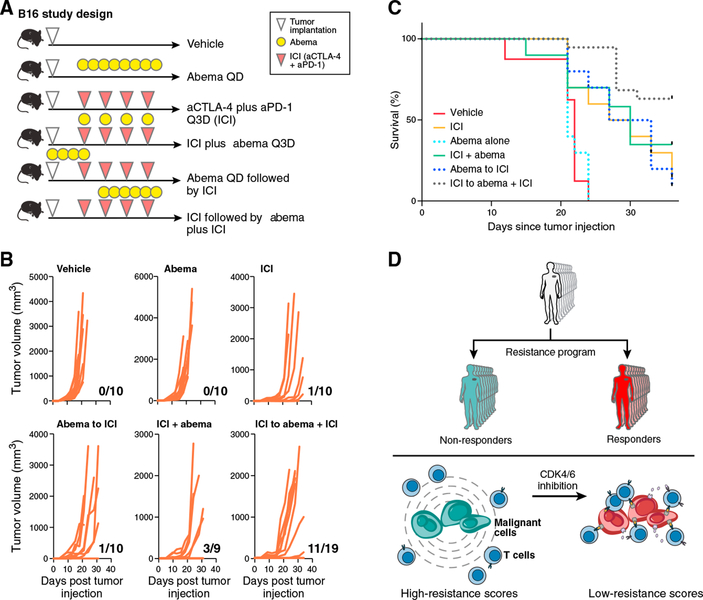
Immune checkpoint inhibitors (ICIs) produce durable responses in some melanoma patients, but many patients derive no clinical benefit, and the molecular underpinnings of such resistance remain elusive. Here, we leveraged single-cell RNA sequencing (scRNA-seq) from 33 melanoma tumors and computational analyses to interrogate malignant cell states that promote immune evasion. We identified a resistance program expressed by malignant cells that is associated with T cell exclusion and immune evasion. The program is expressed prior to immunotherapy, characterizes cold niches in situ, and predicts clinical responses to anti-PD-1 therapy in an independent cohort of 112 melanoma patients. CDK4/6-inhibition represses this program in individual malignant cells, induces senescence, and reduces melanoma tumor outgrowth in mouse models in vivo when given in combination with immunotherapy. Our study provides a high-resolution landscape of ICI-resistant cell states, identifies clinically predictive signatures, and suggests new therapeutic strategies to overcome immunotherapy resistance.


Conflict of interest statement

DECLARATION OF INTERESTS

A. Regev is an SAB member for ThermoFisher Scientific, Syros Pharmaceuticals and Driver Group and a founder of Celsius Therapeutics. A. Regev, L.J.-A., B.I., O.R.-R., and A. Rotem are co-inventors on provisional patent application filed by the Broad Institute relating to this manuscript. L.A.G. is now an employee of Eli Lilly and company.

Figures

Figure 1
Figure 1. Identification of a T Cell Exclusion Program in Malignant Cells.
(A) Study overview. (B) Method to discover malignant cell programs associated with immune cell infiltration or exclusion. (C and D) Distinct profiles of malignant and non-malignant cells. t-stochastic neighbor embedding (t-SNE) of single-cell profiles (dots) from malignant (C) or non-malignant (D) cells, colored by post hoc annotation (D, left) or by tumor (C and D, right). In (C), only tumors with at least 50 malignant cells are shown. (E) Exclusion program. Expression (centered and scaled, color bar) of the top genes (columns) in the exclusion program across malignant cells (rows) is sorted by untreated or post-treatment tumors (blue/gray color bar, left). Leftmost color bar: cycling (red) and non-cycling (black) cells. Right: overall expression (OE) (STAR Methods) of the exclusion program. See also Figures S1 and S2 and Tables S1, S2, S3, and S4.
Figure 2.
Figure 2.. Exclusion and Resistance Programs Characterizing Individual Malignant Cells from Patients with Resistance to ICIs
(A) Post-treatment program in malignant cells. Left: OE of the post-treatment program in malignant cells from post-treatment (blue) and untreated (gray) patients tested on withheld data (STAR Methods). Middle line: median; box edges: 25th and 75th percentiles; whiskers: most extreme points that do not exceed ± interquartile range (IQR) × 1.5; further outliers are marked individually. Right: the performances of different programs in classifying cells as post treatment or untreated; the first and second area under the curve (AUC) values are for classifying cells and samples, respectively. (B) Significant overlap between the exclusion and post-treatment programs. (C) Expression (centered and scaled, color bar) of the top genes (columns) in the post-treatment program across malignant cells (rows) sorted by untreated or post-treatment tumors (blue/gray color bar, left). Leftmost color bar: cycling (red) and non-cycling (black) cells. Right: OE of the post-treatment program. (D) Distribution of OE scores (as in A) of differentially expressed gene sets in malignant cells from post-treatment (blue) and untreated (gray) tumors. (E) Distribution of OE scores (as in A) of the exclusion program in malignant cells from post-treatment (blue) and untreated (gray) tumors. See also Figure S2 and Tables S4 and S5.
Figure 3.
Figure 3.. The Resistance Program Is a Coherently Regulated Module that Represses Cell-Cell Interactions
(A) Distribution of program OE scores in cutaneous (pink) versus uveal (blue) melanoma from TCGA after filtering microenvironment contributions (STAR Methods). (B) Right: Number of genes in each part of the program that mediate physical interactions with other cell types (color) and the significance of the corresponding enrichment. Dashed line: statistical significance. (C and D) Co-regulation of the program. (C) OE of the induced and repressed parts of the immune resistance programs in malignant cells (left, scRNA-seq data) and cutaneous melanoma tumors (right, TCGA RNA-seq data after filtering microenvironment signals). Pearson correlation coefficient (r) and p value are marked. (D) Pearson correlation coefficients (color bar) between the program’s genes across malignant cells from the same tumor (left, average coefficient) or across cutaneous melanoma from TCGA (right, after filtering microenvironment effects). See also Figure S3.
Figure 4.
Figure 4.. The Resistance Program Is Associated with the Cold Niche In Situ
(A and B) Congruence of in situ multiplex protein and scRNA-seq profiles. (A) Co-embedding of profiles from scRNA-seq and multiplex imaging of the Mel112 tumor (others in Figure S4), with cells colored by clusters (top left), data source (bottom left), or source and cell type (right). (B) Log-odds ratio (color bar; STAR Methods) assessing for each pair of cell types (rows, columns) if they are assigned to the same cluster significantly more (>0, red) or less (<0, blue) than expected by chance. (C and D) Multiplex imaging relates program genes to hot or cold niches. Malignant cells expressing high (red) or low/moderate (green) levels of the MHC class I (C) and c-Jun (D) proteins and their proximity to CD3+ T cells (blue) or CD3+CD8+ T cells (cyan) in three representative tumors. See also Figure S4.
Figure 5.
Figure 5.. The Resistance Program Is Prognostic and Predictive in Validation Cohorts
(A) The program predicts melanoma patient survival in bulk RNA-seq from TCGA. Kaplan-Meier (KM) curves stratified by high (top 20%), low (bottom 20%), or intermediate (remainder) OE of the respective program. Number of subjects at risk indicated at the bottom of the KM curves for five time points. P, COX regression p value; Pc, COX regression p value that tests if the program enhances the predictive power of a model with inferred T cell infiltration levels as a covariate. (B and C) Distribution of OE of the resistance program in bulk tumors from a lung cancer mouse model treated with anti-CTLA-4 therapy (Lesterhuis et al., 2015) (B) or melanoma patients prior to pembrolizumab treatment (Hugo et al., 2016) (C). Middle line: median; box edges: 25th and 75th percentiles, whiskers: most extreme points that do not exceed ± IQR × 1.5; outliers are marked individually. (D-F) The program predicts ICI responses in validation cohort 2. (D) KM plots for PFS for the 104 patients in the cohort with available PFS data stratified by high (top 20%), low (bottom 20%), or intermediate (remainder) OE of the respective program (STAR Methods). (E) OE of the resistance program (y axis) in the pre-treatment profiles of patients with intrinsic resistance (PD, n = 49) or objective response (OR, n = 39), with the latter further stratified by response duration. Patients with unknown response or stable disease are not shown. P1 and P2: one-tailed t test p value when comparing the PD patients to all the OR patients or to OR >1 year patients, respectively. AUC for predicting OR >1 year in all patients with a recorded response (n = 101) is denoted. Formatted as in (B). (F) OE scores of the resistance program (y axis) in the pre-treatment bulk RNA-seq profiles of patients with complete response (CR, n = 14), partial response (PR, n = 25), or progressive disease (PD, n = 49). P: one-tailed t test p value comparing CR patients to PR and PD patients. AUC for predicting CR in all patients with a recorded response (n = 101). (G and H) Predictive value (y axis) compared to alternative signature-based predictors. Blue/gray bars: signatures positively/negatively associated with response. Black outline of bars: subsets of the resistance program denoted with numbered legends at the bottom. Dashed line: p = 0.05. (G) Predictive value for PFS (Pc as in D; STAR Methods). (H) Predictive value for complete response. See also Figures S5 and S6 and Table S6.
Figure 6.
Figure 6.
The Resistance Program Can Be Reversed by CDK4/6 Inhibition (A) OE of the resistance program across cancer cell lines that are resistant (orange) or sensitive (blue) to both abemaciclib and palbociclib. (B-D) Impact of CDK4/6i on breast cancer tumors and cell line profiles. (B) Significance (y axis, −log10(p value), Wilcoxon rank-sum test) of induction (dark) or repression (light) of the program subsets in tumors from abemaciclib-treated mice compared to vehicle (Goel et al., 2017). (C) OE of the program in cell lines (M361, M453, and MCF) treated with abemaciclib (“abe”) or with DMSO vehicle (“con”). Middle line: median; box edges: 25th and 75th percentiles; whiskers: most extreme points that do not exceed ± IQR × 1.5; outliers are marked individually. P value: paired t test. (D) Expression of 40 program genes (columns) that were most differentially expressed in abemaciclib-treated (green) versus control (purple) cell lines (rows) (STAR Methods). Expression is normalized in each cell line. Right: OE scores for each cell line. (E–H) CDK4/6i reverses the program in RBI-sufficient melanoma cell lines and induces the SASP. (E and F) tSNE of 4,024 IGR137 (E) and 7,340 UACC257 (F) melanoma cells colored by (1) treatment, (2) clusters, or (3) expression of cell-cycle signature, (4) resistance program, (5) MITF signature, (6) SASP signature, and (7) DNMT1. (G) Concentration (pg/mL, y axis) of secreted chemokines in the supernatant of melanoma cells treated for 7 days with abemaciclib (500 nM) or with DMSO control. **p < 0.01, ***p < 0.001; t test (Table S7B). (H) Senescence-associated β-galactosidase activity (blue) and morphological alterations in melanoma cells treated for 10 days with abemaciclib (500 nM, right) versus DMSO control (left). See also Figure S7 and Table S7.
Figure 7.
Figure 7.. CDK4/6 Inhibition Combined with Immunotherapy Improves Response and Survival In Vivo
(A) Study design. n = 9–19 per treatment group. (B and ) Rate of tumor outgrowth (ratio for every graph) (B) is reduced in animals treated with phased combination (ICI followed by ICI plus abemaciclib) and results in higher survival rates compared to other treatments (C). p < 0.001, log-rank test. (D) Immune resistance model. See also Figure S7.

Comment in

Similar articles

Cited by

References

    1. Akbani R, Akdemir KC, Aksoy BA, Albert M, Ally A, Amin SB, Arach-chi H, Arora A, Auman JT, Ayala B, et al.; Cancer Genome Atlas Network (2015). Genomic Classification of Cutaneous Melanoma. Cell 161,1681–1696. - PMC - PubMed
    1. Algazi AP, Tsai KK, Shoushtari AN, Munhoz RR, Eroglu Z, Piulats JM, Ott PA, Johnson DB, Hwang J, Daud AI, et al. (2016). Clinical outcomes in metastatic uveal melanoma treated with PD-1 and PD-L1 antibodies. Cancer 122, 3344–3353. - PMC - PubMed
    1. Ayers M, Lunceford J, Nebozhyn M, Murphy E, Loboda A, Kaufman DR, Albright A, Cheng JD, Kang SP, Shankaran V, et al. (2017). IFN-γ-related mRNA profile predicts clinical response to PD-1 blockade. J. Clin. Invest 127, 2930–2940. - PMC - PubMed
    1. Benjamini Y, and Hochberg Y (1995). Controlling the False Discovery Rate: A Practical and Powerful Approach to Multiple Testing. J. R. Stat. Soc. Ser. B Stat. Methodol 57, 289–300.
    1. Butler A, Hoffman P, Smibert P, Papalexi E, and Satija R (2018). Integrating single-cell transcriptomic data across different conditions, technologies, and species. Nat. Biotechnol 36, 411–420. - PMC - PubMed

Publication types

MeSH terms