. 2018 Nov 1;175(4):998-1013.e20.
doi: 10.1016/j.cell.2018.10.038.

Defining T Cell States Associated with Response to Checkpoint Immunotherapy in Melanoma

Affiliations

Defining T Cell States Associated with Response to Checkpoint Immunotherapy in Melanoma

Moshe Sade-Feldman et al. Cell. .

Erratum in

  • Defining T Cell States Associated with Response to Checkpoint Immunotherapy in Melanoma.
    Sade-Feldman M, Yizhak K, Bjorgaard SL, Ray JP, de Boer CG, Jenkins RW, Lieb DJ, Chen JH, Frederick DT, Barzily-Rokni M, Freeman SS, Reuben A, Hoover PJ, Villani AC, Ivanova E, Portell A, Lizotte PH, Aref AR, Eliane JP, Hammond MR, Vitzthum H, Blackmon SM, Li B, Gopalakrishnan V, Reddy SM, Cooper ZA, Paweletz CP, Barbie DA, Stemmer-Rachamimov A, Flaherty KT, Wargo JA, Boland GM, Sullivan RJ, Getz G, Hacohen N. Sade-Feldman M, et al. Cell. 2019 Jan 10;176(1-2):404. doi: 10.1016/j.cell.2018.12.034. Cell. 2019. PMID: 30633907 Free PMC article. No abstract available.

Abstract

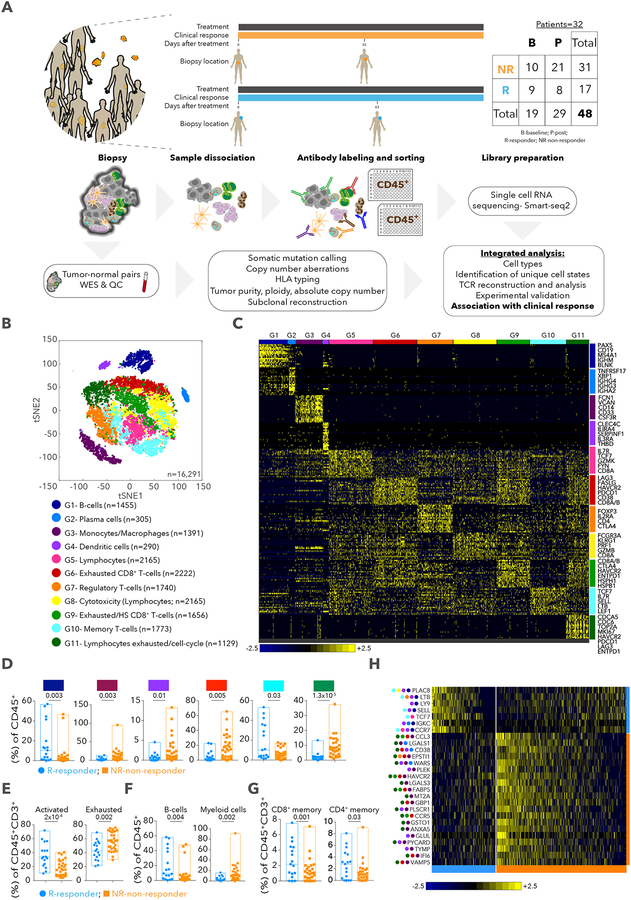
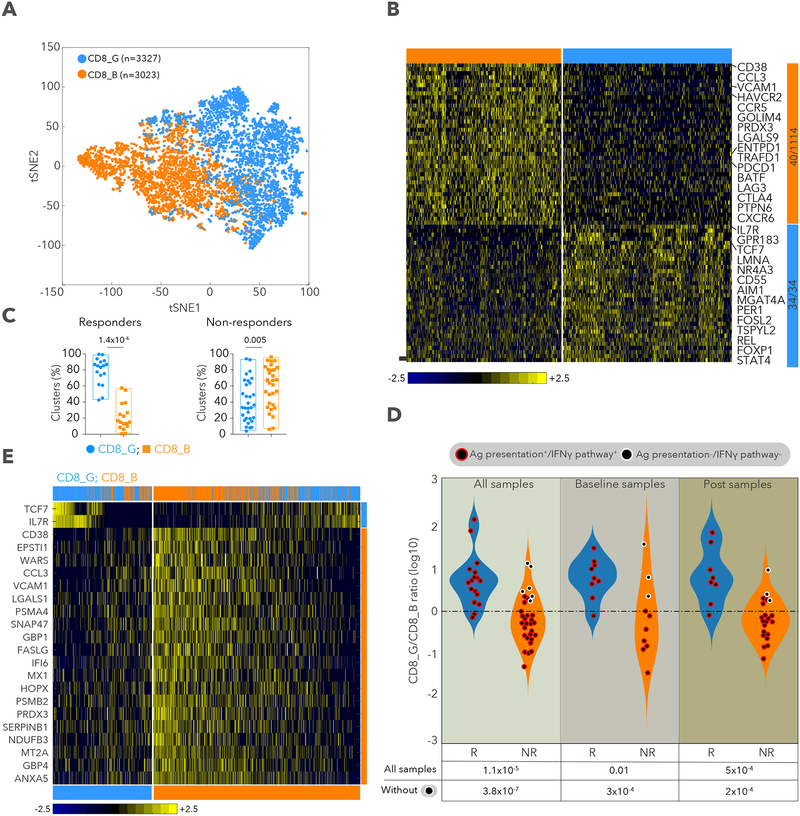
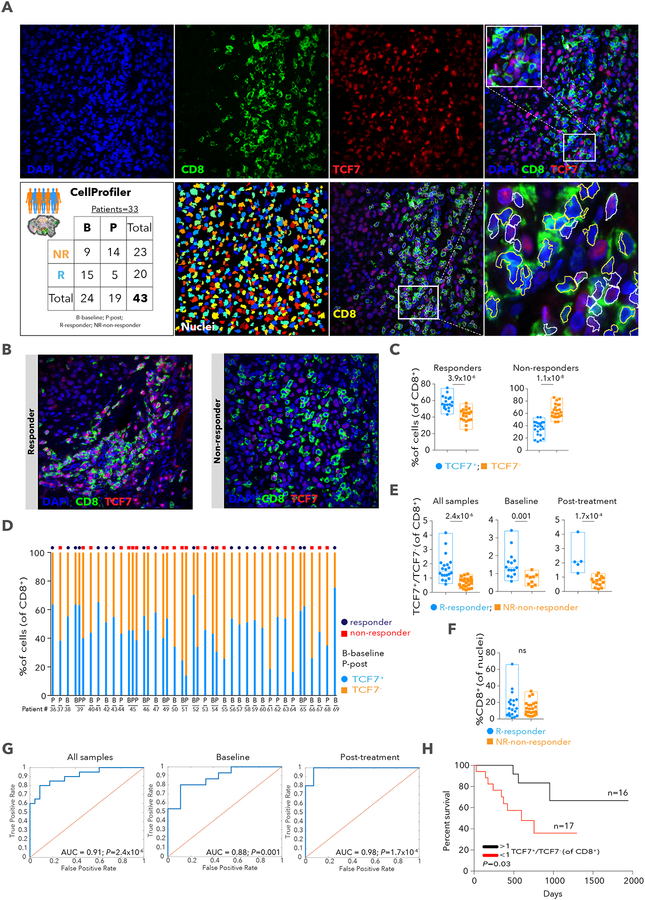
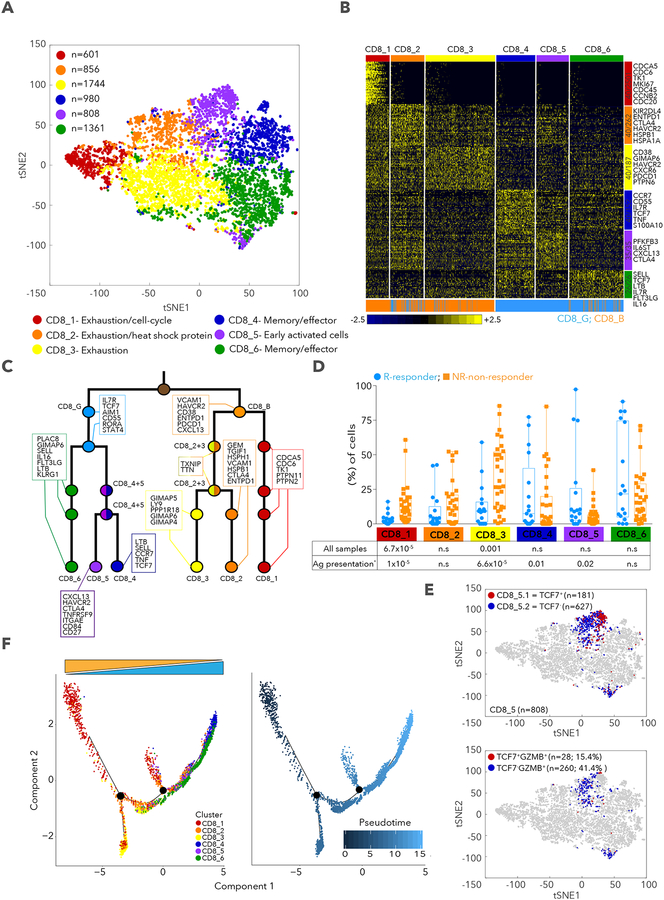
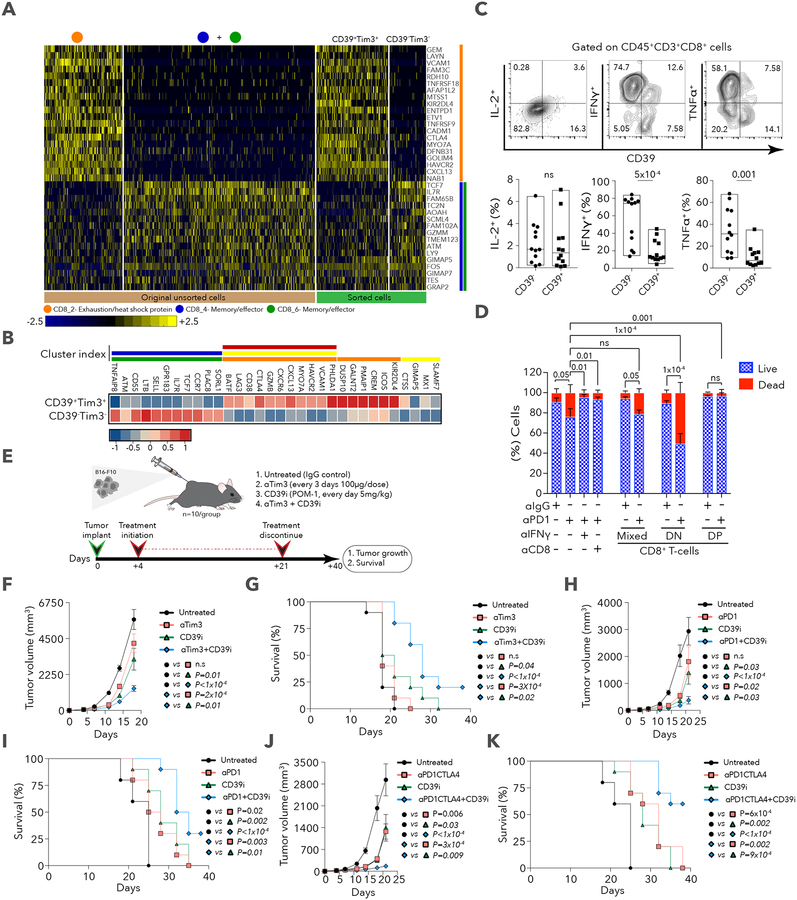
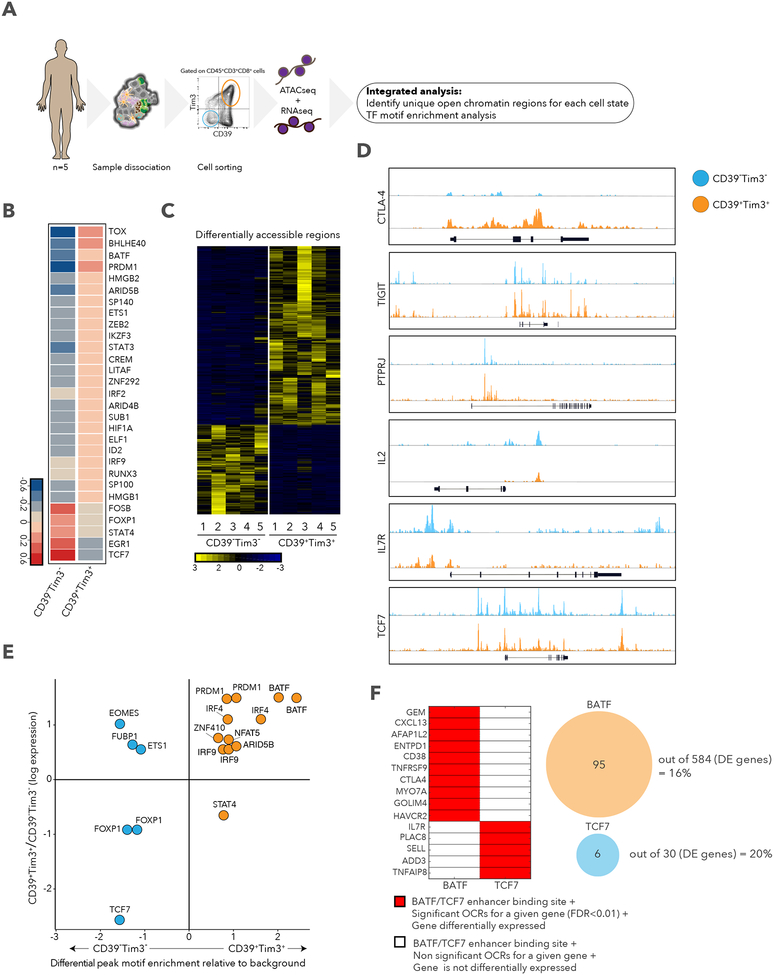
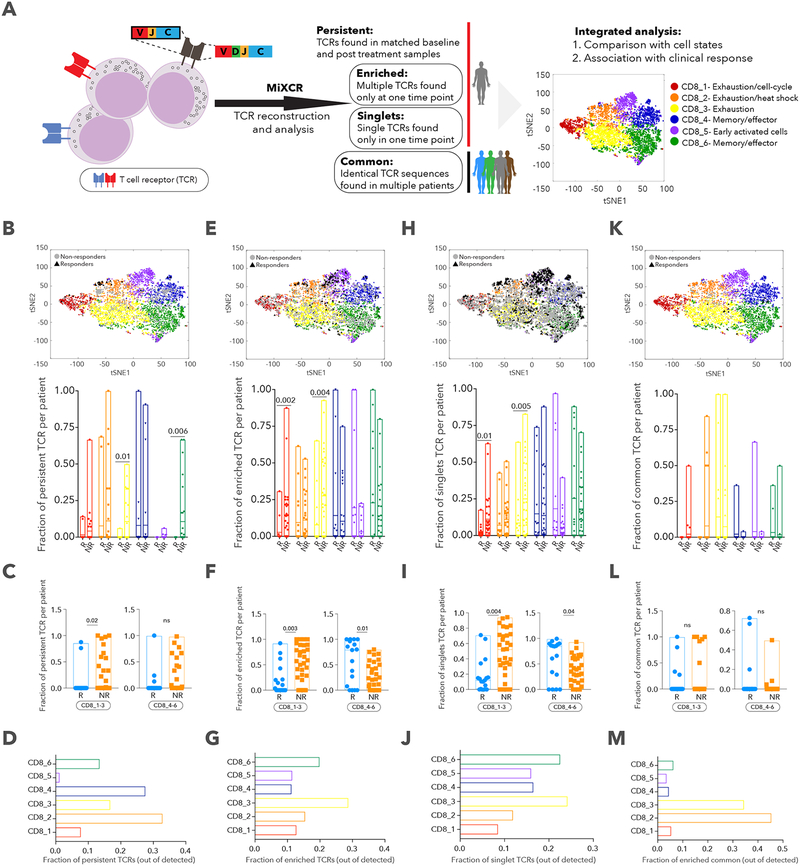
Treatment of cancer has been revolutionized by immune checkpoint blockade therapies. Despite the high rate of response in advanced melanoma, the majority of patients succumb to disease. To identify factors associated with success or failure of checkpoint therapy, we profiled transcriptomes of 16,291 individual immune cells from 48 tumor samples of melanoma patients treated with checkpoint inhibitors. Two distinct states of CD8+ T cells were defined by clustering and associated with patient tumor regression or progression. A single transcription factor, TCF7, was visualized within CD8+ T cells in fixed tumor samples and predicted positive clinical outcome in an independent cohort of checkpoint-treated patients. We delineated the epigenetic landscape and clonality of these T cell states and demonstrated enhanced antitumor immunity by targeting novel combinations of factors in exhausted cells. Our study of immune cell transcriptomes from tumors demonstrates a strategy for identifying predictors, mechanisms, and targets for enhancing checkpoint immunotherapy.

Keywords: CD8(+) T cells; TCF7; cancer immunotherapy; checkpoint blockade; single-cell RNA-seq.


Conflict of interest statement

DECLARATION OF INTERESTS

Parts of the study have been submitted as a patent application. N.H. is on the SAB, owns shares in Neon Therapeutics, and consults for IFM Therapeutics. G.G. is receiving research funds from IBM and Pharmacyclics. G.G. is an inventor on multiple patent applications, including one related to MuTect. R.W.J. and D.A.B are inventors on pending patent 15/540,346 and PCT/US2016/012450. R.W.J. is a consultant for Apricity Health, LLC. D.A.B. is a consultant for N of One. C.P.P. is on the SAB of DropWorks and received honoraria from AstraZeneca, Biorad. Z.A.C. is an employee of MedImmune. A.S.-R. consults for Recombinetics and Novartis. J.A.W. is a paid speaker for Imedex, Dava Oncology, Omniprex, Illumina, Gilead, MedImmune, and Bristol Meyers Squibb; is a consultant/SAB member for Roche-Genentech, Novartis, Astra-Zeneca, Glaxo Smith Klein, Bristol Meyers Squibb, and Merck; and receives clinical trial support from Glaxo Smith Klein, Roche-Genentech, Bristol Meyers Squibb, and Novartis. V.G. and J.A.W. are inventors on USPTO patent (PCT/US17/53.717) and report consultancy fees from MicrobiomeDX and ExpertConnect. G.M.B. has a sponsored research agreement with Takeda Oncology. K.T.F. owns equity in Shattuck Labs, Checkmate, X4 Pharmaceuticals; is a consultant/advisory board member for Novartis, Genentech, BMS, Merck, Takeda, Verastem, Checkmate, X4 Pharmaceuticals, Sanofi, Amgen, Incyte, Adaptimmune, Shattuck Labs, Arch Oncology, and Apricity; and receives research support from Novartis, Genentech, Sanofi, and Amgen. R.J.S. is a paid speaker for Array, Novartis, and Genentech; is a paid consultant/advisory board member for Amgen, Array, Novartis, Merck, Compugen, and Syndax; and has received research funding from Amgen and Merck.

Figures

Figure 1.
Figure 1.. The immune landscape of tumors from patients with melanoma treated with checkpoint therapy.
A. Schematic of cohort. B. tSNE (t-distributed stochastic neighbor embedding) plot of all CD45+ cells that passed QC. Cells are colored based on 11 clusters defined by k-means clustering. C. Heatmap displaying scaled expression values of discriminative gene sets per cluster as defined in (B). A list of representative genes is shown per cluster. D. Box plots showing the % of cells (of all CD45+ cells) per sample for clusters that had a significant difference in frequency between responder and non-responder lesions. Each point represents a single lesion. E-G. Box plots comparing % of cells between responder and non-responder lesions with exhausted or activated signatures for CD45+CD3+ cells (E), B cells and myeloid cells (F) and memory CD8+ and CD4+ T cells (G) based on known markers (Table S1). Each symbol represents a single lesion. H. Heatmap displaying scaled expression values of genes that best discriminate between responder and non-responder lesions for all CD45+ cells. Best marker genes are sorted by fold-change (Table S1). Colored circles on left show the cluster in which the gene is enriched. Data are represented as mean±SEM.
Figure 2.
Figure 2.. Identification of CD8+ T cell states associated with clinical outcome.
A. tSNE plot of all CD8+ T cells collected in this study, with cells colored based on 2 clusters found by k-means clustering. B. Heatmap showing scaled expression values of discriminating genes for same 2 clusters as in (A). Numbers on right margin indicate number of genes shown in heatmap of the total differential per cluster. C. % cells in CD8_G or CD8_B clusters (of all CD8+ T cells) per sample, in responder and non-responder lesions. D. log10 ratio of number of cells in CD8_G compared to CD8_B per sample for responder and non-responder lesions. Circles outlined in white represent samples with defects in antigen presentation or IFNγ pathways. E. Heatmap displaying scaled expression values of discriminative gene sets from all CD8+ T cells between responder and non-responder lesions. Top marker genes are shown for each group (Table S2). Top bar shows mapping of each cell to CD8_G and CD8_B. Data are represented as mean±SEM.
Figure 3.
Figure 3.. Immunofluorescence staining and automated image analysis for the quantification of CD8+ T cells expressing TCF7.
A. Schematic illustration of the immunofluorescence (IF) analysis pipeline. B. Representative images from the multiplex IF of tissue stained for nuclei using DAPI (blue), CD8 (green) and TCF7 (red) from a responder and non-responder patient prior to therapy with anti-PD-1. Original magnification X400. C. % of CD8+TCF7+ and CD8+TCF7 cells showing each sample. D. % TCF7+ and TCF7 cells, out of all CD8+ T cells, per sample, with clinical status above bars. E. TCF7+CD8+/TCF7CD8+ cell number ratio. F. % of CD8+cells out of all nuclei. ns-non-significant. G. Receiver operating characteristic (ROC) analysis was constructed to evaluate the prognostic power of the TCF7+CD8+/TCF7CD8+ ratio. The area under the ROC curve (AUC) was used to quantify response prediction. H. Kaplan-Meier survival curve for 33 patients treated with anti-PD-1 therapy. Patients were divided into two groups based on TCF7+CD8+/TCF7CD8+ ratio (n=16 >1; n=17 <1) from IF. Data are represented as mean±SEM.
Figure 4.
Figure 4.. CD8+ T cell state heterogeneity and its association with clinical response.
A. tSNE plot of all CD8+ T cells collected in this study, with cells colored based on 6 clusters found by k-means clustering. B. Heatmap showing scaled expression values of discriminating genes for same 6 clusters as in (A). Numbers on right margin indicate number of genes shown in heatmap of the total differential genes per cluster. Bottom bar depicts mapping of each cells to CD8_G and CD8_B, respectively. C. Hierarchical tree structure for 6 clusters, with each split showing genes up-regulated in the corresponding cluster relative to the rest of the cells found in the last common ancestor. D. % of cells in CD8_1 to 6 clusters (out of all CD8+ T cells). E. tSNE plot of CD8+ T cells with coloring of CD8_5 according to TCF7 expression upper panel and TCF7 and GZMB expression, lower panel. F. Trajectory analysis for the 6 CD8+ T cells clusters. Cell expression profiles in a two-dimensional independent space. Solid black line indicates the main diameter path of the minimum spanning tree (MST) and provides the backbone of Monocle’s pseudotime ordering of the cells. Each dot represents an individual cell colored by cluster (left plot) or by pseudotime (right plot). Data are represented as mean±SEM.
Figure 5.
Figure 5.. Discriminating exhausted from memory cells using TIM3 and CD39.
A. Heatmap showing scaled expression values of discriminative gene sets between CD8_2 (exhaustion-like) and CD8_4+6 (memory/effector-like) using original unsorted, and sorted (CD39+TIM3+ and CD39TIM3) cells. B. Heatmap of scaled expression values of discriminative gene sets between sorted CD39+TIM3+CD8+ and CD39TIM3CD8+ T cells. Colored bars above heatmap show the CD8+ cluster (as in Figure 4A) in which the gene is enriched C. Representative flow cytometry plots for intracellular staining of IL-2, IFNγ and TNFα in CD39 and CD39+ cells, with quantification below for 12 patients. Data were combined from 2 replicate experiments. D. Quantification of live/dead cells based on staining of CT26GFP+ MDOTS on day 5 of ex vivo culture. One of two independent experiments is shown, with n=3 replicates per group per experiment. 2-way ANOVA, Tukey’s multiple comparisons test. E. A schematic summary of the therapy regimen used in the transplantable B16-F10 mouse model. F. Tumor volumes for all 4 groups. G. Survival of B16-F10 tumor-bearing mice treated with CD39i in combination with anti-TIM3. H. Tumor volumes for untreated, anti-PD-1, CD39i and anti-PD-1+CD39i treated groups. I. Survival of B16-F10 tumor-bearing mice treated with CD39i + anti-PD-1. J. Tumor volumes for untreated, anti-PD-1/CTLA4, CD39i, anti-PD-1/CTLA4+CD39i. K. Survival of B16-F10 tumor-bearing mice treated with CD39i and anti-PD-1/CTLA4. Data are represented as mean±SEM. For in vivo mouse tumor models one of two independent experiments is shown.
Figure 6.
Figure 6.. Differential chromatin accessibility in CD39+TIM3+ and CD39TIM3 cells.
A. Schematic of ATAC-seq analysis performed on sorted CD39+TIM3+ and CD39TIM3-cells. B. Heatmap describing averaged scaled expression values of differentially expressed transcription factors for sorted CD39+TIM3+ and CD39TIM3 cells. C. Heatmap describing patient specific (n=5) differentially accessible regions (FDR<0.01) in CD39+TIM3+ and CD39TIM3 sorted populations. D. ATAC-seq traces for open chromatin regions near selected genes in CD39+TIM3+ (orange) and CD39TIM3 (blue) cells. E. Graph depicting enrichment of TF motifs based on open chromatin specific to CD39TIM3 (blue) vs. CD39+TIM3+ (orange) cells (x-axis), and differential expression of TFs (y-axis). F. Left, enhancer binding sites for BATF and TCF7 near the listed genes. Significant genes, red; non-significant, white. The same genes are also differentially expressed between CD39+TIM3+ cells and CD39TIM3 cells. Right, the number of genes that are differentially expressed with a corresponding differential peak containing BATF or TCF7 is shown.
Figure 7.
Figure 7.. TCR analysis and its relationship with cell state and clinical outcome.
A. Schematic illustration of the TCR analysis pipeline. B, E, H, K. tSNE plot delineating 6 CD8+ T cell clusters and persistent (B), enriched (E), singlet (H) and common (K) TCRs. Bar plot summarizes fraction of TCRs per patient across the different clusters between responder (R) and non-responder (NR) lesions. C, F, I, L. Fraction of persistent (C), enriched (F), singlet (I) and common (L) TCRs per patient, aggregated for CD8_1,2,3 and CD8_4,5,6 clusters for R and NR lesions. D, G, J, M. Fraction of persistent (D), enriched (G), singlet (J) and common (M) TCRs in each cluster, out of total persistent, enriched, singlet and common TCRs. Data are represented as mean±SEM.

Comment in

References

    1. Allard B, Pommey S, Smyth MJ, and Stagg J (2013). Targeting CD73 enhances the antitumor activity of anti-PD-1 and anti-CTLA-4 mAbs. Clin Cancer Res 19, 5626–5635. - PubMed
    1. Anderson AC, Joller N, and Kuchroo VK (2016). Lag-3, Tim-3, and TIGIT: Co-inhibitory Receptors with Specialized Functions in Immune Regulation. Immunity 44, 989–1004. - PMC - PubMed
    1. Ayers M, Lunceford J, Nebozhyn M, Murphy E, Loboda A, Kaufman DR, Albright A, Cheng JD, Kang SP, Shankaran V, et al. (2017). IFN-gamma-related mRNA profile predicts clinical response to PD-1 blockade. J Clin Invest 127, 2930–2940. - PMC - PubMed
    1. Bastid J, Regairaz A, Bonnefoy N, Dejou C, Giustiniani J, Laheurte C, Cochaud S, Laprevotte E, Funck-Brentano E, Hemon P, et al. (2015). Inhibition of CD39 enzymatic function at the surface of tumor cells alleviates their immunosuppressive activity. Cancer Immunol Res 3, 254–265. - PubMed
    1. Bolotin DA, Poslavsky S, Mitrophanov I, Shugay M, Mamedov IZ, Putintseva EV, and Chudakov DM (2015). MiXCR: software for comprehensive adaptive immunity profiling. Nat Methods 12, 380–381. - PubMed

Publication types

MeSH terms