. 2018 Nov 1;15(11):2438.
doi: 10.3390/ijerph15112438.

Heat-Related Health Impacts under Scenarios of Climate and Population Change

Affiliations

Heat-Related Health Impacts under Scenarios of Climate and Population Change

Philip E Morefield et al. Int J Environ Res Public Health. .

Abstract

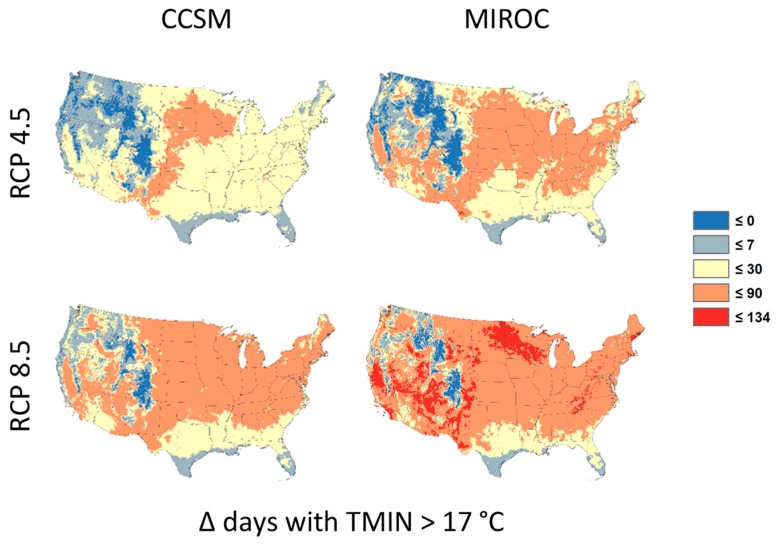
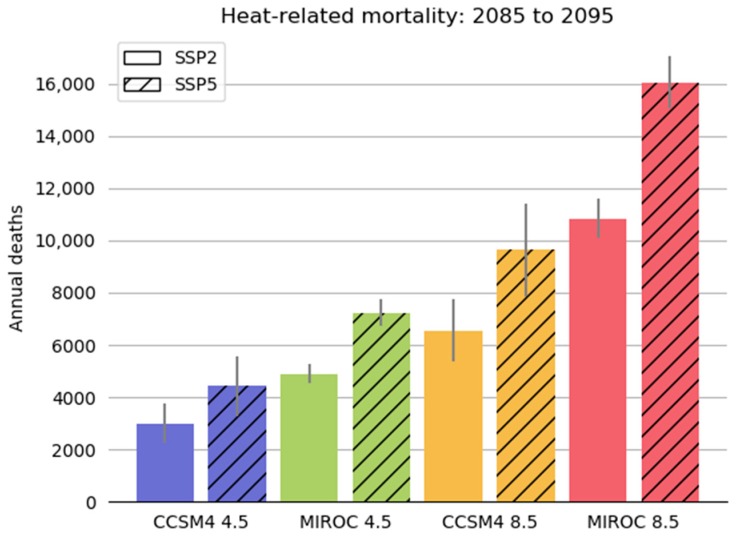
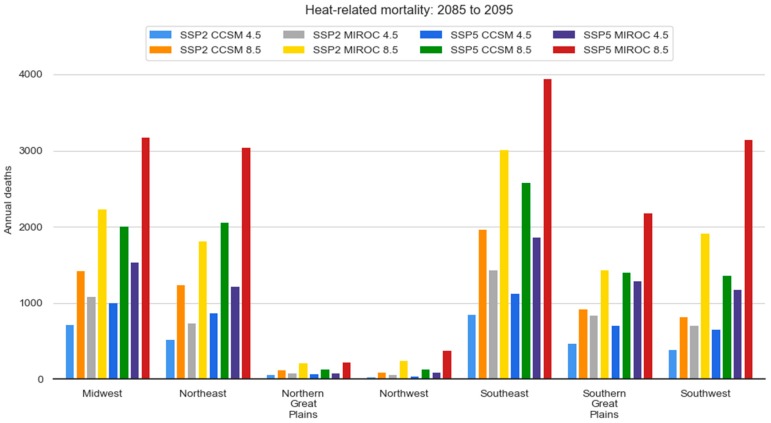
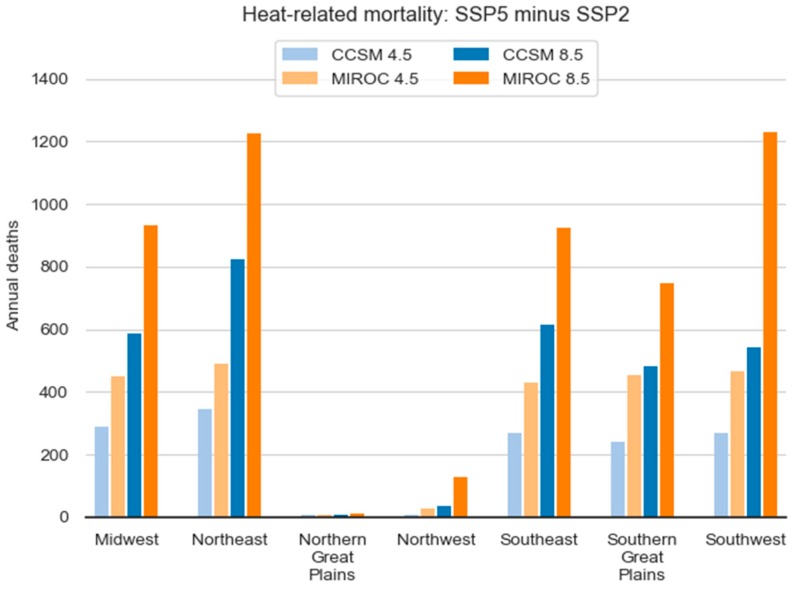
Recent assessments have found that a warming climate, with associated increases in extreme heat events, could profoundly affect human health. This paper describes a new modeling and analysis framework, built around the Benefits Mapping and Analysis Program-Community Edition (BenMAP), for estimating heat-related mortality as a function of changes in key factors that determine the health impacts of extreme heat. This new framework has the flexibility to integrate these factors within health risk assessments, and to sample across the uncertainties in them, to provide a more comprehensive picture of total health risk from climate-driven increases in extreme heat. We illustrate the framework's potential with an updated set of projected heat-related mortality estimates for the United States. These projections combine downscaled Coupled Modeling Intercomparison Project 5 (CMIP5) climate model simulations for Representative Concentration Pathway (RCP)4.5 and RCP8.5, using the new Locating and Selecting Scenarios Online (LASSO) tool to select the most relevant downscaled climate realizations for the study, with new population projections from EPA's Integrated Climate and Land Use Scenarios (ICLUS) project. Results suggest that future changes in climate could cause approximately from 3000 to more than 16,000 heat-related deaths nationally on an annual basis. This work demonstrates that uncertainties associated with both future population and future climate strongly influence projected heat-related mortality. This framework can be used to systematically evaluate the sensitivity of projected future heat-related mortality to the key driving factors and major sources of methodological uncertainty inherent in such calculations, improving the scientific foundations of risk-based assessments of climate change and human health.

Keywords: climate change; heat-related mortality; risk assessment.


Conflict of interest statement

The authors declare no conflict of interest.

Figures

Figure 1
Figure 1
Results for this study were summarized by National Climate Assessment regions.
Figure 2
Figure 2
Total population by National Climate Assessment region for 2010, and for 2090 under SSP2 and SSP5 scenarios.
Figure 3
Figure 3
Population change by county between 2010 and 2090 under SSP2 (A) and SSP5 (B).
Figure 4
Figure 4
Locating and Selecting Scenarios Online (LASSO) scatterplot used to select climate projections. Climate models are denoted with a number shown to the right of the figure. Subscripts indicate the realization number of individual projections, i.e., some climate models produced multiple simulations. For this study, MIROC-ESM-CHEM (321) was chosen to represent the upper bound of potential temperature change. CCSM4 (66) was selected because it provided a more moderate projection of change and has been used in other recent modeling studies.
Figure 5
Figure 5
Representative maps of CCSM and MIROC climate change projections under RCP4.5 and RCP8.5 emissions scenarios. Colors denote the change in the average annualized number of warm season days where the minimum temperature exceeds 17° Celsius for the period 2085 to 2095 using 1995 to 2005 as the baseline period.
Figure 6
Figure 6
National BenMAP modeling results. The columns represent annual mortality averaged over 11 years. The thin vertical lines represent the range in annual heat mortality estimates.
Figure 7
Figure 7
Regional modeling results by combination of population scenario, climate model, and emissions scenario.
Figure 8
Figure 8
Population projections had the largest influence overall in the Northeast and Southwest.
Figure 9
Figure 9
For the Northeast region, MIROC-ESM-CHEM does not fully capture the upper end of projected temperature changes.

References

    1. Centers for Disease Control and Prevention Heat-Related Mortality—Chicago, July 1995. Morb. Mortal. Wkly. Rep. 1995;44:577–579. - PubMed
    1. Semenza J.C., Rubin C.H., Falter K.H., Selanikio J.D., Flanders W.D., Howe H.L., Wilhelm J.L. Heat-related deaths during the July 1995 heat wave in Chicago. N. Engl. J. Med. 1996;335:84–90. doi: 10.1056/NEJM199607113350203. - DOI - PubMed
    1. Semenza J.C., McCullough J.E., Flanders W.D., McGeehin M.A., Lumpkin J.R. Excess hospital admissions during the July 1995 heat wave in Chicago. Am. J. Prev. Med. 1999;16:269–277. doi: 10.1016/S0749-3797(99)00025-2. - DOI - PubMed
    1. Centers for Disease Control and Prevention Heat-related deaths—Philadelphia and United States, 1993–1994. Morb. Mortal. Wkly. Rep. 1994;43:453–455. - PubMed
    1. Knowlton K., Rotkin-Ellman M., King G., Margolis H.G., Smith D., Solomon G., Trent R., English P. The 2006 California Heat Wave: Impacts on Hospitalizations and Emergency Department Visits. Environ. Health Perspect. 2009;117:61–67. doi: 10.1289/ehp.11594. - DOI - PMC - PubMed

Publication types