

Association of BMI with overall and cause-specific mortality: a population-based cohort study of 3·6 million adults in the UK
- PMID: 30389323
- PMCID: PMC6249991
- DOI: 10.1016/S2213-8587(18)30288-2
Association of BMI with overall and cause-specific mortality: a population-based cohort study of 3·6 million adults in the UK
Abstract
Background: BMI is known to be strongly associated with all-cause mortality, but few studies have been large enough to reliably examine associations between BMI and a comprehensive range of cause-specific mortality outcomes.
Methods: In this population-based cohort study, we used UK primary care data from the Clinical Practice Research Datalink (CPRD) linked to national mortality registration data and fitted adjusted Cox regression models to examine associations between BMI and all-cause mortality, and between BMI and a comprehensive range of cause-specific mortality outcomes (recorded by International Classification of Diseases, 10th revision [ICD-10] codes). We included all individuals with BMI data collected at age 16 years and older and with subsequent follow-up time available. Follow-up began at whichever was the latest of: start of CPRD research-standard follow up, the 5-year anniversary of the first BMI record, or on Jan 1, 1998 (start date for death registration data); follow-up ended at death or on March 8, 2016. Fully adjusted models were stratified by sex and adjusted for baseline age, smoking, alcohol use, diabetes, index of multiple deprivation, and calendar period. Models were fitted in both never-smokers only and the full study population. We also did an extensive range of sensitivity analyses. The expected age of death for men and women aged 40 years at baseline, by BMI category, was estimated from a Poisson model including BMI, age, and sex.
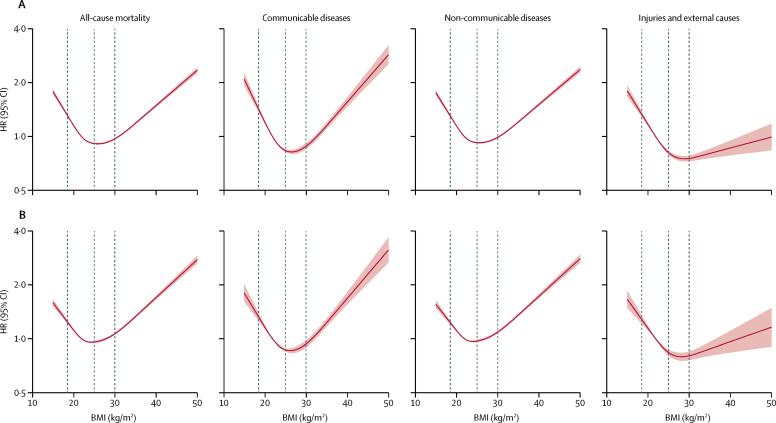
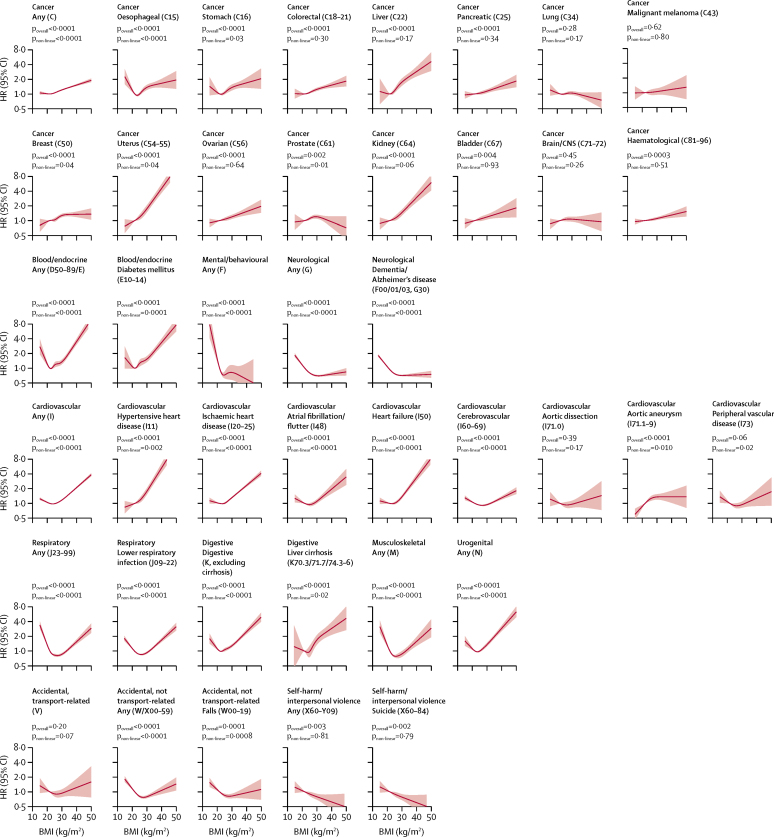
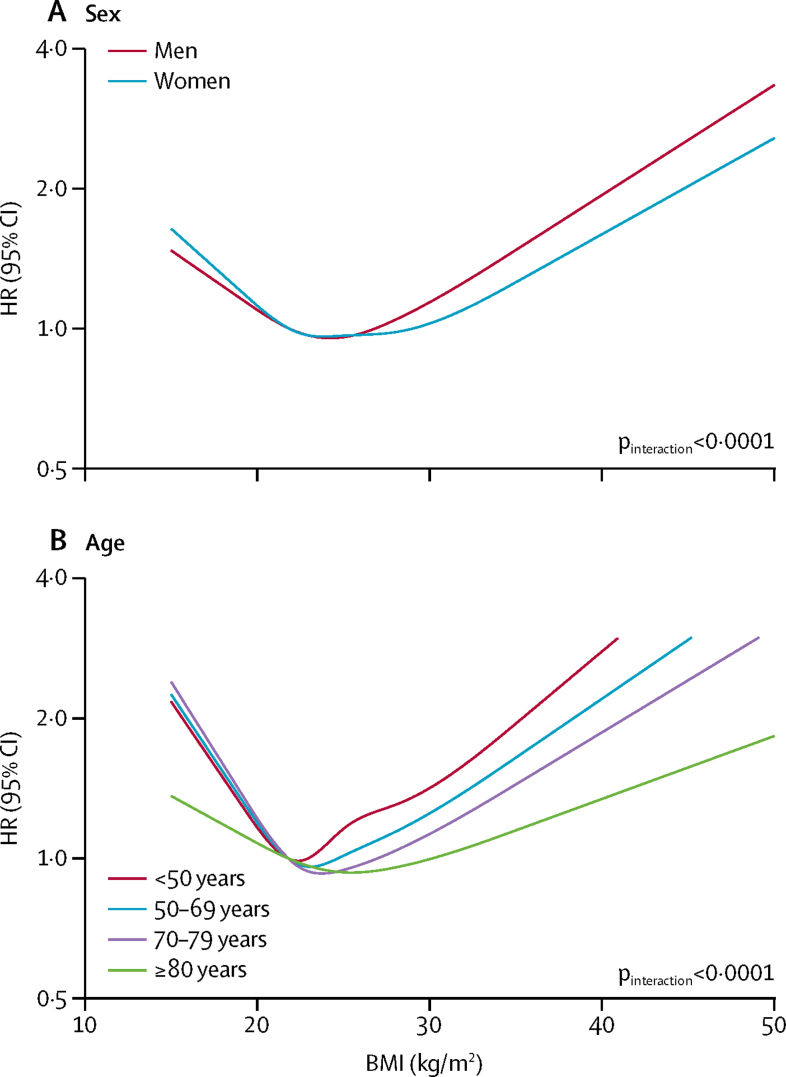
Findings: 3 632 674 people were included in the full study population; the following results are from the analysis of never-smokers, which comprised 1 969 648 people and 188 057 deaths. BMI had a J-shaped association with overall mortality; the estimated hazard ratio per 5 kg/m2 increase in BMI was 0·81 (95% CI 0·80-0·82) below 25 kg/m2 and 1·21 (1·20-1·22) above this point. BMI was associated with all cause of death categories except for transport-related accidents, but the shape of the association varied. Most causes, including cancer, cardiovascular diseases, and respiratory diseases, had a J-shaped association with BMI, with lowest risk occurring in the range 21-25 kg/m2. For mental and behavioural, neurological, and accidental (non-transport-related) causes, BMI was inversely associated with mortality up to 24-27 kg/m2, with little association at higher BMIs; for deaths from self-harm or interpersonal violence, an inverse linear association was observed. Associations between BMI and mortality were stronger at younger ages than at older ages, and the BMI associated with lowest mortality risk was higher in older individuals than in younger individuals. Compared with individuals of healthy weight (BMI 18·5-24·9 kg/m2), life expectancy from age 40 years was 4·2 years shorter in obese (BMI ≥30·0 kg/m2) men and 3·5 years shorter in obese women, and 4·3 years shorter in underweight (BMI <18·5 kg/m2) men and 4·5 years shorter in underweight women. When smokers were included in analyses, results for most causes of death were broadly similar, although marginally stronger associations were seen among people with lower BMI, suggesting slight residual confounding by smoking.
Interpretation: BMI had J-shaped associations with overall mortality and most specific causes of death; for mental and behavioural, neurological, and external causes, lower BMI was associated with increased mortality risk.
Funding: Wellcome Trust.
Copyright © 2018 The Author(s). Published by Elsevier Ltd. This is an Open Access article under the CC BY 4.0 license. Published by Elsevier Ltd.. All rights reserved.
Figures
Comment in
-
The association between BMI and mortality: implications for obesity prevention.Lancet Diabetes Endocrinol. 2018 Dec;6(12):916-917. doi: 10.1016/S2213-8587(18)30309-7. Epub 2018 Oct 30. Lancet Diabetes Endocrinol. 2018. PMID: 30389322 No abstract available.
-
Evidence on the contribution of body mass index to mortality: What does this mean for India?Natl Med J India. 2019 Jul-Aug;32(4):231-232. doi: 10.4103/0970-258X.291307. Natl Med J India. 2019. PMID: 32769245 No abstract available.
References
Publication types
MeSH terms
Grants and funding
LinkOut - more resources
Full Text Sources
Medical
