. 2019 Jan 1;79(1):209-219.
doi: 10.1158/0008-5472.CAN-18-0717. Epub 2018 Nov 2.

Activation of PP2A and Inhibition of mTOR Synergistically Reduce MYC Signaling and Decrease Tumor Growth in Pancreatic Ductal Adenocarcinoma

Affiliations

Activation of PP2A and Inhibition of mTOR Synergistically Reduce MYC Signaling and Decrease Tumor Growth in Pancreatic Ductal Adenocarcinoma

Brittany L Allen-Petersen et al. Cancer Res. .

Abstract

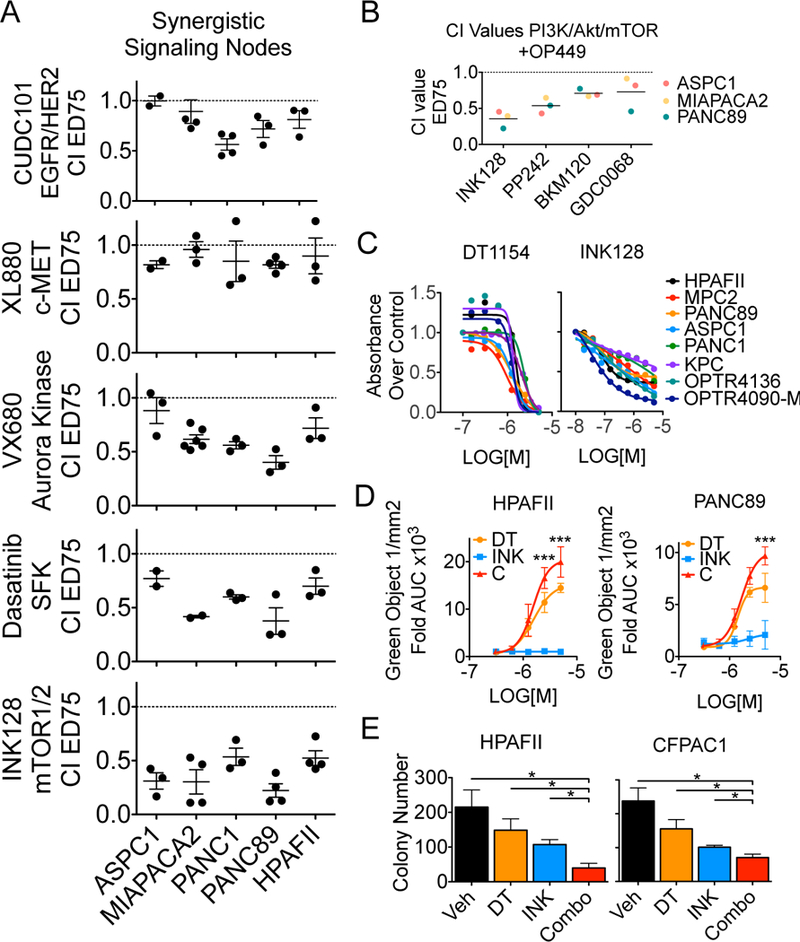
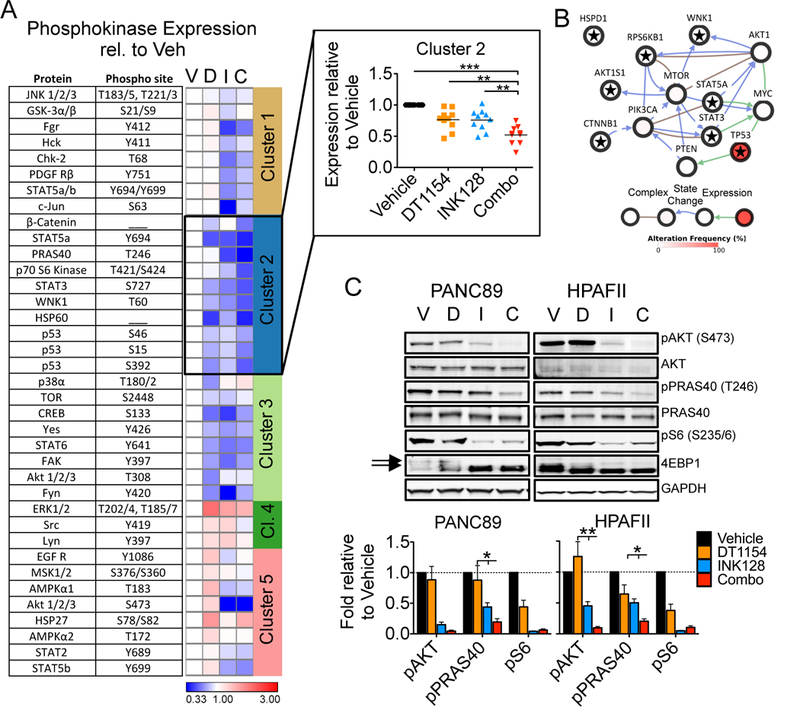
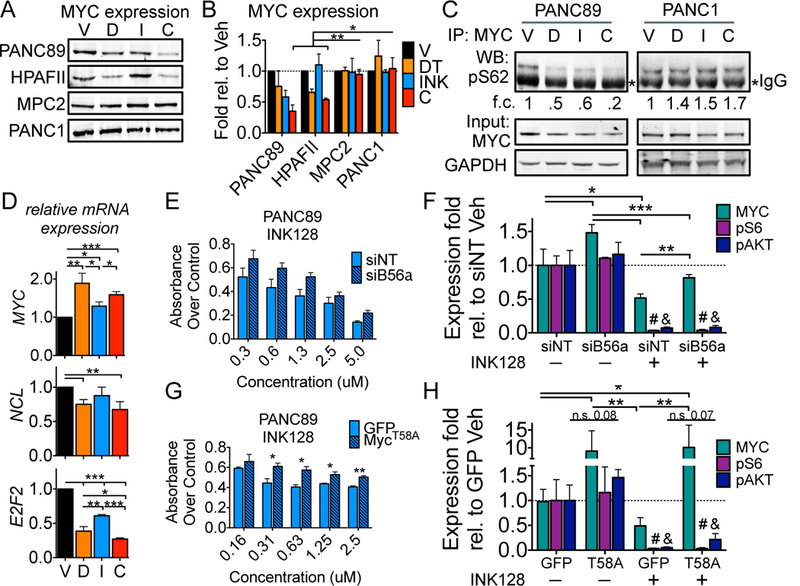
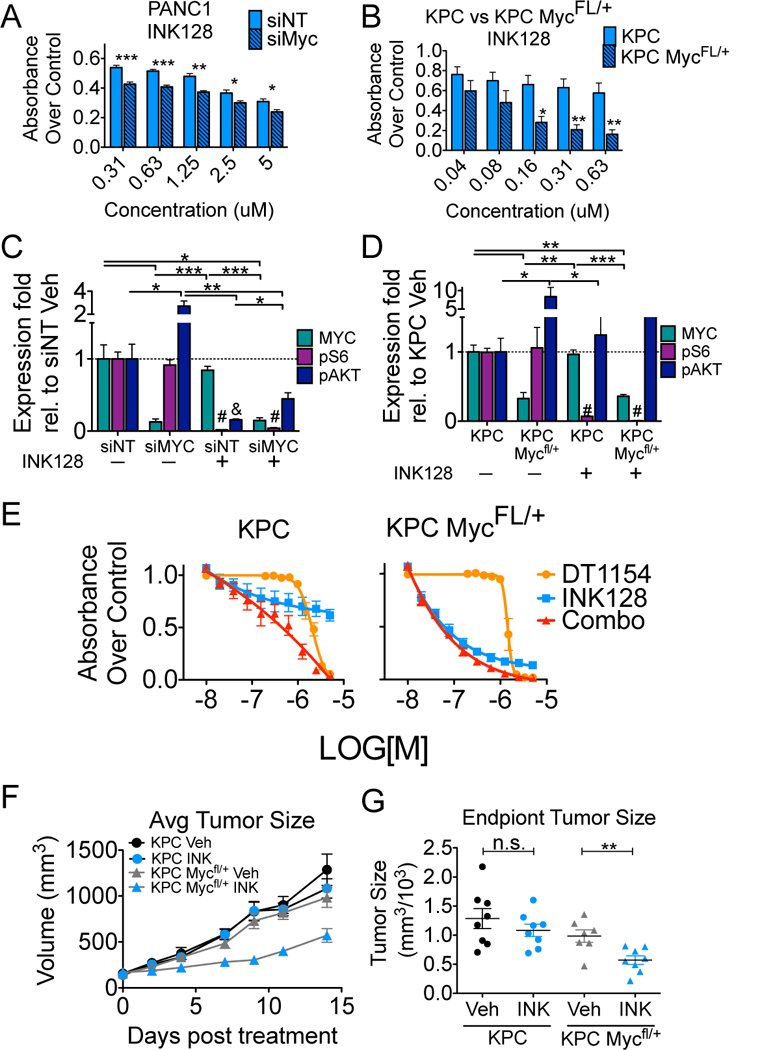
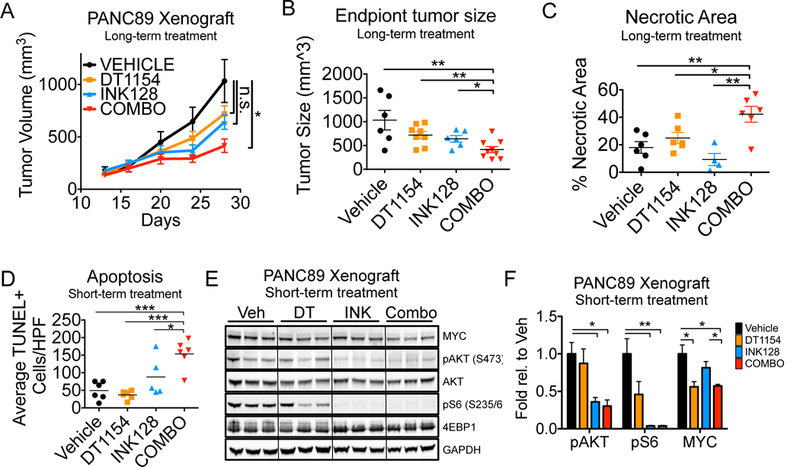
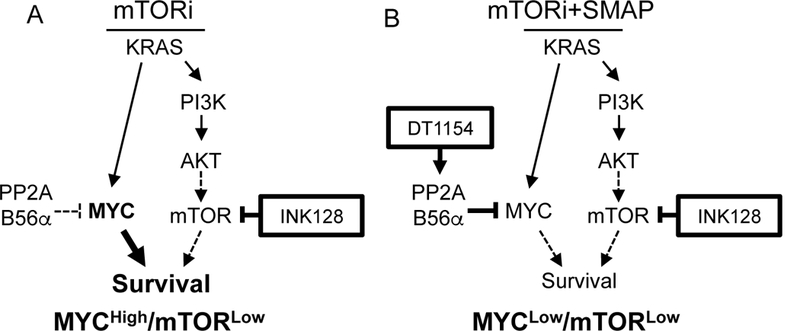
In cancer, kinases are often activated and phosphatases suppressed, leading to aberrant activation of signaling pathways driving cellular proliferation, survival, and therapeutic resistance. Although pancreatic ductal adenocarcinoma (PDA) has historically been refractory to kinase inhibition, therapeutic activation of phosphatases is emerging as a promising strategy to restore balance to these hyperactive signaling cascades. In this study, we hypothesized that phosphatase activation combined with kinase inhibition could deplete oncogenic survival signals to reduce tumor growth. We screened PDA cell lines for kinase inhibitors that could synergize with activation of protein phosphatase 2A (PP2A), a tumor suppressor phosphatase, and determined that activation of PP2A and inhibition of mTOR synergistically increase apoptosis and reduce oncogenic phenotypes in vitro and in vivo. This combination treatment resulted in suppression of AKT/mTOR signaling coupled with reduced expression of c-MYC, an oncoprotein implicated in tumor progression and therapeutic resistance. Forced expression of c-MYC or loss of PP2A B56α, the specific PP2A subunit shown to negatively regulate c-MYC, increased resistance to mTOR inhibition. Conversely, decreased c-MYC expression increased the sensitivity of PDA cells to mTOR inhibition. Together, these studies demonstrate that combined targeting of PP2A and mTOR suppresses proliferative signaling and induces cell death and implicates this combination as a promising therapeutic strategy for patients with PDA. SIGNIFICANCE: These findings present a combinatorial strategy targeting serine/threonine protein phosphatase PP2A and mTOR in PDA, a cancer for which there are currently no targeted therapeutic options.Graphical Abstract: http://cancerres.aacrjournals.org/content/canres/79/1/209/F1.large.jpg.


Conflict of interest statement

Conflict of Interest Statement:Dale J. Christensen is a shareholder in Oncotide Pharmaceuticals. Goutham Narla and Michael Ohlmeyer were on the Board of Dual Therapeutics, which had licensed DT1154 at the time of this study. All other authors have no conflicts of interest or competing financial interests to disclose. The Icahn School of Medicine at Mount Sinai, on behalf of Goutham Narla and Michael Ohlmeyer, has filed patents covering composition of matter on DT1154 and like small molecules for the treatment of human cancer and other diseases (International Application Numbers: PCT/US15/19770, PCT/US15/19764; and US Patent: US 9,540,358 B2). Rappta Therapeutics, Inc. (established September 7th, 2017) has licensed this intellectual property on 12/8/2017 for the clinical and commercial development of this series of small molecule PP2A activators. Dale J. Christensen, Goutham Narla, and Rosalie C. Sears are founders with ownership interest in Rappta Therapeutics, Inc. with no or minor compensation (under $10,000). Brett Sheppard has an advisory relationship with Pfizer with minor compensation (under $10,000).

Figures

Fig. 1:
Fig. 1:
PP2A activation increases the cytotoxic effects of select kinase inhibitors. A. CI values at effective dose (ED) 75 for pancreatic cells lines treated with increasing concentrations of OP449 and select kinase inhibitors. Mean +/− SEM of biological replicates. B. CI values at ED75 of ASPC1, MIAPACA2, and PANC89 treated with INK128, PP242, BKM120, or GDC0068. Values for each cell line were generated from 2 (MIAPACA2- GDC0068) or 3 biological reps. Grand mean of all lines for each drug shown. C. PDA cell lines were treated with increasing doses of DT1154 (left) or INK128 (right) for 72 hours. Shown is the viability relative to Vehicle for each line. MIAPACA2 (MPC2) D. CellTox Green was added to HPAFII and PANC89 cells and then cells were treated with increasing concentrations of DT1154 and INK128. Fluorescent cells were imaged every 2 hours for 72 hours on an Incucyte Zoom. Shown is the area under the curve (AUC) generated from the green object count (1/mm2) over time relative to Vehicle control. Graph represents average of three biological replicates. ***P <0.001 by a 2-way ANOVA. E. HPAFII and CFPAC1 cells were plated in a soft agar colony assay and treated with Vehicle, 500nM DT1154, 10nM INK128, or combination. Colony number was quantified using ImageJ. Mean +/− SEM of three biological replicates. *p<0.05 by a two-tailed students t-test.
Fig. 2:
Fig. 2:
Combination of DT1154 and INK128 synergistically attenuates AKT/mTOR oncogenic signaling A. PANC89 cells were treated with Vehicle (V), DT1154 (D, 10μM), INK128 (I, 0.5μM), or the combination of DT1154 and INK (C) for 6 hours and cell lysates were probed using a phosphokinase array. Quantification of phospho-specific sites for each kinase relative to Vehicle control was used to generate a heat map using Morpheus and KMeans clustering was performed using one minus pearson correlation (Clusters 1–5). Phosphorylation sites, proteins, and expression values can be found in Supplemental Table 2. Inset shows the expression of the phosphorylated proteins in Cluster 2 relative to Vehicle control. Grand mean shown. ***p<0.001 **p<0.01 *p<0.05 by a 1-way ANOVA. B. A pathway Commons network map generated from targets in Cluster 2 using the QCMG, Nature 2016 dataset from CBio Portal. Complex, state change, expression, and alteration frequency between proteins are shown. Gene names of targets in Cluster 2 are denoted by a star. C. PANC89 and HPAFII cells were treated as in panel A and probed by western blot for pAKT (S473), pPRAS40 (T246), pS6 (S235/6) and totals. Representative blots and quantification of three biological replicates shown. Arrows indicate phosphorylated form of 4EBP1. pS6 quantified over GAPDH. Mean +/− SEM. *p<0.05 by two-tailed students t-test.
Fig. 3:
Fig. 3:
PP2A activation suppresses MYC mediated resistance to mTOR inhibition A and B. PANC89, HPAFII, MIAPACA2 (MPC2), and PANC1 cells were treated with Vehicle (V), DT1154 (D; 10μM), INK128 (I; 0.5μM), or the combination (C) for 6 hours and lysates were probed by western blot. Representative blot (A) and quantification over GAPDH (B) of three biological replicates shown. Mean +/− SEM C. PANC89 and PANC1 cells were treated as in Figure 3A. Total MYC was immunoprecipitated and lysates were probed for phosphoS62 MYC (pS62). Inputs were probed for total MYC and GAPDH *denotes IgG heavy chain. Quantification of pS62 levels over GAPDH relative to Vehicle shown D. qPCR of MYC, NCL (Nucleolin), and E2F2 from PANC89 cells treated as in Figure 3A. Mean +/− SEM of three biological replicates. E. PANC89 cells transfected with non-targeting siRNA (siNT) or a B56α targeting siRNA pool (siB56α) were treated with increasing concentrations of INK128. Viability was assessed by MTS 72 hours after drug treatment. Mean +/− SEM of three biological replicates. F. Cells from panel E were treated with either Vehicle or 0.5μM INK128 for 6 hours. Lysates were analyzed by western blot for MYC, pAKT (S473), pS6 (S235/6) and totals. Quantification from three biological replicates is shown. Mean +/− SD. G. PANC89 cells transfected with AdGFP (GFP) or AdMYCT58A (T58A) were treated with increasing concentrations of INK128. Viability was assessed by MTS 72 hours after drug treatment. Mean +/− SEM of three biological replicates. H. Cells from panel G were treated with either Vehicle or 0.5μM INK128 for 6 hours. Lysates were analyzed by western blot as above. Quantification from three biological replicates is shown. Mean +/−SD. For all panels ***p<0.001 **p<0.01 *p<0.05 by two-tailed students t-test; #, & denotes pS6 or pAKT levels, respectively, are significantly different in INK128 conditions compared to Vehicle.
Fig. 4:
Fig. 4:
Decreased Myc expression sensitizes PDA cells to mTOR inhibition in vitro and in vivo A. PANC1 cells transfected with non-targeting siRNA (siNT) or MYC targeting siRNA (siMYC) were treated with increasing concentrations of INK128. Viability was assessed by MTS 72 hours after drug treatment. Mean +/−SEM of three biological replicates. B. Cells derived from KPC or KPC Mfl/+ mice were treated with increasing concentrations of INK128. Viability was assessed by MTS 72 hours after drug treatment. Mean +/−SEM of three biological replicates. C. Cells from panel A (siNT or siMYC) and D. cells from panel B (KPC or KPC Mfl/+) were treated with either Vehicle or 0.5μM INK128 for 6 hours. Lysates were analyzed by western blot for MYC, pAKT (S473), pS6 (S235/6) and totals. Quantification from three biological replicates is shown. Mean +/−SEM. E. KPC (left) and KPC Mfl/+ (right) cells were treated with either Vehicle or increasing concentrations of DT1154, INK128, or the combination for 72 hours. Viability relative to Vehicle was assessed by MTS. Average of 4 replicates across 2 biological experiments shown. Mean +/−SEM. For all panels ***p<0.001 **p<0.01 *p<0.05 by two-tailed students t-test. #, & denotes pS6 or pAKT levels, respectively, are significantly different in INK128 conditions compared to Vehicle. F. KPC and KPC Mfl/+ cells were injected subcutaneous and then treated with either Vehicle or INK128 (0.5 mg/kg oral gavage, once a day/6 days a week). Tumor volume was measured across time. Mean +/− SEM. n= 8 KPC, 8 KPC+INK128, 7 KPC Mfl/+, 8 KPC Mfl/++INK128. G. Quantification of end point tumor size from panel F. **p<0.01 by two-tailed students t-test
Fig. 5:
Fig. 5:
PP2A activation combined with mTOR inhibition decreases tumorigenic properties in vitro and in vivo A. PANC89 were grown subcutaneously and mice were treated with Vehicle, DT1154 (15mg/kg), INK128 (0.5 mg/kg), or combination. Tumors were calipered and tumor volume was plotted across time. Mean +/− SEM shown. n= 6 Vehicle, 8 DT1154, 6 INK128, and 9 combination treated tumors. Area under the curve was analyzed for each treatment arm, *p<0.05 by a 1-way ANOVA B. Quantification of end point tumor size from panel B. Mean +/− SEM shown. C. Quantification of necrotic tumor area from H/E images using ImageJ. Mean +/− SEM shown. D. PANC89 xenograft tumors were grown as in panel A and harvested after 7 days of treatment with Vehicle (Veh), DT1154 (DT, 15mg/kg), INK128 (INK, 0.5 mg/kg), or combination (Combo). Tissues sections were stained with the ApopTag Plus Peroxidase In Situ Kit and the number of TUNEL positive cells was quantified per high-powered field (HPF, 20x). ***p<0.001 *p<0.05 by a 1-way ANOVA. E. Lysates from tumors grown in panel D were analyzed by western blot for MYC, pAKT (S473), pS6 (S235/6), 4EBP1, and totals. F. Quantification of 3 tumors in each treatment group from panel E shown. Mean +/−SEM. **p<0.01 *p<0.05 by two-tailed students t-test
Fig. 6:
Fig. 6:
PP2A activation combined with mTOR inhibition as a therapeutic strategy to reduce PDA survival. A. Oncogenic KRAS drives the activation of both the MYC and PI3K/AKT/mTOR pathways. Upon mTOR inhibition, PDA cells capitalize on low PP2A levels, signaling through MYC for survival, creating a MYCHigh/mTORLow cell state. B. Activation of PP2A combined with mTOR inhibition results in low MYC and mTOR signaling in a MYCLow/mTORLow cell state, decreasing PDA cell survival.

References

    1. Siegel RL, Miller KD, Jemal A. Cancer Statistics, 2017. CA Cancer J Clin. 2017;67(1):7–30. - PubMed
    1. Knickelbein K, Zhang L. Mutant KRAS as a critical determinant of the therapeutic response of colorectal cancer. Genes Dis. 2015;2(1):4–12. - PMC - PubMed
    1. Pao W, Wang TY, Riely GJ, Miller VA, Pan Q, Ladanyi M, et al. KRAS mutations and primary resistance of lung adenocarcinomas to gefitinib or erlotinib. PLoS Med. 2005;2(1):e17. - PMC - PubMed
    1. Chand S, O’Hayer K, Blanco FF, Winter JM, Brody JR. The Landscape of Pancreatic Cancer Therapeutic Resistance Mechanisms. Int J Biol Sci. 2016;12(3):273–82. - PMC - PubMed
    1. Witkiewicz AK, McMillan EA, Balaji U, Baek G, Lin WC, Mansour J, et al. Whole-exome sequencing of pancreatic cancer defines genetic diversity and therapeutic targets. Nat Commun. 2015;6:6744. - PMC - PubMed

Publication types

MeSH terms