. 2019 Jan 1;79(1):196-208.
doi: 10.1158/0008-5472.CAN-18-1615. Epub 2018 Nov 2.

Adipokines Deregulate Cellular Communication via Epigenetic Repression of Gap Junction Loci in Obese Endometrial Cancer

Affiliations

Adipokines Deregulate Cellular Communication via Epigenetic Repression of Gap Junction Loci in Obese Endometrial Cancer

Srikanth R Polusani et al. Cancer Res. .

Abstract

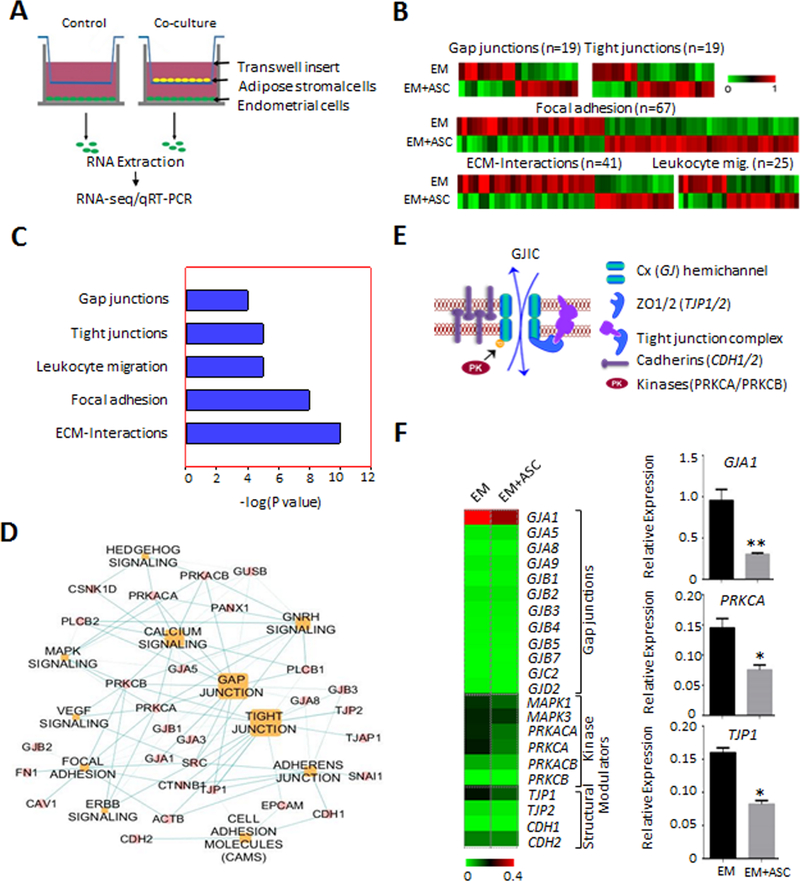
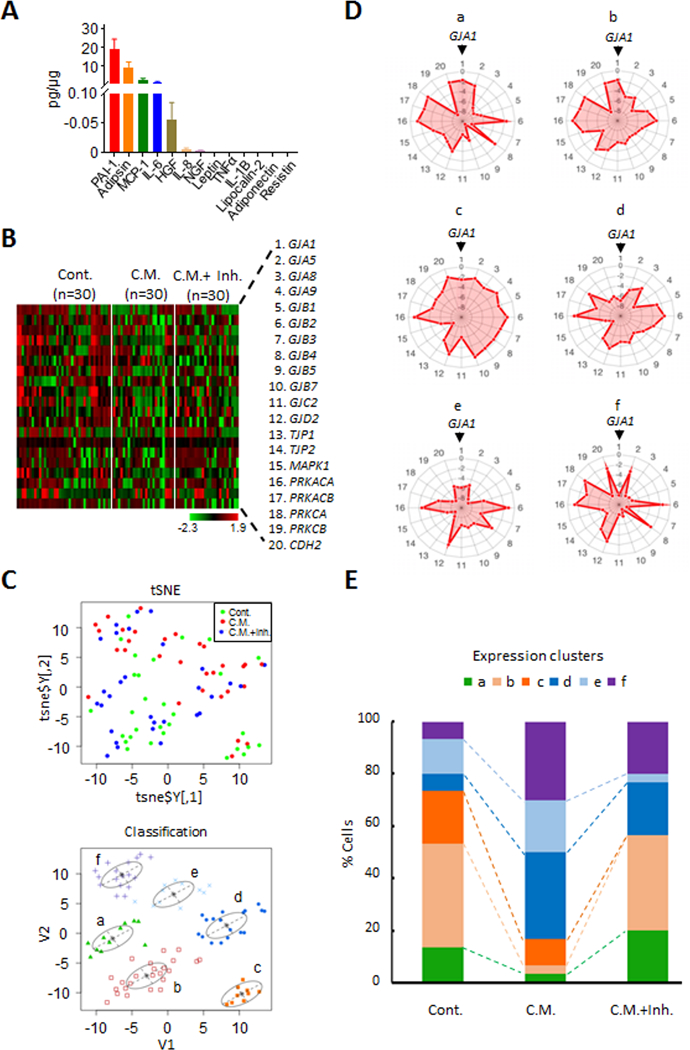
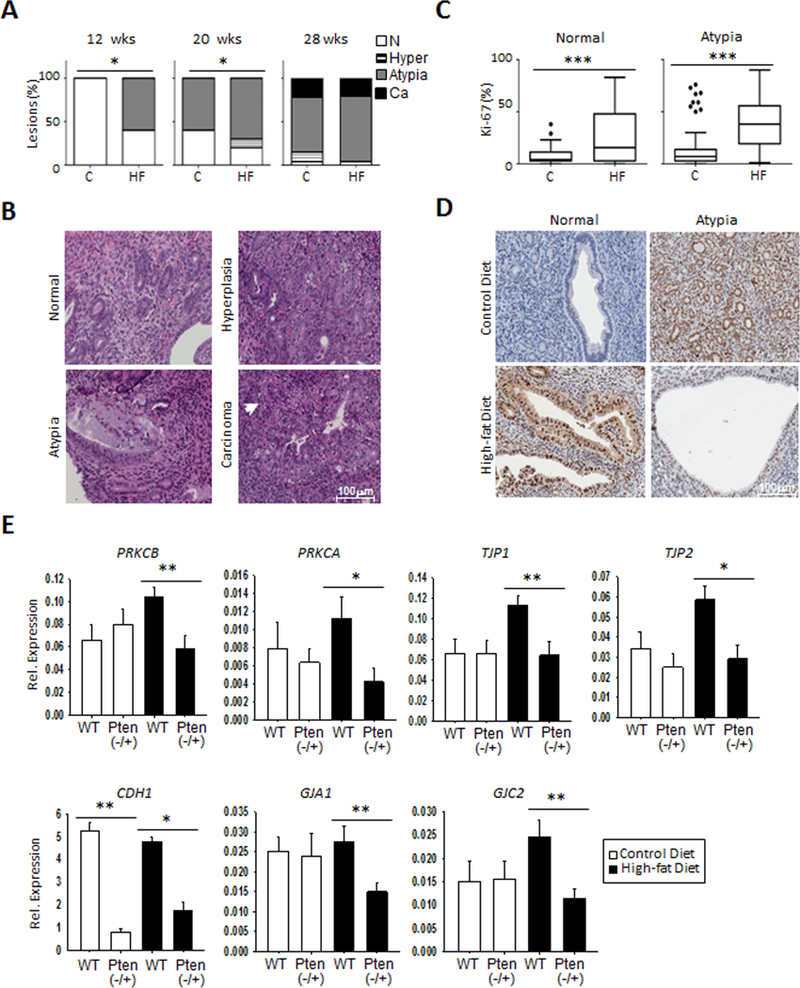
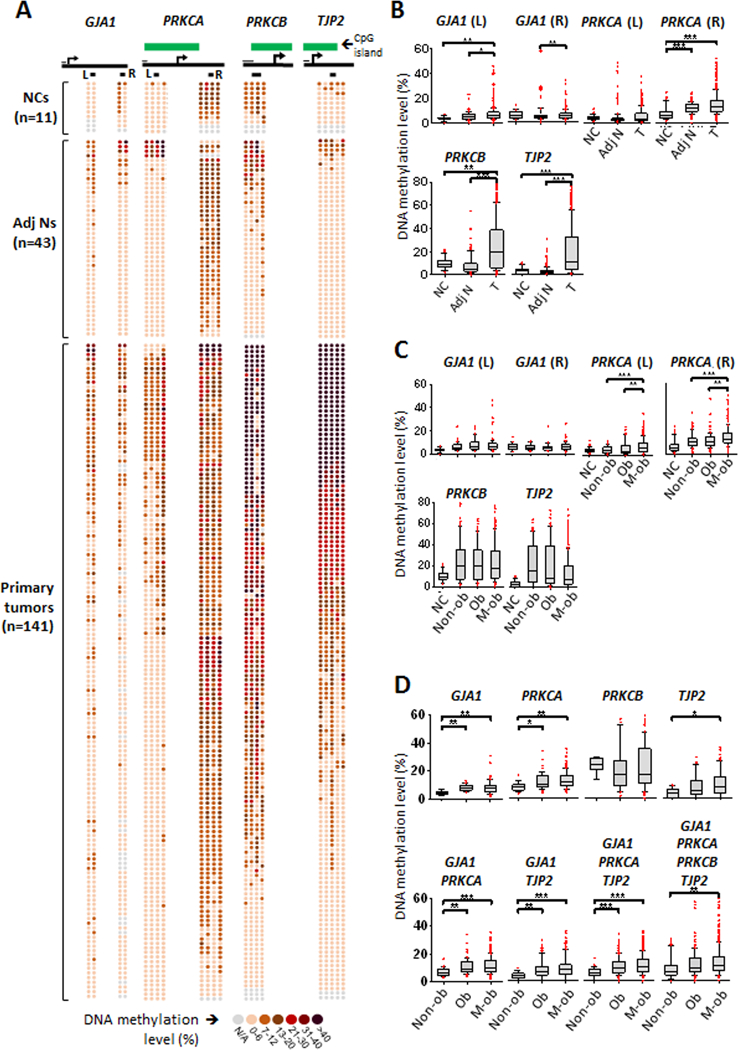
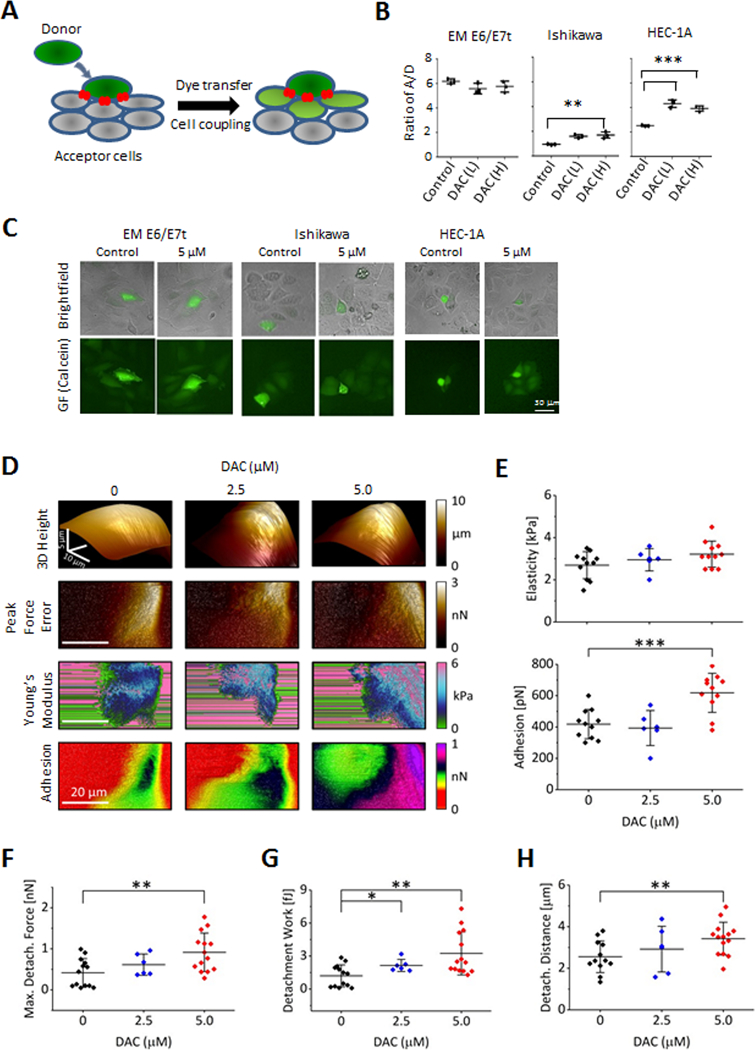
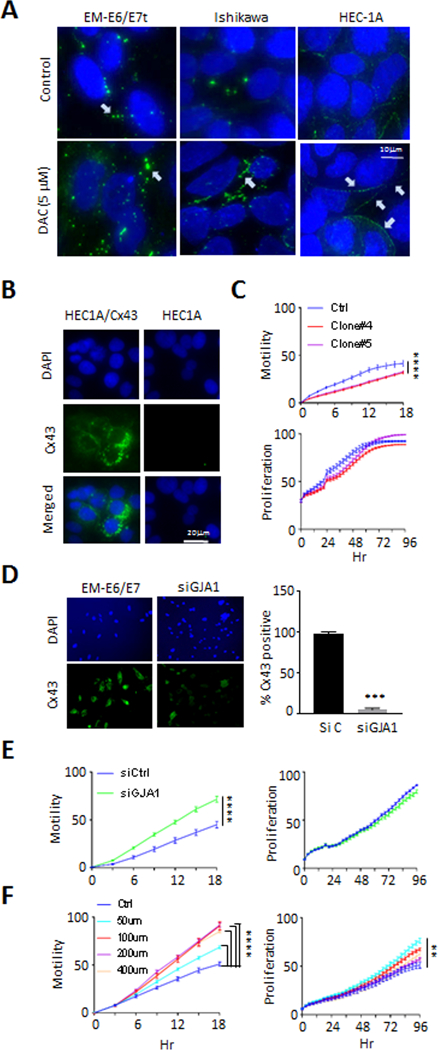
Emerging evidence indicates that adipose stromal cells (ASC) are recruited to enhance cancer development. In this study, we examined the role these adipocyte progenitors play relating to intercellular communication in obesity-associated endometrial cancer. This is particularly relevant given that gap junctions have been implicated in tumor suppression. Examining the effects of ASCs on the transcriptome of endometrial epithelial cells (EEC) in an in vitro coculture system revealed transcriptional repression of GJA1 (encoding the gap junction protein Cx43) and other genes related to intercellular communication. This repression was recapitulated in an obesity mouse model of endometrial cancer. Furthermore, inhibition of plasminogen activator inhibitor 1 (PAI-1), which was the most abundant ASC adipokine, led to reversal of cellular distribution associated with the GJA1 repression profile, suggesting that PAI-1 may mediate actions of ASC on transcriptional regulation in EEC. In an endometrial cancer cohort (n = 141), DNA hypermethylation of GJA1 and related loci TJP2 and PRKCA was observed in primary endometrial endometrioid tumors and was associated with obesity. Pharmacologic reversal of DNA methylation enhanced gap-junction intercellular communication and cell-cell interactions in vitro. Restoring Cx43 expression in endometrial cancer cells reduced cellular migration; conversely, depletion of Cx43 increased cell migration in immortalized normal EEC. Our data suggest that persistent repression by ASC adipokines leads to promoter hypermethylation of GJA1 and related genes in the endometrium, triggering long-term silencing of these loci in endometrial tumors of obese patients. SIGNIFICANCE: Studies reveal that adipose-derived stem cells in endometrial cancer pathogenesis influence epigenetic repression of gap junction loci, which suggests targeting of gap junction activity as a preventive strategy for obesity-associated endometrial cancer.


Conflict of interest statement

The authors declare no potential conflicts of interest

Figures

Figure 1.
Figure 1.. Gap junction genes are repressed in endometrial epithelial cells co-cultured with ASCs.
A, Diagram for the co-culture scheme of EME6/7t immortalized endometrial cells with ASCs, with ASCs plated in the transwell insert of a Boyden chamber and EME6/7t cells plated on the bottom of the well. Co-cultures and control (i.e., EME6/7t cells with no ASCs on the insert) were performed in duplicates. After three week co-culturing, EM-E6/7t cells were subjected to RNA extraction followed by RNA-seq analysis. B-D, Differential expression in cell communication and migration genes, including gap junction genes is observed (B). Pathway analysis reveal significant enrichment for gap junction, tight junctions, leukocyte endothelial migration, focal adhesion and ECM interaction genes, all of which play a role in cell-cell gap junctional coupling or are processes affected by this coupling (C). A gene network of the gap junction pathway is shown (D). E, A model for gap junction coupling is shown. It involves GJIC through formation of gap junction connexin channels between contiguous cells. Gap junction activities were regulated by kinases (such as PRKCB) as well as adhesion proteins (e.g., cadherins and tight junction proteins), facilitating formation of membrane gap junction plaques for efficient cell-cell communication. F, Validation of RNA-seq by RT-PCR reveals that these gap junction modulators are differentially repressed in EME6/7t cell exposed to ASCs. Repression of GJA1, encoding Cx43, the major connexin, is also repressed due to ASC exposure.
Figure 2.
Figure 2.. PAI-1 secreted from adiposity derived ASCs modulates GJ-associated loci in EME6/7t cells.
A, FlexMap multiplexing assays was used to determine secreted adipokine and cytokine factors from obesity derived ASCs after culturing for 48-hrs. B, Because PAI-1 was the most abundant factor in the 48-hr ASC conditioned media, EME6/7t cells were exposed to the conditioned media in the presence or absence of the PAI-1 inhibitor tiplaxtinin (50 μM). Treatments were carried out for 24-hrs. The cells were then subjected to single-cell isolation and single-cell microfluidic PCR expression analysis, and heat maps shown demonstrating the differential expression patterns of control cells, cells exposed to conditioned media alone, and cells exposed to conditioned media with tiplaxtinin. C-E, Single-cell expression analysis was performed to determine the effects of tiplaxtinin treatment on the expression of EME6/7t exposed to ASC conditioned media. tSNE analysis of expression profiles of control EME6/7t and cells exposed to conditioned media, with or without tiplaxtinin (C, top panel) reveals 6 clusters (C, tSNE lower panel, and D as shown by radar plots). In the radar plot, the genes from the expression heat map (numbered 1–20) in panel B are distributed around the circumference (starting with GJA1 on top), with the level of expression designated by the pink area emanating from the center of the circle (D). Histograms show these clusters corresponding to each treatment condition (E). Notably, clusters a and b present in control cells are drastically reduced in cells exposed to conditioned media (E). Treatment with tiplaxtinin restores these two clusters (E).
Figure 3.
Figure 3.. Gap junction modulators are repressed in an obesity mouse model of endometrial cancer.
A-D, High fat diet leads to obesity, as shown in Figure S2A; increased initiation of preneoplastic lesions at 20 and 28 weeks in the Pten−/+ heterozygous mice, but not in mice fed control diet (A-B), and higher levels of the proliferative marker Ki67 are observed (C-D). The percentage of atypia is elevated as early as 12 weeks on the high fat diet (HF), and remains higher in the HF group at 28 weeks. Hyperplasia is also more evident on the HF mice at 20 weeks, but both groups show similar carcinoma development at that time point (A). Representative images of normal endometrial tissue and those with hyperplasia, atypia, and carcinoma is shown (B). Increased Ki67 is observed for the high fat diet group in normal and endometrial tissue with atypia (C). Representative images of Ki67 staining are shown (D). E, RNA expression analysis by qRT-PCR reveals suppression of GJ-associated genes in Pten−/+ mice compared to wildtype (n=9), but only in the HF group. Such differences are absent in the control diet. *p<0.05; **p<0.01. The notable exception was CDH1, which shows similar decreases in Pten−/+ mice in both control and HF diets.
Figure 4.
Figure 4.. Elevated promoter methylation of GJA1 and GJ-associated loci in primary endometrial tumors is associated with obesity.
A-B, Hypermethylation of specific CpG sites for GJA1, PRKCA, PRKCB and TJP2 is observed in primary endometrial tumors from young, obese patients compared to normal endometrial tissue. Pyrosequecing of methylated CpG sites (circles) is shown for each sample (n=141); darker circles reflect higher methylation % (A). Green box designates CpG island. Under the CpG island box, gene body is represented as a thick solid black line with arrow indicating transcription start site (A). Short thin black line over the gene body represents scale of 100 bp, and thicker short black lines underneath the gene body indicates interrogated sites (A). For GJA1 and PRKCA, 2 sites were interrogated, whereas for PRKCB and TJP2 one site was interrogated based on the methylome patterns in Supplementary Fig. S3A. Box plots showing median expression of DNA methylation suggest increased DNA methylation in tumor compared for normal tissue (B). This pattern, uncovered by pyrosequencing, is consistent with the methylome shown in Supplementary Figure S3A. C, Promoter site methylation is interrogated for GJA1 (L) (non-cancerous n=16, non-obese n=48, obese n=42, morbidly obese n=118); GJA1 (R) (non-cancerous n=20, non-obese n=36, obese n=34, morbidly obese n=98); PRKCA (L) (non-cancerous n=4., non-obese n=88, obese n=64, morbidly obese n=236); PRKCA (R) (non-cancerous n=36, non-obese n=88, obese n=64, morbidly obese n=236); PRKCB (non-cancerous n=35, non-obese n=92, obese n=84, morbidly obese n=227); and TJP2 (non-cancerous n=45, non-obese n=118, obese n=105, morbidly obese n=292). Obese (BMI 30–35) and morbidly obese (BMI>35) patients exhibit significantly higher levels of methylation for PRKCA (p<0.01) compared to non-obese patients (BMI<30). Nonsignificant increases in median methylation are observed for GJA1, PRKCB, and TJP2. D, CpG Sites are interrogated for selected patients with co-morbidity for obesity (see Table S3) for GJA1 (L) (non-obese n=4, obese n=14; morbidly obese n=40); GJA1 (R) (non-obese n=4, obese n=8; morbidly obese n=26); PRKCA (L) (non-obese n=8, obese n=28, morbidly obese n=80); PRKCA (R) (non-obese n=8, obese n=28, morbidly obese n=80); PRKCB (non-obese n=8, obese n=28, morbidly obese n=80); and TJP2 (non-obese n=10; obese n=35; morbidly obese n=100). Significant methylation level increases in the morbidly obese group compared to non-obese group are observed for GJA1 (p<0.01), PRKCA (p<0.05) and TJP2 (p<0.01). Significant methylation level increases in the obese group compared to non-obese group are observed for GJA1 (p<0.01) and PRKCA (p<0.001). Increased methylation is observed in both the obese and morbidly obese (compared to non-obese) groups when different combinations of the profiles for GJA1, PRKCA and TJP2 are used (p<0.001).
Figure 5.
Figure 5.. Treatment with demethylation agent DAC restores GJIC and enhances cell-cell adhesion.
A, A scheme for the parachuting assay in which donor cells are labeled with gap junction permeable dye calcein. Transfer of dye (indicative of GJIC) is measured in recipient cells. B, In parachuting assays, DAC treatment restores GJIC in HEC-1A cells to the levels of the non-oncogenic immortalized line EME6/7t (B). A slight induction of GJIC is also observed in Ishikawa cells C, Representative images illustrative of GJIC induction of HEC-1A and Ishikawa cells are shown. D-E, DAC treatment increases cell to tip adhesion as shown with an array of AFM images of single cells scanned in the PF QNM mode. The first row shows a pseudo 3D height rendering of individual cells with different DAC treatments. Following rows represent 2D maps of surface topography (peak force error), elasticity (the Young’s modulus), and adhesion. An increase of the cell to AFM tip adhesion is noted only for HEC-1A cells treated with 5 μM DAC (D). Data extracted from the 2D AFM maps reveal that DAC treatments resulted in a significantly increased cellular adhesiveness (p<0.001) but had no effect on elasticity (E). F-H, Cell-cell adhesion was measured as described in Materials and Methods using AFM, by attaching a ‘tester’ living HEC-1A cell to the AFM tipless cantilever with PEI, which is then pressed with controlled force against a single HEC1–1A cell growing as part of a monolayer on the surface of a cell culture dish (illustrated in Supplementary Fig. S5). DAC treatment results in a significant systematic increase of the total detachment force (F; p<0.01), the maximum detachment work (G; p<0.01), and the distance required for a full separation of the interacting cells (H), confirming much stronger adhesion of the treated cells. Interestingly, the “snap point” distance – a distance at which a maximum pulling force is detected - significantly increased for the treated cells indicating involvement of substantial pull from cellular extensions (H; p<0.01). CTRL cells (n=13), and cells treated with 2.5 μM DAC (n=6) or 5.0 μM DAC (n=14) were tested over three separate experiments.
Figure 6.
Figure 6.. Restoration of Cx43 gap junction suppresses motility in HEC-1A endometrial cancer cells.
A, Labelling of Cx43 in intracellular pools was evident for EME6/7t and Ishikawa, and weekly observed in HEC-1A, with surface labeling of plaques between cells most evident in EME6/7t cells (white arrows). DAC treatment induces Cx43 gap junction plaque formation in Ishikawa and HEC-1A cells, although these were less organized in the Ishikawa cells. B-C, Restoration of Cx43 in HEC-1A cells by expression vector transduction was performed (B). This Cx43 induction resulted in decreased cellular migration of HEC-1A cells, with limited effects on proliferation (C). D-E, In complementary experiments, Knockdown of Cx43 by siRNA in EME6/7t cells, as demonstrated by immunofluorescence (D), led to enhanced cellular migration in scratch assays, with no effect on proliferation (E). Also, treating EME6/7t cells with the Cx43 gap junction specific peptide inhibitor, gap27, led to enhanced migration in a dose-dependent manner, with a limited effect on proliferation (F).

References

    1. Cramer DW. The epidemiology of endometrial and ovarian cancer. Hematol Oncol Clin North Am 2012;26(1):1–12. - PMC - PubMed
    1. Allen NE, Key TJ, Dossus L, Rinaldi S, Cust A, Lukanova A, et al. Endogenous sex hormones and endometrial cancer risk in women in the European Prospective Investigation into Cancer and Nutrition (EPIC). Endocr Relat Cancer 2008;15(2):485–97. - PMC - PubMed
    1. Soliman PT, Oh JC, Schmeler KM, Sun CC, Slomovitz BM, Gershenson DM, et al. Risk factors for young premenopausal women with endometrial cancer. Obstet Gynecol 2005;105(3):575–80. - PubMed
    1. Kost ER, Valente PT, Lynch BA, Krishnegowda NK, Hertz AM, Hall KL, et al. Clinical and Pathologic Features of Hispanic Endometrial Cancer Patients With Loss of Mismatch Repair Expression. Int J Gynecol Cancer 2016;26(6):1129–36. - PubMed
    1. Gui Y, Pan Q, Chen X, Xu S, Luo X, Chen L. The association between obesity related adipokines and risk of breast cancer: a systematic review and meta-analysis. Oncotarget 2017. - PMC - PubMed

Publication types

MeSH terms