. 2018 Nov 20;115(47):12040-12045.
doi: 10.1073/pnas.1807698115. Epub 2018 Nov 2.

Evolution of drug resistance in an antifungal-naive chronic Candida lusitaniae infection

Affiliations

Evolution of drug resistance in an antifungal-naive chronic Candida lusitaniae infection

Elora G Demers et al. Proc Natl Acad Sci U S A. .

Abstract

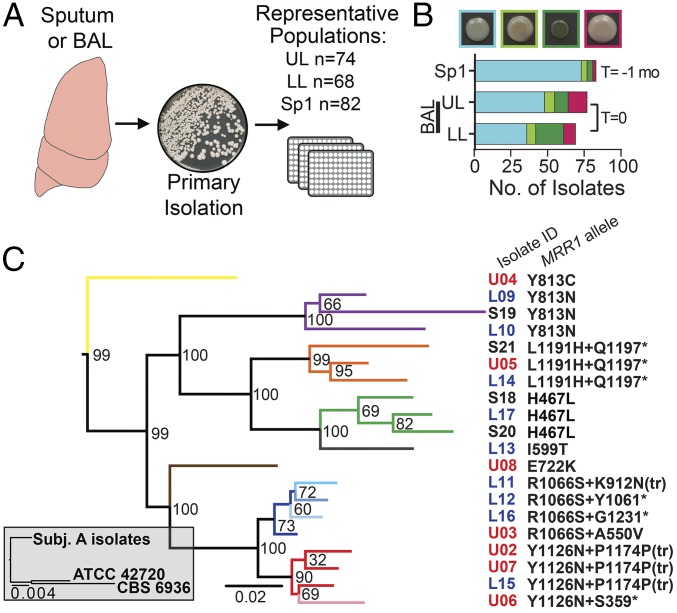
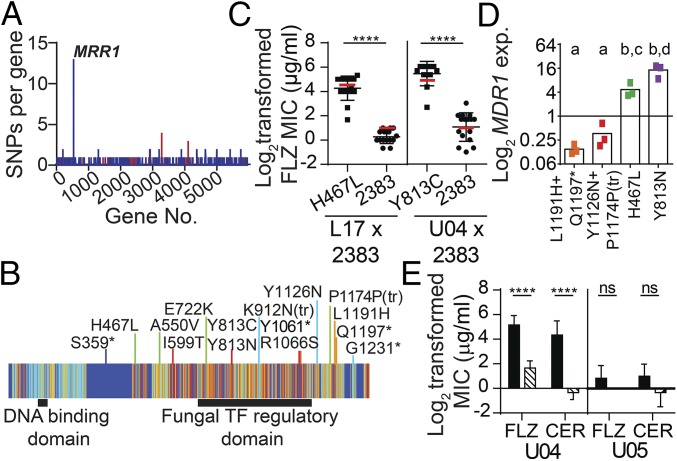
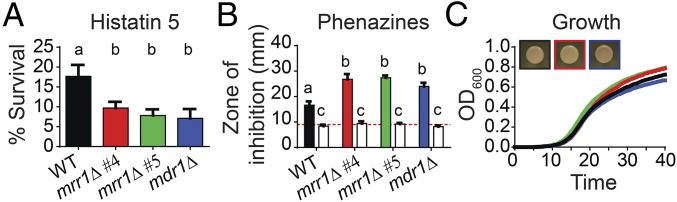
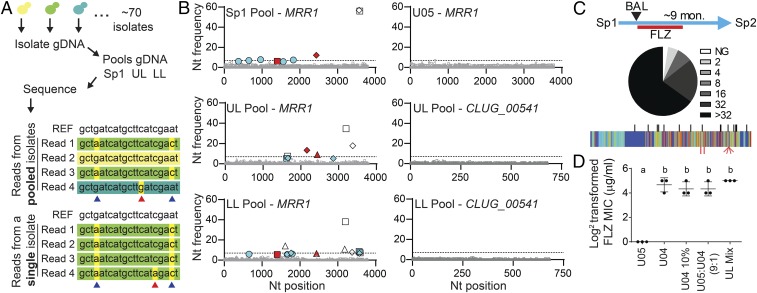
Management of the limited number of antimicrobials currently available requires the identification of infections that contain drug-resistant isolates and the discovery of factors that promote the evolution of drug resistance. Here, we report a single fungal infection in which we have identified numerous subpopulations that differ in their alleles of a single gene that impacts drug resistance. The diversity at this locus was markedly greater than the reported heterogeneity of alleles conferring antibiotic resistance in bacterial infections. Analysis of genomes from hundreds of Clavispora (Candida) lusitaniae isolates, through individual and pooled isolate sequencing, from a single individual with cystic fibrosis revealed at least 25 nonsynonymous mutations in MRR1, which encodes a transcription factor capable of inducing fluconazole (FLZ) resistance in Candida species. Isolates with high-activity Mrr1 variants were resistant to FLZ due to elevated expression of the MDR1-encoded efflux pump. We found that high Mrr1-regulated Mdr1 activity protected against host and bacterial factors, suggesting drug resistance can be selected for indirectly and perhaps explaining the Mrr1 heterogeneity in this individual who had no prior azole exposure. Regional analysis of C. lusitaniae populations from the upper and lower lobes of the right lung suggested intermingling of subpopulations throughout. Our retrospective characterization of sputum and lung populations by pooled sequencing found that alleles that confer FLZ resistance were a minority in each pool, possibly explaining why they were undetected before unsuccessful FLZ therapy. New susceptibility testing regimes may detect problematical drug-resistant subpopulations in heterogeneous single-species infections.

Keywords: Candida; drug resistance; evolution; fungi; heterogeneity.


Conflict of interest statement

The authors declare no conflict of interest.

Figures

Fig. 1.
Fig. 1.
C. lusitaniae coisolates are phenotypically and genomically heterogeneous. (A) Schematic of isolate acquisition from patient samples. Primary BAL fluid or sputum samples were plated. Numerous colonies from each plate were streak-purified and saved to represent the population within each sample. Following species identification by ITS1 sequencing, phenotypic and genomic analyses were performed for the indicated number of isolates per sample. (B) Phenotypic distribution of C. lusitaniae isolate colony color on CHROMagar Candida medium, example of colony colors shown above graph. From left to right, colors include blue/green, brown/green, green, and purple/mauve. The Sp1 (sputum) sample was obtained approximately 1 mo prior (T = −1 mo) to the UL and LL BAL samples (T = 0). (C) Gray inset contains a maximum-likelihood tree for the 20 subject A clinical isolates compared with ATCC 42720 and CBS 6936. The expanded maximum-likelihood tree shows the relationship between subject A isolates based on interisolate SNPs found through WGS, and bootstrap values are shown at every branch point; arms are colored by MRR1 allele. Isolate identifiers are color-coded by sample of origin: Sp1 (black), UL BAL (red), and LL BAL (blue). MRR1 alleles are denoted by the amino acid changes caused by nonsynonymous SNPs and INDELs; asterisk indicates stop codon. Amino acid numbers are based on the MRR1 reannotation in SI Appendix, Fig. S4. One nucleotide INDELs in codons 1174 and 912 cause an amino acid change in the latter case and frame shift mutations that resulted in premature stop codons, noted by “tr” for truncation, at N1176 and L927, respectively.
Fig. 2.
Fig. 2.
Multiple nonsynonymous SNPs in MRR1 increase FLZ resistance via up-regulation of MDR1 expression. (A) Number of nonsynonymous (blue) and synonymous (red) SNPs within each gene. (B) Schematic of Mrr1 depicting the locations of the amino acid changes caused by the 13 nonsynonymous SNPs and two INDELs. Mrr1 is represented by a heat map of sequence conservation, described in SI Appendix, Fig. S4, with increased conservation represented by a gradient from cool (dark blue) to warm (red) colors. The color of the line marking the location of each mutation corresponds to the sequence conservation score of the affected amino acid. (C) Log2-transformed FLZ MICs (micrograms per milliliter) of mating progeny, measured at 48 h, obtained by crossing the FLZS 2383 (MRR12383) strain to FLZR clinical isolate L17 (chxR, MRR1H467L, progeny n = 30) or U04 (chxR, MRR1Y813C, progeny n = 28); isolates are grouped by MRR1 allele. Red lines indicate the mean FLZ MIC for the parental strain for each MRR1 allele. Mean ± SD of three independent measurements are shown, ****P < 0.0001. (D) MDR1 expression (exp) for FLZS [MRR1L1191H+Q1197* and MRR1Y1126N+P1174P(tr)] and FLZR (MRR1H467L and MRR1Y813N) isolates with the same MRR1 allele (n = 3, colored to match phylogenetic tree in Fig. 1C). MDR1 expression was normalized to ACT1 levels. Data represent the average of three independent replicates, a-b and c-d P < 0.01. (E) FLZ and cerulenin (CER) MICs for WT (solid) and the isogenic mdr1Δ derivatives (striped) of the FLZR U04 (MRR1Y813C) and FLZS U05 (MRR1L1191H+Q1197*) isolates measured at 48 h. Mean ± SD for four independent replicates shown, ****P < 0.0001; ns, not significant.
Fig. 3.
Fig. 3.
High Mrr1 activity confers resistance to host and microbial factors. (A and B) The FLZR clinical isolate U04 (WT, MRR1Y813C, black) is more resistant than its isogenic mrr1Δ (red and green) and mdr1Δ (blue) derivatives to Hst 5 and phenazines. (A) Percent survival after a 1-h incubation with 3.75 μM Hst 5. Mean ± SD shown for three independent measurements, a-b P < 0.001. (B) Size of the zone of clearance or inhibition (millimeters) around colonies of P. aeruginosa strain PA14 WT (solid) or Δphz (open) on the indicated C. lusitaniae lawns. Red dotted line indicates the average size of the P. aeruginosa colonies. Mean ± SD for representative data shown, similar trends were observed in three independent replicates, a-b P < 0.0001, a-c and b-c P < 0.0001. (C) Growth curve and colony color on CHROMagar Candida medium of the U04 (WT, MRR1Y813C, black) isolate and its isogenic mrr1Δ (4, red and 5, green) and mdr1Δ (blue) derivatives. Representative data are shown, similar results in three independent replicates.
Fig. 4.
Fig. 4.
Small subpopulations of FLZR isolates can alter the FLZ resistance profile of the population. (A) Schematic for the creation of pooled isolate DNA. Equivalent amounts of DNA were obtained from individual isolates then combined before sequencing. Individual genomes were not uniquely marked. A representation of Illumina reads from pooled and single isolate sequencing is shown in comparison with the reference sequence (REF) from ATCC 42720. Differences in read color represent sequences that originated from different isolates; nucleotides highlighted in yellow differ from the reference. SNPs (blue arrows) are largely invariant (common across >95% of reads) in single-isolate sequence data but present at a lower frequency in pooled sequencing data. We determined the threshold for SNP detection in pools based on the rate of sequencing errors (red arrows) in single-isolate WGS data. (B) Nucleotide frequency of nonreference alleles for MRR1 from pooled (Sp1, UL, and LL) and single isolates (U05) WGS and CLUG_00541 from pooled (UL and LL) WGS. The frequencies of the nonreference nucleotides are plotted at every position (reference set to zero); positions that differ from the reference but are shared among the clinical isolates are not shown due to scale. Nucleotides are represented as follows: A (square), C (triangle), G (circle), and T (diamond). Nucleotide frequencies shown in gray are present at less than 5%, the threshold at which we are unable to distinguish between low-abundance alleles and sequencing error. Open symbols represent previously identified SNPs that correlate with FLZ MIC ≤ 8 μg/mL, red filled symbols represent previously identified SNPs that correlate with a FLZ MIC ≥ 16 μg/mL, and blue filled symbols represent SNPs that were not detected in any of the 20 single-isolate genomes. The dashed line at 7% represents the threshold for novel SNP detection; only blue nucleotides above 7% were counted as novel SNPs, of which there were four. (C) Lowest inhibitory concentration of FLZ for each Sp2 (n = 83) isolate, from no growth, NG, to >32 μg/mL FLZ (Sp1 data shown in SI Appendix, Fig. S5A) and schematic showing sample acquisition timeline including 4 mo of FLZ treatment and 5 mo off antifungals. Novel SNPs in MRR1 identified in Sp2 isolates (red, Bottom) are plotted on the sequence conservation heat map from Fig. 2, with SNPs and INDEL locations identified in Sp1, UL, and LL isolates marked in black (Top) for reference. (D) Log2-transformed FLZ MICs (micrograms per milliliter) measured at 24 h for U05 and U04 alone, U04 alone at 10% the normal starting concentration (U04 10%), a 9:1 mixture of U05:U04, and a mixture of equivalent amounts of all 74 UL isolates. Mean ± SD from three independent replicates is shown, a-b ****P < 0.0001.

References

    1. Bell BG, Schellevis F, Stobberingh E, Goossens H, Pringle M. A systematic review and meta-analysis of the effects of antibiotic consumption on antibiotic resistance. BMC Infect Dis. 2014;14:13. - PMC - PubMed
    1. van Rie A, et al. Reinfection and mixed infection cause changing Mycobacterium tuberculosis drug-resistance patterns. Am J Respir Crit Care Med. 2005;172:636–642. - PMC - PubMed
    1. Desnos-Ollivier M, et al. Mixed infections and in vivo evolution in the human fungal pathogen Cryptococcus neoformans. MBio. 2010;1:e00091-10. - PMC - PubMed
    1. Kao CY, et al. Heteroresistance of Helicobacter pylori from the same patient prior to antibiotic treatment. Infect Genet Evol. 2014;23:196–202. - PubMed
    1. Sun G, et al. Dynamic population changes in Mycobacterium tuberculosis during acquisition and fixation of drug resistance in patients. J Infect Dis. 2012;206:1724–1733. - PMC - PubMed

Publication types