Review
. 2018 Dec 3;150(12):1606-1639.
doi: 10.1085/jgp.201812203. Epub 2018 Nov 2.

Electrical coupling and its channels

Affiliations
Review

Electrical coupling and its channels

Andrew L Harris. J Gen Physiol. .

Abstract

As the physiology of synapses began to be explored in the 1950s, it became clear that electrical communication between neurons could not always be explained by chemical transmission. Instead, careful studies pointed to a direct intercellular pathway of current flow and to the anatomical structure that was (eventually) called the gap junction. The mechanism of intercellular current flow was simple compared with chemical transmission, but the consequences of electrical signaling in excitable tissues were not. With the recognition that channels were a means of passive ion movement across membranes, the character and behavior of gap junction channels came under scrutiny. It became evident that these gated channels mediated intercellular transfer of small molecules as well as atomic ions, thereby mediating chemical, as well as electrical, signaling. Members of the responsible protein family in vertebrates-connexins-were cloned and their channels studied by many of the increasingly biophysical techniques that were being applied to other channels. As described here, much of the evolution of the field, from electrical coupling to channel structure-function, has appeared in the pages of the Journal of General Physiology.


Figures

Figure 1.
Figure 1.
Initial recordings of electrical transmission between coupled cells of the lobster cardiac ganglion. In each panel, polarizing current is applied to the cell whose voltage is shown in the upper trace. The voltage in the cell coupled to it is the lower trace. The upper panels show the effect of depolarizing current, and the lower panels, the effect of hyperpolarizing current. Voltage calibration, 50 mV; time calibration, 25 ms (from Hagiwara et al. [1959]). Fig. 1 is reprinted with permission from the Journal of Neurophysiology.
Figure 2.
Figure 2.
Expression describing the potential in a cell (V2) as a function of the clamp voltage in the cell coupled to it (V1). The relation between V1 and V2 is a function of junctional and nonjunctional membrane properties. See text for definition of parameters (from Hagiwara et al. [1959]). Fig. 2 is reprinted with permission from the Journal of Neurophysiology.
Figure 3.
Figure 3.
An early drawing of junctional structure derived from lanthanum-stained EM material. “A” indicates the intercellular pathway; “B” indicates continuity with lanthanum-filled extracellular space (from Payton et al. [1969a]). Fig. 3 is reprinted with permission from Science.
Figure 4.
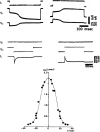
Figure 4.
Early recordings of voltage dependence of junctional conductance of pairs of Ambystoma blastomeres. Upper panels: Application of polarizing current (I1) to one cell (V1) of a coupled pair (V1, V2) causes the cells to uncouple (from Spray et al. [1979]). Middle panels: Voltage clamp of two coupled blastomeres. Voltage of one cell (V1) is kept constant, while the other cell (V2) is stepped to positive or negative voltages. The junctional current (Ij) is recorded as the clamp current applied to cell 1 (from Spray et al. [1981a]). Bottom panel: Plot of the steady-state junctional conductance–voltage relation of a pair of coupled blastomeres. Lines are Boltzmann fits to each polarity of voltage (from Spray et al. [1981a]). Fig. 4 top is reprinted with permission from Science.
Figure 5.
Figure 5.
Early recording of single gap junction channels. (A) Diagram of dual whole-cell patch clamp of chick ventricle cells. (B) Currents recorded by each patch clamp for a junctional voltage of 40 mV. V1 = −40 mV, V2 = −80 mV. Junctional currents are of equal and opposite magnitude in the two clamp current traces; nonjunctional currents are not correlated. Unitary junctional conductances of two sizes are seen (from Veenstra and DeHaan [1986]). Fig. 5 is reprinted with permission from Science.
Figure 6.
Figure 6.
A connexin monomer indicating the domains. Consensus/approximate residue numbers for the indicated domains are NT, 1–20, with the bend roughly around position 12; TM1, 21–41; EL1, 42–71; TM2, 72–97; and CL, 98–129. Red lines indicate disulfide linkages (from Beyer and Berthoud [2017]). Fig. 6 is reprinted with permission from F1000Research.
Figure 7.
Figure 7.
Flexibility of residue side chains lining the connexin pore. Cutaway of Cx26 hemichannel color-coded by per-side-chain RMSF values obtained from umbrella sampling Hamiltonian replica exchange molecular dynamics. Three of the connexin subunits are removed so that the pore can be seen. The cytoplasmic end of the hemichannel is at the top. Most of the residues lining the pore have high RMSF values; in contrast, the ASP46 residue, which corresponds to the peak of the PMF for an impermeant molecule, is relatively rigid (from Luo et al. [2016]). Fig. 7 is reprinted with permission from Biophysical Journal.
Figure 8.
Figure 8.
Schematic depiction of the extracellular domains of a Cx26 hemichannel. The box in the left panel shows the region depicted in detail on the right. The front three connexin subunits are not shown. Each subunit is represented by a different color. Cylinders inside the subunits represent the transmembrane domains. TM1 denotes the first transmembrane domain, which is exposed to the pore lumen. E1 and E2 denote the first and second extracellular loop domains, respectively. The parahelix region mentioned in the text corresponds to residues 43–51, comprising the uppermost residues of TM1 and the contiguous residues with white labels in E1. The illustration is not drawn to scale or strictly according to the atomic structure (from Sanchez et al. [2013]).

References

    1. Akabas M.H., Stauffer D.A., Xu M., and Karlin A.. 1992. Acetylcholine receptor channel structure probed in cysteine-substitution mutants. Science. 258:307–310. 10.1126/science.1384130 - DOI - PubMed
    1. Arvanitaki A. 1942. Effects evoked in an axon by the activity of a contiguous one. J. Neurophysiol. 5:89–108. 10.1152/jn.1942.5.2.89 - DOI
    1. Arvanitaki A., and Chalazonitis N.. 1959. [Electrical interactions between the giant soma A and the immediately contiguous somata (pleuro-branchial ganglion of Aplysia ] Bull. Inst. Oceanogr. (1143):1–30.
    1. Auerbach A.A., and Bennett M.V.L.. 1969. A rectifying electrotonic synapse in the central nervous system of a vertebrate. J. Gen. Physiol. 53:211–237. 10.1085/jgp.53.2.211 - DOI - PMC - PubMed
    1. Baldo G.J., Gong X., Martinez-Wittinghan F.J., Kumar N.M., Gilula N.B., and Mathias R.T.. 2001. Gap junctional coupling in lenses from alpha(8) connexin knockout mice. J. Gen. Physiol. 118:447–456. 10.1085/jgp.118.5.447 - DOI - PMC - PubMed