

Regulator of Calcineurin 1 helps coordinate whole-body metabolism and thermogenesis
- PMID: 30389725
- PMCID: PMC6280800
- DOI: 10.15252/embr.201744706
Regulator of Calcineurin 1 helps coordinate whole-body metabolism and thermogenesis
Abstract
Increasing non-shivering thermogenesis (NST), which expends calories as heat rather than storing them as fat, is championed as an effective way to combat obesity and metabolic disease. Innate mechanisms constraining the capacity for NST present a fundamental limitation to this approach, yet are not well understood. Here, we provide evidence that Regulator of Calcineurin 1 (RCAN1), a feedback inhibitor of the calcium-activated protein phosphatase calcineurin (CN), acts to suppress two distinctly different mechanisms of non-shivering thermogenesis (NST): one involving the activation of UCP1 expression in white adipose tissue, the other mediated by sarcolipin (SLN) in skeletal muscle. UCP1 generates heat at the expense of reducing ATP production, whereas SLN increases ATP consumption to generate heat. Gene expression profiles demonstrate a high correlation between Rcan1 expression and metabolic syndrome. On an evolutionary timescale, in the context of limited food resources, systemic suppression of prolonged NST by RCAN1 might have been beneficial; however, in the face of caloric abundance, RCAN1-mediated suppression of these adaptive avenues of energy expenditure may now contribute to the growing epidemic of obesity.
Keywords: Down syndrome; RCAN1; adaptive thermogenesis; obesity; sarcolipin.
© 2018 The Authors.
Figures
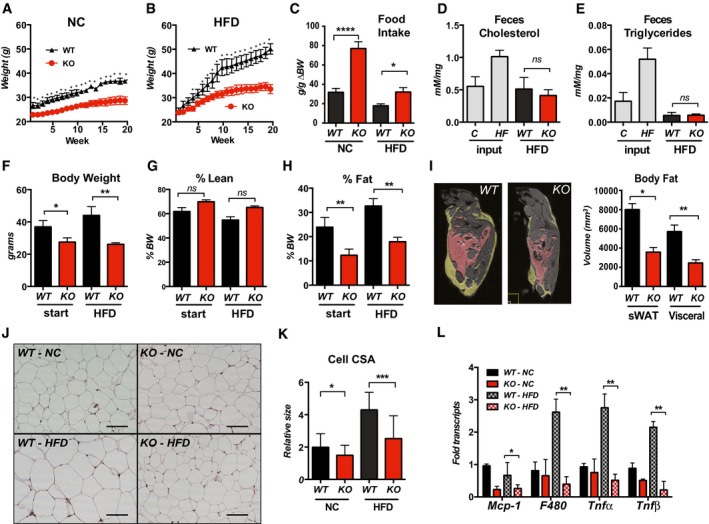
- A, B
Body weights of WT and Rcan1‐KO mice fed normal chow diet (NC) or a high‐fat diet (HFD) for 20 weeks starting at 8–10 weeks of age (male, n = 15 each).
- C
Food consumption per gram of body weight gained (g/g ∆BW) over the first 15 weeks on NC or HFD, starting at 8 weeks of age (male, n = 9 each).
- D, E
Cholesterol and triglyceride remaining in the feces of WT and Rcan1‐KO mice fed a HFD, measured as mMol per mg of feces (males, n = 4 over 3 days). Cholesterol and triglyceride contents of NC and the HFD chow (input) were measured for comparison.
- F–I
MRI measures of total body weight, percentage lean mass, and percent fat mass prior to and after 6 weeks on the HFD (males, n = 5). MRI image of WT and KO males following 8 weeks on a HFD. Yellow delineates visceral WAT. Pink delineates subcutaneous WAT. Quantification graphed on the right.
- J
Representative H&E staining of gWAT from WT and KO males after 25 weeks on NC or HFD. Scale bar = 100 μm.
- K
Quantification of cross‐sectional area (CSA) of adipocytes in (J) (n = 3 animals, three images/each, 75–100 adipocytes). Scale bar = 100 μm.
- L
Transcript levels for inflammatory markers monocyte chemoattractant protein‐1 (Mcp‐1), macrophage antigen F4/80 (F480), tumor necrosis factor‐alpha (Tnfα), and tumor necrosis factor‐beta (Tnfβ) in gWAT of WT and KO after 25 weeks on NC or HFD (males, n = 4–5). Transcript levels were normalized to 18S.
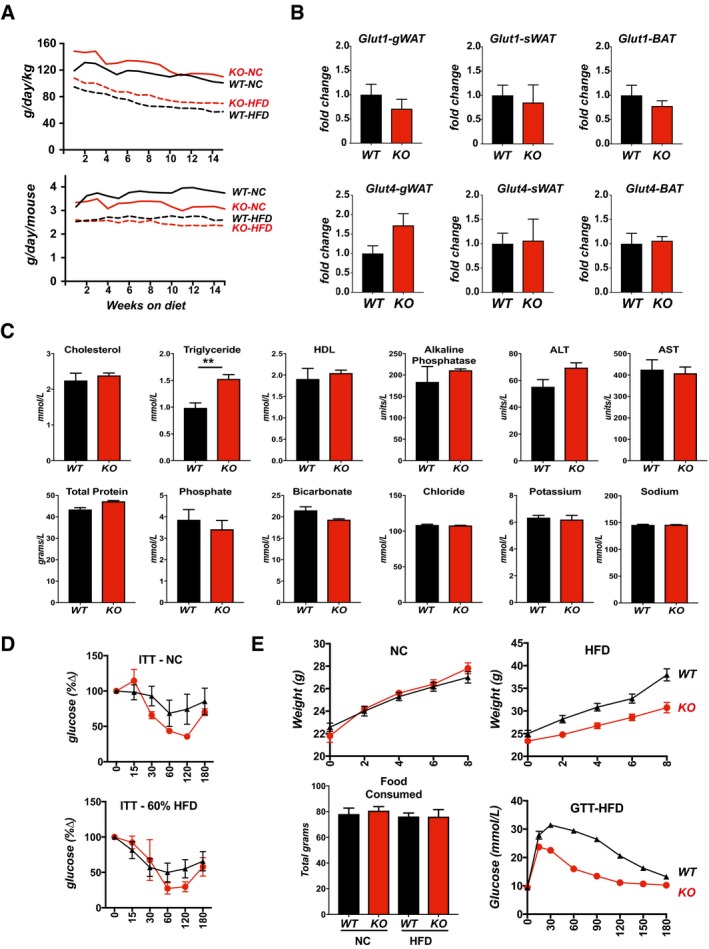
Food consumption of animals in Fig 1C, calculated and tracked weekly over the first 15 weeks on NC or a 60% fat HFD, starting at 8 weeks of age (male, n = 9 each). Data are presented as grams consumed per day per kilogram body weight (g/day/kg) and grams consumed per day per mouse (g/day/mouse).
Transcript levels for Glut1 and Glut4 in gWAT, sWAT, and BAT of WT and KO males after 8 weeks on a 60% fat HFD. Transcript levels were normalized to 18S.
Assessment of standard blood parameters in fasted, 18‐week‐old KO males after 8 weeks on a 60% fat HFD (n = 4 per group).
Insulin tolerance tests (ITT) from Fig 1H, with blood glucose levels plotted as a percentage of starting glucose levels (glucose %∆) after 25 weeks on NC or a 60% fat HFD. GTT was performed following an overnight fast, ITT following a 3‐h fast (males, n = 6).
Body weights of WT and KO mice fed NC or a 60% fat HFD for 8 weeks starting at 3 weeks of age (males, n = 15 each). Total food consumed per animal over the course of 8 weeks. Glucose tolerance test (GTT) was given after 8 weeks on the HFD.
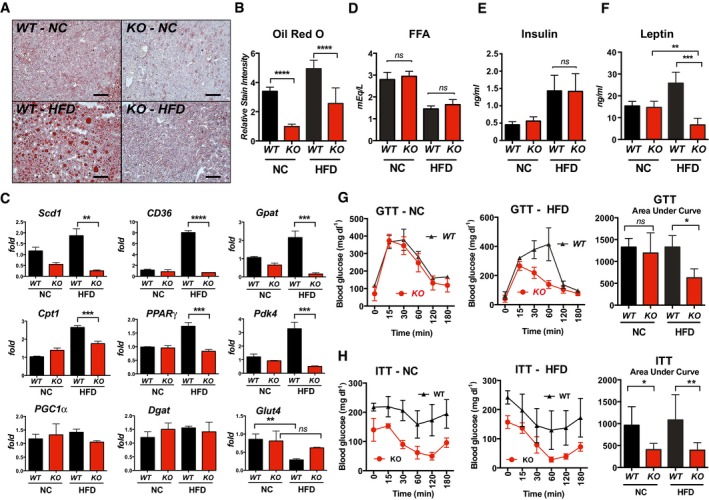
- A, B
Oil Red O staining of livers from WT and KO males after 25 weeks on NC or HFD, with quantification of relative stain intensity (n = 3, three images each). Scale bar = 100 μm.
- C
Transcript levels for genes involved in lipid metabolism and gluconeogenesis in livers of WT and KO mice after 25 weeks on NC or HFD. Stearoyl‐Coenzyme A desaturase (Scd1), fatty acid transporter (CD36), glycerol‐3‐phosphate acyltransferase (Gpat), carnitine palmitoyltransferase I (Cpt1), peroxisome proliferator‐activated gamma (PPARγ), pyruvate dehydrogenase acetyl‐transferase (Pdk4), PPARγ coactivator 1 alpha (PGC1α), diacylglycerol O‐acyltransferase (Dgat), and facilitated glucose transporter (Glut4) (males, n = 4–5). Transcript levels were normalized to 18S.
- D–F
Serum levels of free fatty acids (FAA), insulin, and leptin in WT and KO after 25 weeks on NC or HFD (males, n = 8–10).
- G, H
Glucose tolerance test (GTT) and insulin tolerance test (ITT) after 25 weeks on NC or HFD. GTT was performed following an overnight fast, ITT following a 3‐h fast (males, n = 6).
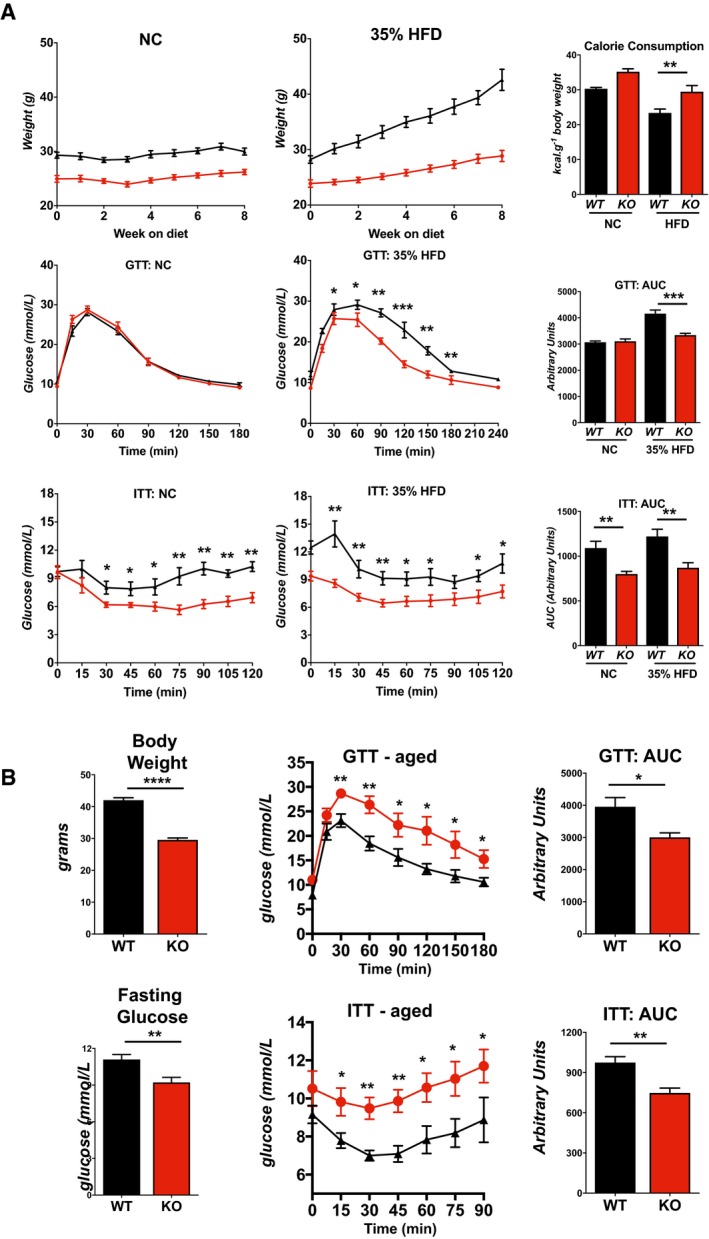
Body weights (n = 8), food consumption (n = 8), glucose tolerance tests (GTT) (n = 5), and insulin tolerance tests (ITT) (n = 5) for WT and KO male mice fed either a normal chow diet (NC) or a 35% fat HFD for 8 weeks starting at 8–10 weeks of age. Food consumption was measured as kilocalories consumed per gram change in body weight (kcal/g body weight) consumption per animal over the course of 8 weeks.
Body weights, fasting blood glucose levels, glucose tolerance test (GTT), and insulin tolerance test (ITT) for 1‐year‐old WT and KO mice maintained on a normal chow diet (males, n = 5).
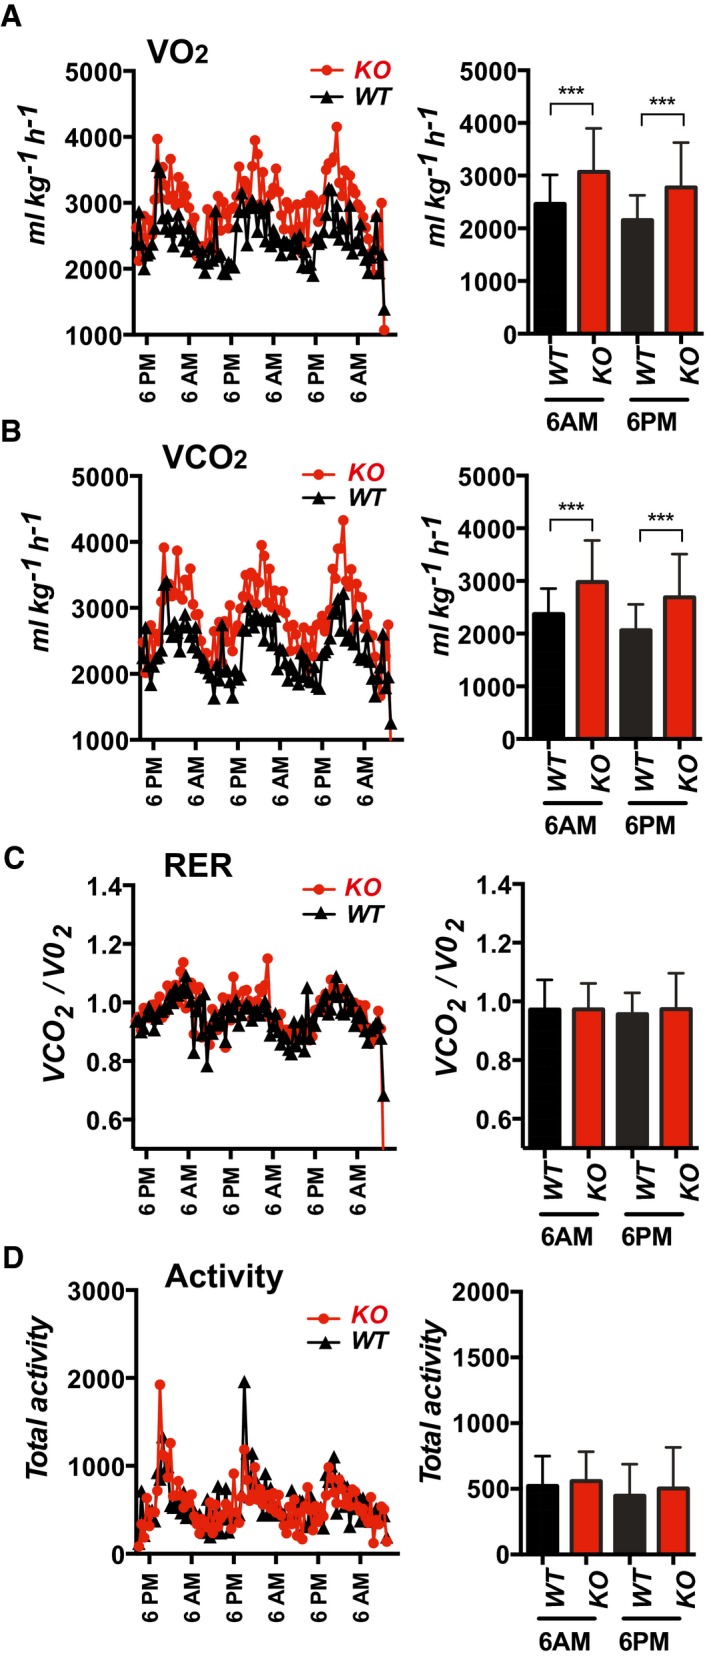
- A–D
Oxygen consumption (VO2), carbon dioxide production (VCO2), respiratory exchange ratio VCO2/VO2 (RER), and physical activity of 10‐ to 12‐week‐old WT and KO mice on normal chow were measured using the CLAM metabolic cage system (males, n = 6). Bar graphs show the average value of metabolic measurements made within the 60 min flanking 6AM or 6PM. Values shown are average ± SD. ***P < 0.001 (two‐way ANOVA with multiple comparisons).
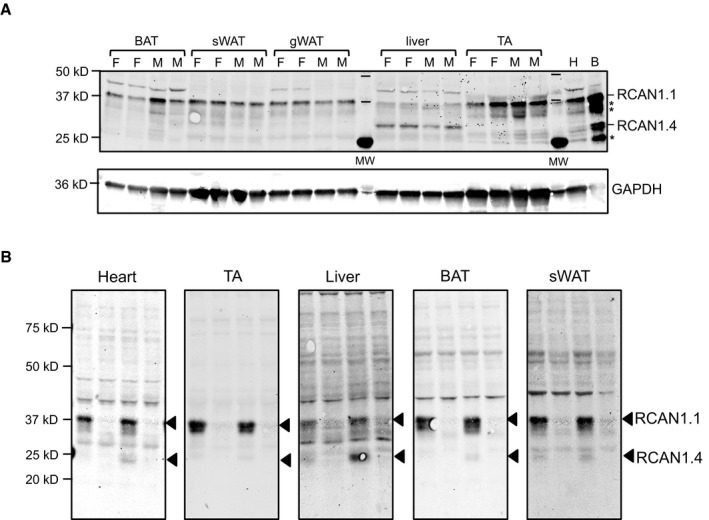
Western blot analysis for RCAN1.4 and RCAN1.1 proteins in extracts from BAT, sWAT, gWAT, liver, and tibialis anterior skeletal muscle (TA) extracted from 12‐week‐old WT, mixed background females (F) and males (M) on normal chow, housed at vivarium temperatures (20 μg per lane). Protein extracts from heart (H, 20 μg) and brain (B, 10 μg) are included for comparison. The locations of potential cleavage products of RCAN1 are marked with an asterisk (*). GAPDH is provided as a loading control within each tissue type.
Western blot to validate specificity of RCAN1 antibody. Protein extracts from heart, TA, liver, BAT, and sWAT were probed with anti‐RCAN1 (20 μg per lane). The first two lanes are from animals housed at room temperature. The second two lanes are from animals housed at 4°C for 4–5 h. Tissues were harvested at 2 PM.
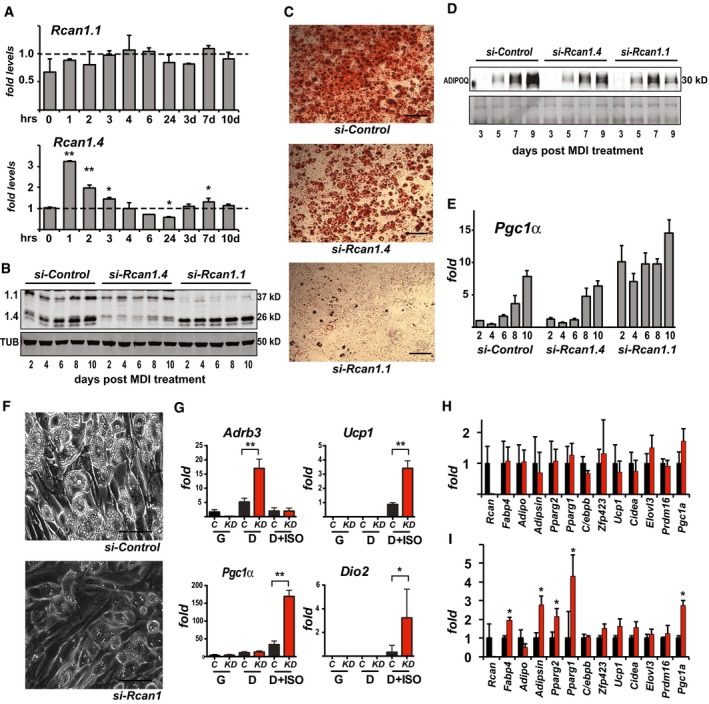
- A
Transcript levels for Rcan1.1 and Rcan1.4 during differentiation of 3T3‐L1 adipocytes, measured at 0, 1, 2, 3, 4, 6, and 24 h following the addition of MDI as well as at 3, 7, and 10 days as indicated (n = 3). *P < 0.05; **P < 0.01 (unpaired Student's t‐test versus 0 time point).
- B
Western blot for RCAN1.1, RCAN1.4, and tubulin (TUB) in whole‐cell extracts of 3T3‐L1 adipocytes transfected with a control siRNA or ones targeting either Rcan1.4 or Rcan1.1 (20 μg per lane).
- C
Representative images of 3T3‐L1 adipocytes transfected with the indicated siRNAs prior to differentiation and stained with Oil Red O on day 10. Scale bar = 100 μm.
- D
Western blot for adiponectin (ADPOQ) released into the media during differentiation by 3T3‐L1 adipocytes transfected with the indicated siRNAs. Ponceau‐stained image provides loading control.
- E
Transcript levels for Pgc1‐α in 3T3‐L1 adipocytes transfected with the indicated siRNAs and assayed over 10 days of differentiation (n = 3).
- F
Representative bright‐field images showing lipid accumulation at 10 days of differentiation of Ing‐svf cells treated with the indicated siRNA. Scale bar = 50 μm.
- G
Transcript levels for Adrenoceptor beta 3 (Adrb3), uncoupling protein 1 (Ucp1), PPARγ coactivator 1 alpha (PGC1α), and deiodinase type II (Dio2) in Ing‐svf cultures transfected with control siRNA (C) or one targeting Rcan1 (KD) then maintained in growth media (G), or differentiated for 10 days (D) with and without the addition of 100 mM isoproterenol for 6 h prior to harvesting (D+ISO) (n = 2 in triplicate). *P < 0.05; **P < 0.01 (two‐way ANOVA with multiple comparisons).
- H, I
Transcript levels for the indicated panel of genes relevant to adipocyte differentiation in platelet‐derived growth factor receptor alpha‐positive (PDGFRα+) and lineage‐negative (Lin−) stromal vascular cells isolated by FACS analysis sorting from sWAT of WT (black bars) and KO (red bars). In (H), isolated cells were maintained in growth media. In (I), cultures were treated with MDI then differentiated for 10 days. *P < 0.05; **P < 0.01 (unpaired Student's t‐test, WT versus KO time point) (n = 3).
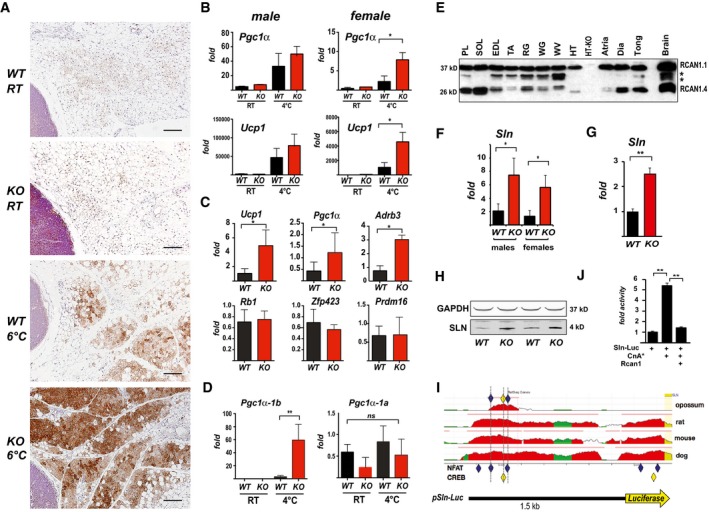
Representative H&E histological sections of sWAT from WT and KO mice probed with anti‐UCP1 antibodies. Mice were either maintained at 24°C (RT) or housed at 6°C for 5 days. Scale bar = 200 μm.
Transcript levels of Pgc1α and Ucp1 in sWAT of male and female WT and KO mice after 24 h at RT or 4°C (n = 5).
Transcript levels of Ucp1, Pgc1α, Adrb3, retinoblastoma 1 (Rb1), zinc finger protein 423 (Zfp423), and PR domain containing 16 (Prdm16) were quantified in sWAT of WT and KO mice after 25 weeks on a HFD (n = 4–5).
Transcript levels of Pgc1α‐1b and Pgc1α‐1a isoforms in sWAT of WT and KO 8‐week‐old females maintained at 24°C (RT) or housed at 4°C for 24 h (n = 5).
Western blot for RCAN1 in various skeletal muscle groups. Each lane was loaded with 20 μg of total protein from plantaris (PL), soleus (SOL), extensor digitorum longus (EDL), tibialis anterior (TA), red gastrocnemius (RG), white gastrocnemius (WG), white vastus lateralis (WV), heart ventricle (HT), atria, diaphragm (Dia), and tongue (Tong). The lane containing brain extract was loaded with 10 μg of protein. Antibody specificity was validated by running 20 μg of protein from the heart of an Rcan1‐KO animal (HT‐KO). The asterisks * indicate the location of putative proteolytic fragments of RCAN1.1.
Transcript levels of Sln in skeletal muscle (tibialis anterior) of 8‐ to 10‐week‐old WT and KO mice housed at RT (n = 4–5 each gender).
Transcript levels of Sln in skeletal muscle (tibialis anterior) of 8‐ to 10‐week‐old male WT and KO animals housed at RT (n = 5).
Representative Western blot showing SLN protein in soleus muscle of 8‐ to 10‐week‐old WT and KO animals housed at RT. GAPDH was used as a loading control.
Alignment of the genomic region 1.5‐Kb upstream of the mammalian Sln gene using the ECR Browser (
http://ecrbrowser.dcode.org/ ). Human was used as the reference genome. The location of conserved NFAT binding sites is indicated by blue diamonds and CREB sites by yellow. Sites were conserved across all mammalian species available in the database except opossum. Mouse, rat, and dog are provided as representative examples. The structure of the Sln‐Luc reporter construct is aligned below.Activity of the Sln‐Luc reporter in C2C12 myoblasts transiently transfected with an empty control vector or ones expressing constitutively active calcineurin (CnA*) and Rcan1. Luciferase activity was normalized to beta‐galactosidase activity from a co‐transfected vector (n = 3, assayed in duplicate).
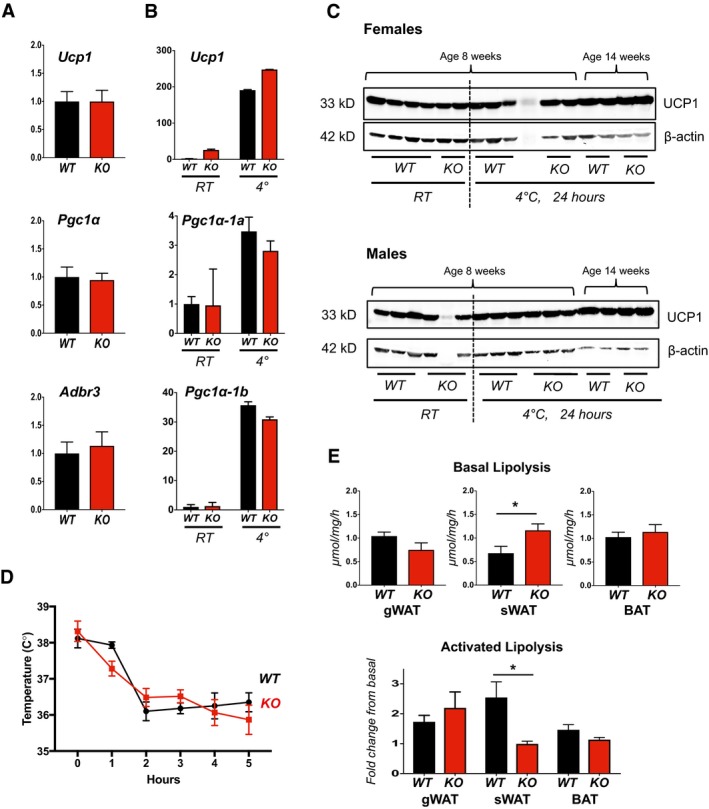
Transcript levels for Ucp1, Pgc1α, and Adr‐b3 in BAT from 18‐week‐old male WT and KO animals on normal chow, housed at normal vivarium temperatures (n = 5).
Transcript levels for Ucp1, Pgc1α‐1a, and Pgc1α‐1b in BAT of WT and KO mice following cold exposure. 10‐ to 12‐week‐old WT and Rcan1 KO females were housed at 24°C (RT) or shifted to 4°C for 24 h. Tissues were harvested between 10 and 12 AM (n = 5).
Western blot analysis for UCP1 and β‐actin in protein extracts of WT and KO BAT from animals housed at 24°C (RT) or shifted to 4°C for 24 h. The upper panel contains protein extracted from females. The lower panel is from males (20 μg protein per lane).
Change in body temperature following shift of WT and KO mice to 4°C measured using a rodent rectal temperature probe (World Precision Instruments) (females, n = 3, ± SD).
Upper panel shows basal rates of lipolysis measured in gWAT, sWAT, and BAT tissue explants from WT and KO animals. Fold change in lipolysis following adrenergic stimulation is compared in the lower panel (males, n = 5, ± SEM). *P < 0.05 (t‐tests in E, upper panel; two‐way ANOVA with multiple comparisons in E, lower panel).
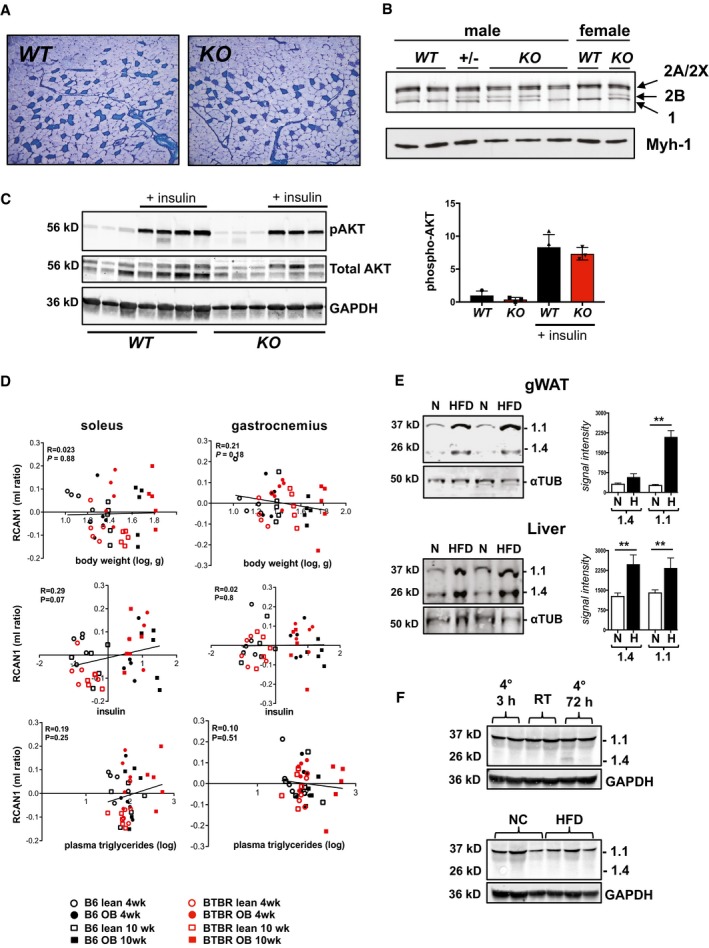
Representative image showing metachromatic fiber‐type stain of the gastrocnemius muscle proximal to the plantaris muscle in 12‐week‐old, male WT and KO animals.
Silver stain of high‐resolution myosin heavy stain SDS–PAGE gels of soleus muscle. Location of oxidative type 1 (1), oxidative type 2A (2A/2X) and glycolytic 2B (2B) myosin heavy chain proteins are indicated by arrows. Lower panel provides a Western blot of the same extracts probed for oxidative, type 1 myosin heavy chain (Myh‐1).
Western blot analysis for phosphorylated AKT, total AKT, and GAPDH in extracts from gastrocnemius skeletal muscle of 10‐week‐old female WT and KO animals house at RT on NC. Insulin was injected 10 min prior to harvesting tissue. Graph at right provides quantification of Akt phosphorylation (n = 3–4, ± SEM).
Correlation of Rcan1 expression in soleus and gastrocnemius skeletal muscle with body weight, plasma insulin, and plasma triglycerides, in a data set comparing backgrounds susceptible (BTBR background) or resistant (C57BL/6 background) to diabetes when carrying the leptin ob/ob (ob) mutation. Measures are reported as the ratio of the mean log10 intensity (ml ratio). Regression line (black), r = linear regression, P = P‐value.
Western blot analysis for RCAN1 and α‐tubulin (αTUB) proteins in gWAT (n = 6) and liver (n = 3) of WT, males on normal chow (N) or high‐fat diet (H) for 8 weeks starting at 10 weeks of age. **P < 0.01 (two‐way ANOVA with multiple comparisons).
Western blot analysis for RCAN1 and GAPDH proteins in gastrocnemius skeletal muscle of 3‐month‐old, WT, mixed background, males maintained at vivarium temperatures (RT) or housed at 4°C for either 3 or 72 h as indicated. The lower blot shows extracts of gastrocnemius from WT C57BL/6 males fed normal chow (NC) or high‐fat diet (HFD) for 15 weeks, starting at 10 weeks of age (20 μg protein per lane).
- A
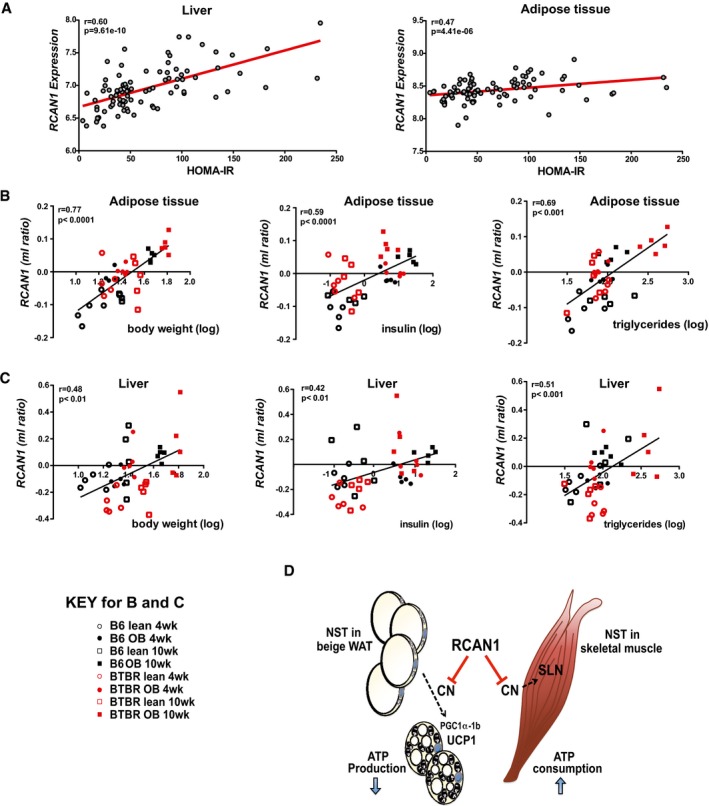
Correlation of Rcan1 expression in liver and gonadal adipose tissue with HOMA‐IR, using male mice from over 100 strains from the hybrid mouse diversity panel. Regression line (red), r = biweight midcorrelation, P = P‐value.
- B, C
Correlation of Rcan1 expression in gonadal adipose tissue and liver with body weight, plasma insulin, and plasma triglycerides, in a data set comparing backgrounds susceptible (BTBR background) or resistant (C57BL/6 background) to diabetes when carrying the leptin ob/ob (ob) mutation. Measures are reported as the ratio of the mean log10 intensity (ml ratio). Regression line (black), r = linear regression, P = P‐value.
- D
Model for RCAN1 suppressive control over two prominent mechanisms of mammalian non‐shivering thermogenesis (NST): one in white adipose tissue, where uncoupling of the mitochondrial membrane potential by UCP1 increases heat generation at the expense of ATP production; the other in skeletal muscle, where SLN increases ATP consumption by SERCA. In adipose tissue, RCAN1 suppresses the conversion of white adipocytes to UCP1‐positive, beige adipocytes by acting as a brake on calcineurin (CN)‐dependent activation of Pgc1α‐1b expression, thereby blunting downstream activation of Ucp1 expression. In skeletal muscle, RCAN1 suppresses CN‐dependent expression of Sln directly. Loss of these repressive functions underlies the elevated metabolic rate and lean phenotype of the Rcan1‐KO animals.
References
Publication types
MeSH terms
Substances
Grants and funding
LinkOut - more resources
Full Text Sources
Molecular Biology Databases
