. 2018 Dec 10;8(12):3783-3790.
doi: 10.1534/g3.118.200194.

Mean-Variance QTL Mapping Identifies Novel QTL for Circadian Activity and Exploratory Behavior in Mice

Affiliations

Mean-Variance QTL Mapping Identifies Novel QTL for Circadian Activity and Exploratory Behavior in Mice

Robert W Corty et al. G3 (Bethesda). .

Abstract

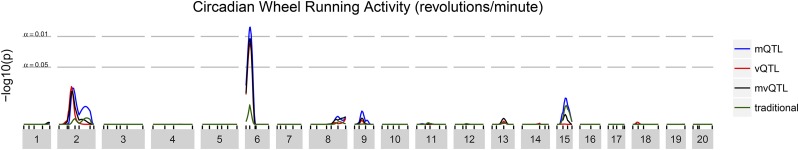
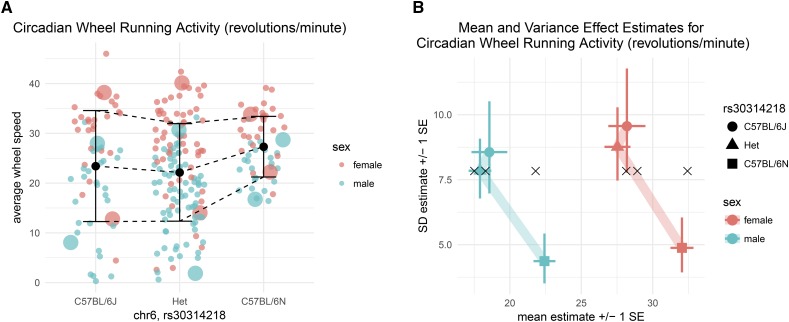
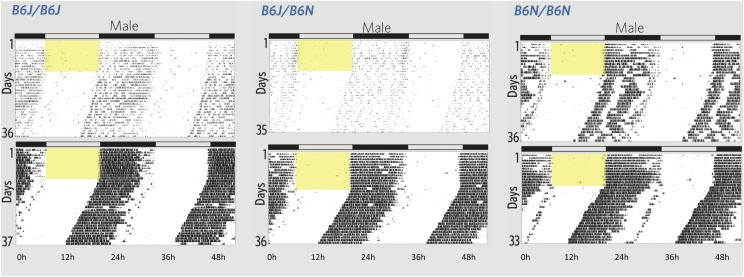
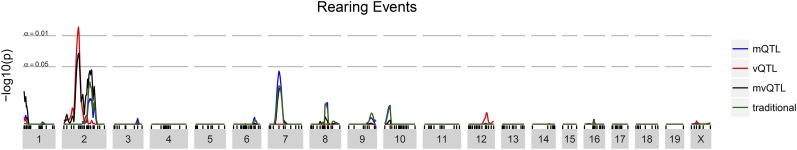
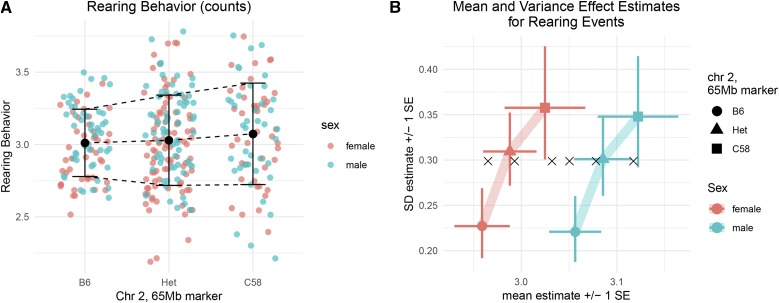
We illustrate, through two case studies, that "mean-variance QTL mapping"-QTL mapping that models effects on the mean and the variance simultaneously-can discover QTL that traditional interval mapping cannot. Mean-variance QTL mapping is based on the double generalized linear model, which extends the standard linear model used in interval mapping by incorporating not only a set of genetic and covariate effects for mean but also set of such effects for the residual variance. Its potential for use in QTL mapping has been described previously, but it remains underutilized, with certain key advantages undemonstrated until now. In the first case study, a reduced complexity intercross of C57BL/6J and C57BL/6N mice examining circadian behavior, our reanalysis detected a mean-controlling QTL for circadian wheel running activity that interval mapping did not; mean-variance QTL mapping was more powerful than interval mapping at the QTL because it accounted for the fact that mice homozygous for the C57BL/6N allele had less residual variance than other mice. In the second case study, an intercross between C57BL/6J and C58/J mice examining anxiety-like behaviors, our reanalysis detected a variance-controlling QTL for rearing behavior; interval mapping did not identify this QTL because it does not target variance QTL. We believe that the results of these reanalyses, which in other respects largely replicated the original findings, support the use of mean-variance QTL mapping as standard practice.

Keywords: DGLM; mQTL; mvQTL; vQTL; variance heterogeneirty.


Figures

Figure 1
Figure 1
Genome scan for Kumar et al. circadian wheel running activity. The horizontal axis shows chromosomal location and the vertical axis shows FWER-controlling p-values for the association between each genomic locus and circadian wheel running activity. Line colors indicate the test type, with traditional (green) representing the traditional SLM-based QTL association, and the mQTL (blue), vQTL (red) and mvQTL (black) tests calculated using (the DGLM-based) mean-variance QTL mapping.
Figure 2
Figure 2
(a) Average wheel speed (revolutions/minute) of all mice. It is visually apparent that female mice had higher circadian wheel running activity than male mice and that mice that homozygous for C57BL/6N had higher circadian wheel running activity and less intra-genotype variation. Large dots indicate the mice whose activity is shown in actogram form (males in Figure 3; all in Figure S2). (b) Predicted mean and variance of mice according to sex and allele at the QTL. What was visually apparent in (a) is captured by the DGLM. The estimated parameters relating to mice that are homozygous for the C57BL/6N allele imply a higher expected value and a lower residual variance than the other two genotype groups. Black x’s indicate the estimates from the SLM, very similar to the DGLM estimates in the horizontal (mean) axis, but homogeneous in the vertical (variance) axis.
Figure 3
Figure 3
Double-plotted actograms illustrate the variation in wheel running activity of male mice based on their genotype at rs30314218. On reading a single actogram: An actogram illustrates the activity of a single mouse over the course of an experiment. Each day of the experiment is represented by a histogram, with bin width of six minutes. Histograms are stacked vertically. Additionally, each day is shown twice (repeated horizontally) so that there is no time of day that is illegible due to the plot edges. Yellow box indicates when lights were on. On reading this six-actogram plot: Recall that the DGLM estimates a unique mean and standard deviation (SD) for each genotype. The mice whose actograms are shown here had an activity level that is one genotype-specific SD greater than (top) or less than (bottom) the genotype-specific mean. The difference between the two is much less in the C57BL/6N homozygotes than in the other genotypes, reflecting the decreased phenotype variance among C57BL/6N homozygotes. The animals shown in this figure are marked with large blue circles in Figure 2a. A larger figure that also includes female mice as well as the ID’s of all plotted mice are in the supplement (Figure S2 and Table 2).
Figure 4
Figure 4
Genome scan for Bailey et al. rearing behavior. The x axis shows chromosomal location and the y axis shows FWER-controlling p-values for the association between each genomic locus and the Box-Cox transformed rearing behavior.
Figure 5
Figure 5
(a) “Total Rearing Events”, transformed by the Box-Cox procedure, stratified by sex and genotype at the top marker. (b) Predicted mean and variance of mice according to sex and allele at the top marker.

References

    1. Ayroles J. F., Buchanan S. M., O’Leary C., Skutt-Kakaria K., Grenier J. K., et al. , 2015. Behavioral idiosyncrasy reveals genetic control of phenotypic variability. Proc. Natl. Acad. Sci. USA 112: 6706–6711. 10.1073/pnas.1503830112 - DOI - PMC - PubMed
    1. Bailey J. S., Grabowski-Boase L., Steffy B. M., Wiltshire T., Churchill G. A., et al. , 2008. Identification of quantitative trait loci for locomotor activation and anxiety using closely related inbred strains. Genes Brain Behav. 7: 761–769. 10.1111/j.1601-183X.2008.00415.x - DOI - PMC - PubMed
    1. Banks G., Heise I., Starbuck B., Osborne T., Wisby L., et al. , 2015. Genetic background influences age-related decline in visual and nonvisual retinal responses, circadian rhythms, and sleep. Neurobiol. Aging 36: 380–393. 10.1016/j.neurobiolaging.2014.07.040 - DOI - PMC - PubMed
    1. Bogue M. A., Grubb S. C., Walton D. O., Philip V. M., Kolishovski G., et al. , 2017. Mouse phenome database: an integrative database and analysis suite for curated empirical phenotype data from laboratory mice. Nucleic Acids Res. 46: D843–D850. 10.1093/nar/gkx1082 - DOI - PMC - PubMed
    1. Broman K. W., Sen S., 2009. A Guide to QTL Mapping with R/qtl, Springer, New York: 10.1007/978-0-387-92125-9 - DOI

Publication types

LinkOut - more resources