. 2018 Nov 2;9(11):1116.
doi: 10.1038/s41419-018-1155-z.

Phosphatidylserine is a marker for axonal debris engulfment but its exposure can be decoupled from degeneration

Affiliations

Phosphatidylserine is a marker for axonal debris engulfment but its exposure can be decoupled from degeneration

Vered Shacham-Silverberg et al. Cell Death Dis. .

Abstract

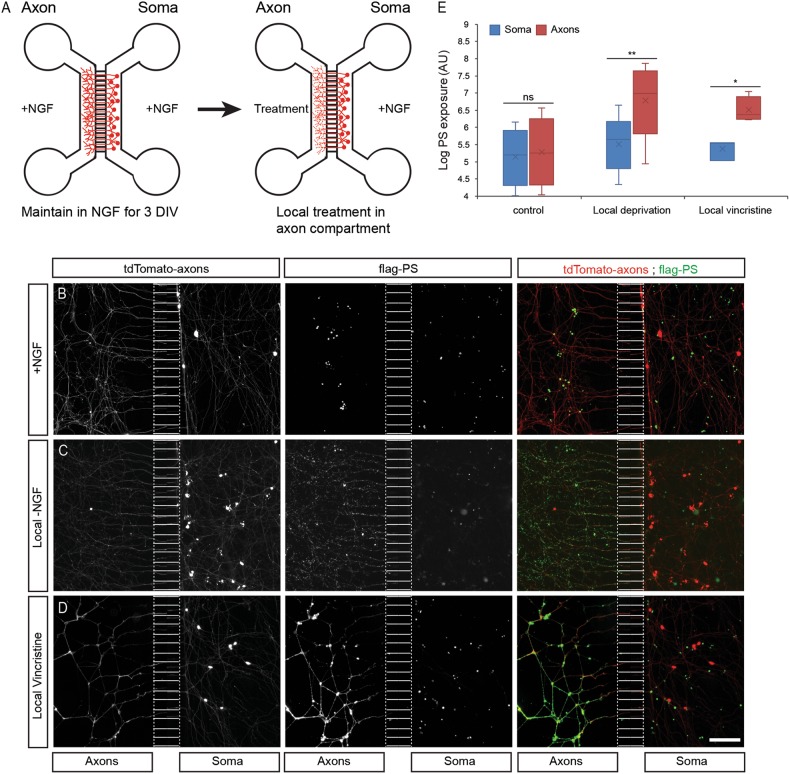
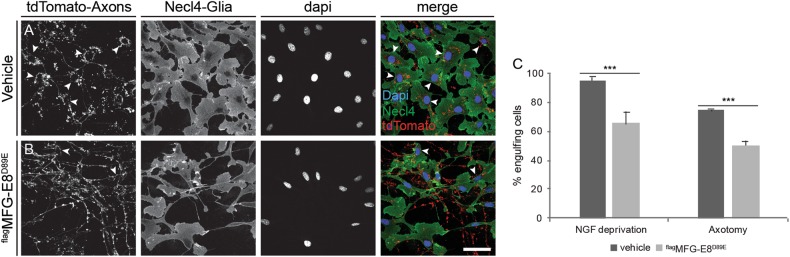
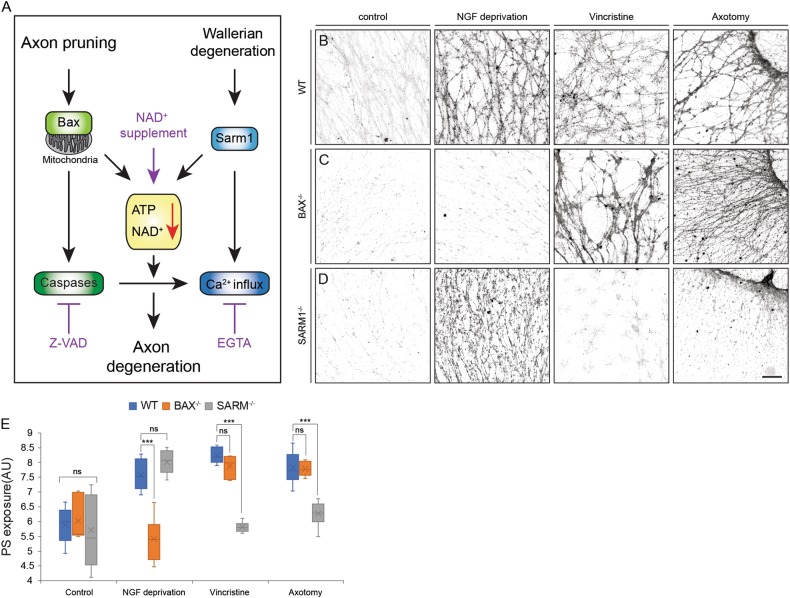
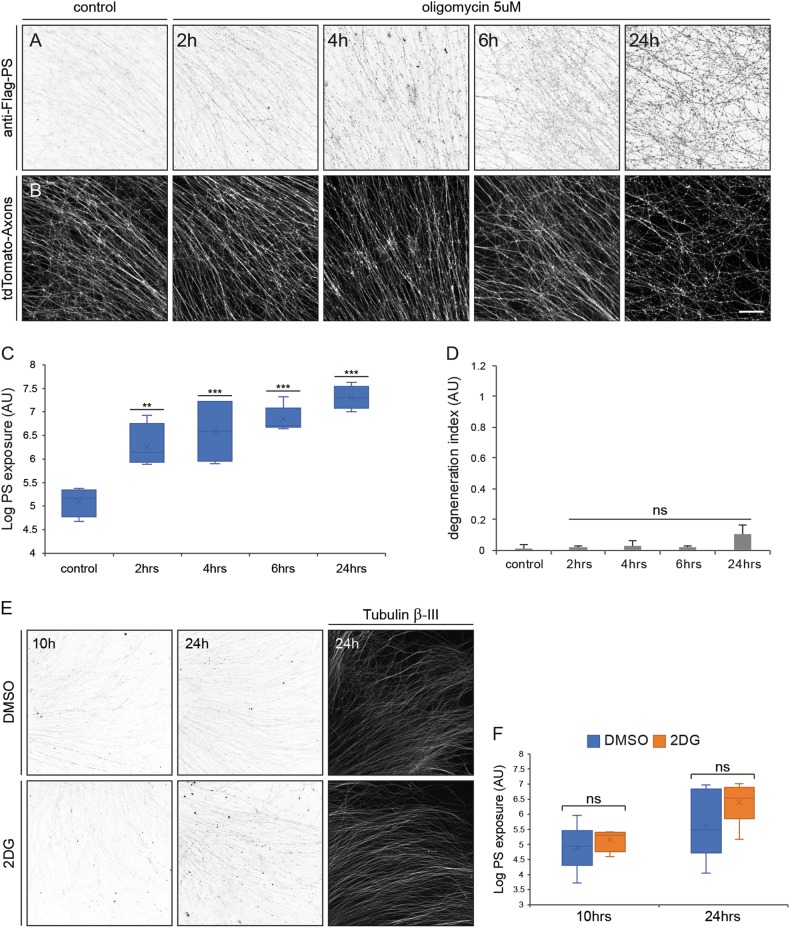
Apoptotic cells expose Phosphatidylserine (PS), that serves as an "eat me" signal for engulfing cells. Previous studies have shown that PS also marks degenerating axonsduring developmental pruning or in response to insults (Wallerian degeneration), but the pathways that control PS exposure on degenerating axons are largely unknown. Here, we used a series of in vitro assays to systematically explore the regulation of PS exposure during axonal degeneration. Our results show that PS exposure is regulated by the upstream activators of axonal pruning and Wallerian degeneration. However, our investigation of signaling further downstream revealed divergence between axon degeneration and PS exposure. Importantly, elevation of the axonal energetic status hindered PS exposure, while inhibition of mitochondrial activity caused PS exposure, without degeneration. Overall, our results suggest that the levels of PS on the outer axonal membrane can be dissociated from the degeneration process and that the axonal energetic status plays a key role in the regulation of PS exposure.


Conflict of interest statement

The authors declare that they have no conflict of interest.

Figures

Fig. 1
Fig. 1. PS is exposed on sub-axonal segments.
a Schematic representation of microfluidic chambers: axons and cell bodies are in separate compartments, allowing selective treatment of the axonal compartment. Dissociated tdTomato-positive DRG neurons were cultured in microfluidic chambers. After 5 days in vitro (DIV), the axonal compartment was treated, as indicated, for 24 h, with addition of flagMFG-E8D89E. After treatment, cells were briefly fixed, stained with anti-Flag, and PS exposure was measured by anti-Flag staining intensity. b In control untreated cultures, the axons and cell bodies remained intact, and PS was not detected on the outer membrane. c, d Local axonal degeneration induced by NGF deprivation (c) or 40 nM vincristine treatment (d) for 24 h resulted in PS exposure on the treated distal axonal segment but not on the soma/proximal axons. e Quantification of PS exposure levels on the soma and axonal compartment in control and local axon degeneration. Error bars show mean ± SEM, p-value (student t test): *P < 0.05, **p < 0.01. Scale bar: 50 μm, N = 3 chambers per treatment
Fig. 2
Fig. 2. Masking PS signal reduces axonal debris engulfment.
a, b tdTomato-positive DRG neurons were cultured in MFC for 5 days or as explants for 48 h, before being NGF-deprived for 24 h or axotomized for 16 h (Figure show NGF-deprived axons), with (b) or without (a) 10 μg/ml purified flagMFG-E8D89E. White arrowheads marks Necl4/Td tomato double positive cells. c Quantification of percentage of engulfing glia cells. To evaluate engulfment of axonal debris, we counted labeled cells to determine the percentage of Necl4-positive/TdTomato debris-positive glia cells as a fraction of all Necl4-positive cells. Error bars mean ± SEM, p-value (student t test): ***p < 0.001. Scale bar: 50 μm, N = 3 chambers for NGF deprivation, four separate explants for axotomy
Fig. 3
Fig. 3. Early activators of axonal degeneration control PS exposure.
a Schematic representation of the pathways that control axonal degeneration. Key activators of each pathway, as well as other downstream contributors to the pathways are depicted. Pharmacological treatments used in the experiments are marked in purple. b-d DRG explants of WT (b), Bax-/- (c) and Sarm1-/- (d) embryos were cultured for 48 to 96 h in the presence of NGF before axon degeneration was initiated by NGF deprivation, 40 nM vincristine, or axotomy, with addition of flagMFG-E8D89E, for additional 16 h (Axotomy) or 24 h (NGF deprivation and Vincristine). After treatment, cells were briefly fixed, stained with anti-Flag, and PS exposure was measured by anti-Flag staining intensity. WT axons expose PS after all treatments, while Bax null axons expose PS after vincristine and axotomy, but not after NGF deprivation. Sarm1 null axons expose PS after NGF deprivation but not after vincristine or axotomy. e Quantification of PS exposure levels on WT, Bax-/- and Sarm1-/- axons in all treatments. Error bars mean ± SEM, p-value, compare with WT exposure levels (student t test): ***P < 0.001. Scale bar: 50 μm, N = minimum of five separate explants were analyzed per experimental condition
Fig. 4
Fig. 4. Blocking extracellular Ca++ influx does not prevent PS exposure.
a DRG axons were cultured for 48 h in the presence of NGF before treatment with 2 mM EGTA for 24 h, with addition of flagMFG-E8D89E. After treatment, cells were briefly fixed, stained with anti-Flag, and PS exposure was measured by anti-Flag staining intensity. EGTA had no effect on the basal levels of PS exposure. b-g DRG axons were cultured for 48 h and then treated as indicated in the presence of vehicle (upper rows) or 2 mM EGTA (lower rows). b, c EGTA had no effect on the exposure of PS in DRG axons deprived of NGF for 8, 16, or 24 h. d, e EGTA had no effect on the exposure of PS in DRG axons treated with vincristine for 8, 16, or 24 h. f, g EGTA had no effect on the exposure of PS in axotomized DRG axons at 4, 8, or 16 h post-axotomy; however, it completely protected axons from degeneration. c, e, g Error bars indicate mean ± SEM, significance determined by two-way ANOVA, Scale bar: 100 μm, N = minimum of five separate explants were analyzed per experimental condition
Fig. 5
Fig. 5. Inhibiting caspase activity prevents PS exposure only in apoptotic-dependent axon degeneration.
a DRG axons were cultured for 48 h in the presence of NGF before a 24 h treatment with the pan-caspase inhibitor Z-VAD (50 μM) or vehicle (DMSO) with addition of flagMFG-E8D89E. After treatment, cells were briefly fixed, stained with anti-Flag, and PS exposure was measured by anti-Flag staining intensity. Z-VAD had no effect on basal levels of PS exposure. b, c DRG axons were cultured for 48 h and then NGF-deprived for 8, 16, or 24 h with DMSO or 50 μM Z-VAD. PS exposure was significantly reduced after 16 h and 24 h of Z-VAD treatment. d, e DRG axons were cultured for 96 h and then treated with 40 nM vincristine with DMSO or Z-VAD for 8, 16, or 24 h. Z-VAD treatment did not prevent PS exposure on vincristine-treated axons at any time point. f, g DRG axons were cultured for 48 h before axons were axotomized using a sharp needle and cultured with DMSO or Z-VAD for 4, 8, or 16 h. Z-VAD treatment did not prevent PS exposure on axotomized axons at any time point. Error bars indicate mean ± SEM, p-value (two-way ANOVA): ***P < 0.001. Scale bar: 100 μm, N = minimum of five separate explants were analyzed per experimental condition
Fig. 6
Fig. 6. NAD+ supplementation suppresses PS exposure on degenerating axons.
a DRG axons were cultured for 48 h in the presence of NGF before supplementation with 20 mM NAD+ or vehicle control and an additional 24 h of culture, with addition of flagMFG-E8D89E. After treatment, cells were briefly fixed, stained with anti-Flag, and PS exposure was measured by anti-Flag staining intensity. NAD+ had no effect on basal PS exposure levels. b, c DRG axons were cultured for 48 h and then NGF-deprived for 8, 16, or 24 h with vehicle control or 20 mM NAD+ supplement. PS exposure was reduced significantly after 16 h in the NAD+ treated axons, but not at 24 h. d, e DRG axons were cultured for 96 h before treatment with 40 nM vincristine with vehicle or 120 mM NAD+ supplement for 8, 16, or 24 h. PS exposure was reduced significantly after 16 h and 24 h. f, g DRG axons were cultured for 48 h before axons were axotomized using sharp needle, and cultured with vehicle or 20 mM NAD+ supplement for 4, 8, or 16 h. NAD+ supplement prevented PS exposure on axotomized axons in all tested times. h ATP levels with or without NAD+ supplement. DRG explants were cultured on cell inserts for 48 h before treated with NGF deprivation, vincristine or axotomy. After indicated time points, axonal compartment were collected and ATP levels were quantified. All three treatments significantly reduced axonal ATP levels, compare with control. NAD+ supplement prevented ATP reduction and rescued axonal ATP levels back to control levels. i DRG axons were cultured for 48 h and then treated with 10 μM FK866 or DMSO for 5, 10 and 24 h. PS exposure was not affected by FK866 treatment at all time point tested. j Quntification of PS exspoure levels after FK866 or DMSO treatment. Error bars indicate mean ± SEM, p-value (two-way ANOVA): *P < 0.05, **P < 0.01, ***P < 0.001 (In H all p-values are compared to vehicle control). Scale bar: 100 μm, N = minimum of five separate explants were analyzed per experimental condition
Fig. 7
Fig. 7. Inhibition of mitochondrial ATP synthesis leads to PS exposure without axon degeneration.
DRG explants were cultured for 48 h before treatment with 5 μM Oligomycin for 2, 4, 6, or 24 h, with addition of flagMFG-E8D89E. After treatment, cells were briefly fixed, stained with anti-Flag, and PS exposure was measured by anti-Flag staining intensity. PS exposure increased twofold after 2 h of treatment and increased to up to 10-fold at 24 h (a, c). Oligomycin-treated axons remained mostly intact, even after 24 h of treatment (b, d). e DRG explants were cultured for 48 h before treated with 10 mM 2DG or DMSO for 10 and  24h. 2DG treatment did not induce axonal degeneration. Twenty-four hours treatment resulted in a mild, yet not significant increase in PS exposure levels. f Quantification of PS exposure levels after 2DG and DMSO treatment. Error bars mean ± SEM, p-value (two-way ANOVA): **p < 0.01, ***P < 0.001. Scale bar: 100 μm, N = minimum of five separate explants were analyzed per experimental condition

References

    1. Luo L, O’Leary DDM. Axon retraction and degeneration in development and disease. Annu. Rev. Neurosci. 2005;28:127–156. doi: 10.1146/annurev.neuro.28.061604.135632. - DOI - PubMed
    1. Yaron A, Schuldiner O. Common and divergent mechanisms in developmental neuronal remodeling and dying back neurodegeneration. Curr. Biol. 2016;26:R628–R639. doi: 10.1016/j.cub.2016.05.025. - DOI - PMC - PubMed
    1. Neukomm LJ, Freeman MR. Diverse cellular and molecular modes of axon degeneration. Trends Cell Biol. 2014;24:515–523. doi: 10.1016/j.tcb.2014.04.003. - DOI - PMC - PubMed
    1. Oppenheim R. Cell death during development of the nervous system. Annu. Rev. Neurosci. 1991;14:453–501. doi: 10.1146/annurev.ne.14.030191.002321. - DOI - PubMed
    1. Elliott MR, Ravichandran KS. Clearance of apoptotic cells: implications in health and disease. J. Cell. Biol. 2010;189:1059–1070. doi: 10.1083/jcb.201004096. - DOI - PMC - PubMed

Publication types

MeSH terms

LinkOut - more resources