. 2018 Nov 2;9(1):4580.
doi: 10.1038/s41467-018-06983-8.

Genome sequences of two diploid wild relatives of cultivated sweetpotato reveal targets for genetic improvement

Affiliations

Genome sequences of two diploid wild relatives of cultivated sweetpotato reveal targets for genetic improvement

Shan Wu et al. Nat Commun. .

Abstract

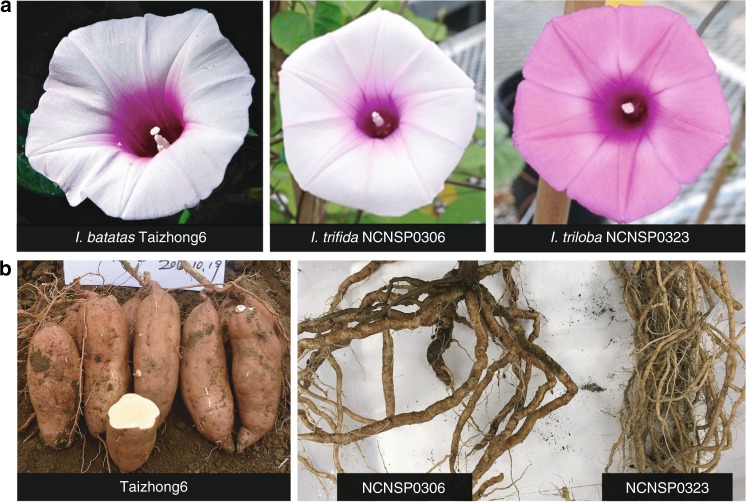
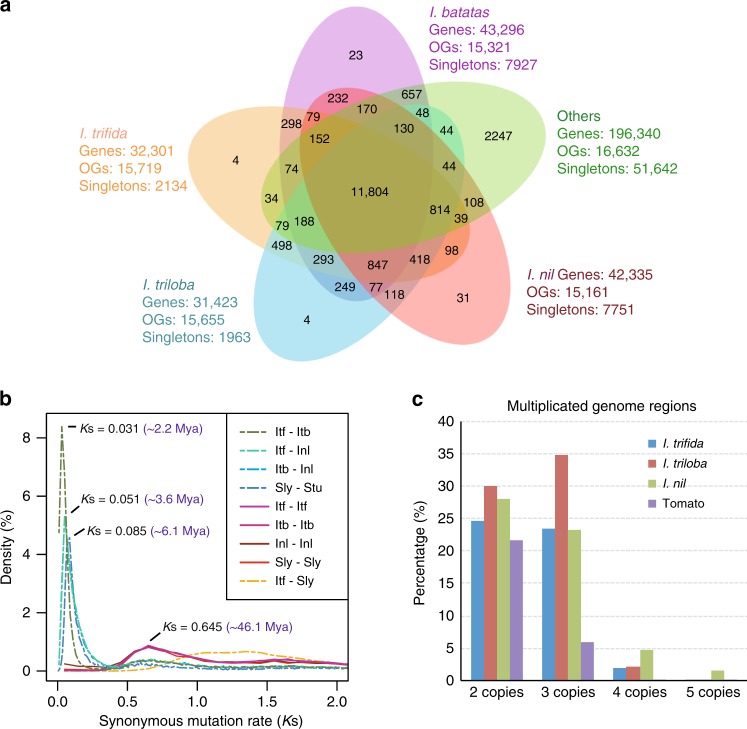
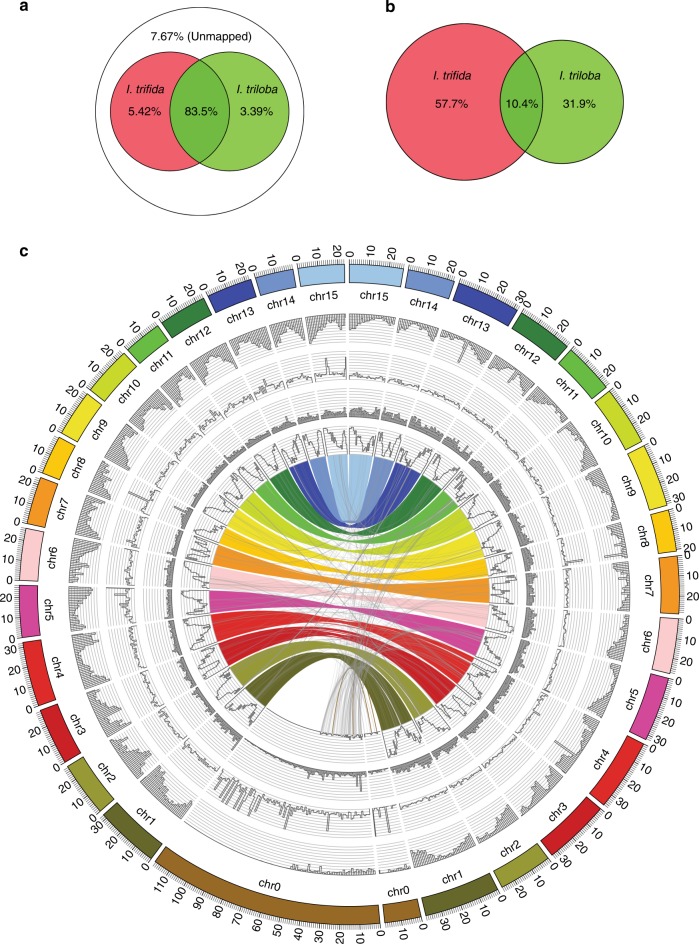
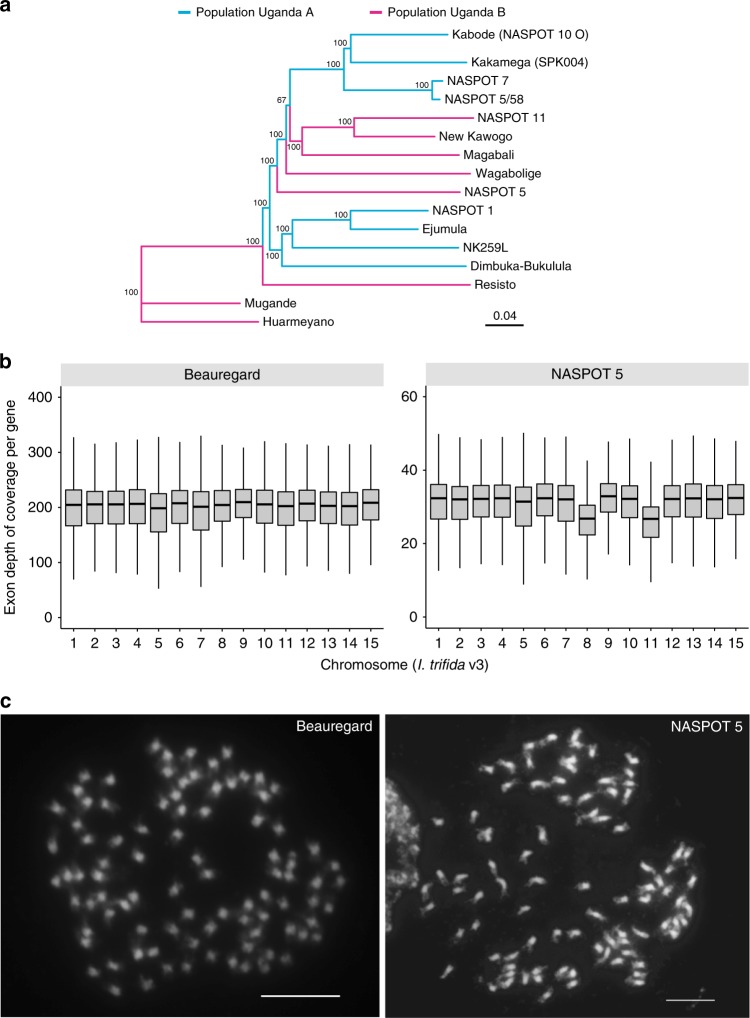
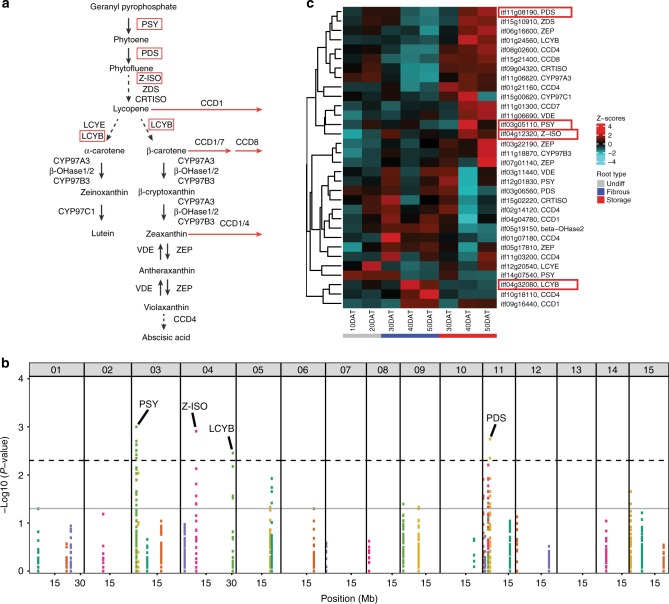
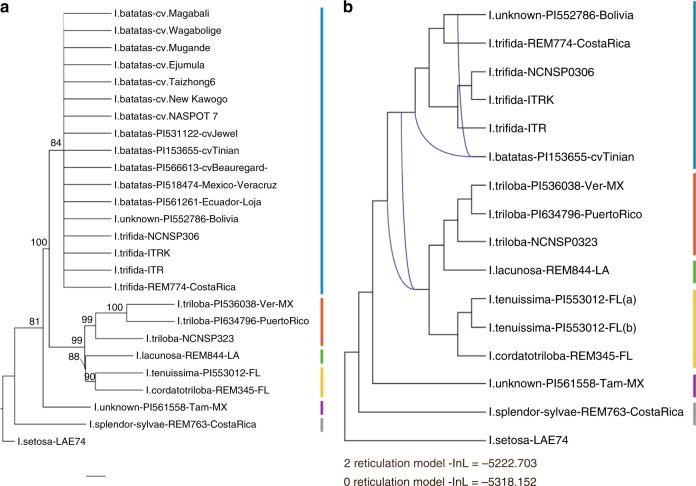
Sweetpotato [Ipomoea batatas (L.) Lam.] is a globally important staple food crop, especially for sub-Saharan Africa. Agronomic improvement of sweetpotato has lagged behind other major food crops due to a lack of genomic and genetic resources and inherent challenges in breeding a heterozygous, clonally propagated polyploid. Here, we report the genome sequences of its two diploid relatives, I. trifida and I. triloba, and show that these high-quality genome assemblies are robust references for hexaploid sweetpotato. Comparative and phylogenetic analyses reveal insights into the ancient whole-genome triplication history of Ipomoea and evolutionary relationships within the Batatas complex. Using resequencing data from 16 genotypes widely used in African breeding programs, genes and alleles associated with carotenoid biosynthesis in storage roots are identified, which may enable efficient breeding of varieties with high provitamin A content. These resources will facilitate genome-enabled breeding in this important food security crop.


Conflict of interest statement

The authors declare no competing interests.

Figures

Fig. 1
Fig. 1
Morphology of Ipomoea batatas, I. trifida, and I. triloba. a, b Flowers (a) and roots (b) of I. batatas “Taizhong6”, I. trifida NCNSP0306, and I. triloba NCNSP0323
Fig. 2
Fig. 2
Gene family clustering and Ipomoea whole-genome triplication. a Venn diagram of orthologous gene families. OGs, orthologous groups. ‘Others’ include tomato, potato, grapevine, Arabidopsis thaliana, rice and Amborella trichopoda. b Distribution of Ks of orthologous or paralogous genes within and between genomes of I. trifida (Itf), I. triloba (Itb), I. nil (Inl), tomato (Sly) and potato (Stu). Estimated times of speciation and WGT events were calculated using a mutation rate of 7 × 10−9 substitutions per site per year. Mya, million years ago. c Multiplicated genomic regions in I. trifida, I. triloba, I. nil, and tomato
Fig. 3
Fig. 3
Comparative genomic analysis of hexaploid sweetpotato and two wild relatives. a Percentages of the mapped and unmapped 10× Genomics linked reads of hexaploid sweetpotato cultivar “Tanzania” to the I. trifida and I. triloba genome assemblies. b Percentages of 10× Genomics reads with better alignments when mapped to one genome assembly compared to the other. c Comparison of the hexaploid sweetpotato molecules with the two diploid assemblies. The outermost circle displays ideograms of the pseudochromosomes of the genome assemblies (in Mb scales). The I. trifida genome is on the left and the I. triloba genome is on the right. The second circle displays the normalized depth of coverage by 10× Genomics reads (1 Mb window). The third circle displays the average read depth of coverage of regions specifically homologous to I. trifida or I. triloba genomes (1 Mb window). The fourth circle displays the total length of specific regions (1 Mb window size). The fifth circle displays the percentage of the homologous sequences shared among the hexaploid genome and the two diploid genomes (1 Mb window size). The innermost circle displays homologies among the hexaploid and two diploid genomes
Fig. 4
Fig. 4
Genetic diversity of key African sweetpotato accessions. a Neighbor-joining phylogenetic tree of the Mwanga Diversity Panel accessions based on single nucleotide polymorphisms detected using the I. trifida genome as the reference. Population membership based on previous simple sequence repeat analysis is indicated by branch colors. Numbers at nodes indicate the percentage of 1000 bootstrap replications that support each clade. Huarmeyano was used as an outgroup for rooting. b Read depth analyses of “Beauregard” and “NASPOT 5” based on alignment to the I. trifida genome. For each box plot, the lower and upper bounds of the box indicate the first and third quartiles, respectively, and the center line indicates the median. c A metaphase cell of “Beauregard” showing 90 chromosomes and “NASPOT 5” showing 88 chromosomes. Bars represent 10 μm
Fig. 5
Fig. 5
Analysis of carotenoid metabolism in hexaploid sweetpotato. a Carotenoid biosynthesis and degradation pathways. Dashed arrows indicate multi-step reactions. Red arrows indicate degradation reactions. Red rectangles indicate components with significantly enriched SNPs at p < 0.005 (Fisher’s exact test). PSY, phytoene synthase; PDS phytoene desaturase; Z-ISO ζ-carotene isomerase; ZDS ζ-carotene desaturase; CRTISO carotenoid isomerase; LCYE lycopene ε-cyclase; LCYB lycopene β-cyclase; β-OHase β-ring hydroxylase; CYP cytochrome P450; VDE violaxanthin de-epoxidase; ZEP zeaxanthin epoxidase; CCD carotenoid cleavage dioxygenase. b Fisher’s exact test for differences in allele frequencies between orange and white-fleshed MDP accessions for putative carotenoid biosynthesis loci. Each color within a chromosome indicates SNPs from the same gene. The dotted and solid lines indicate p = 0.005 and p = 0.05, respectively. c Expression profiles of genes involved in carotenoid biosynthesis in different types of roots of ‘Beauregard’ during development. Gene-wise Z-scores were calculated from the arithmetic means of replicates after log2 transformation of FPKM values plus 1. DAT days after transplanting; Undiff undifferentiated
Fig. 6
Fig. 6
Phylogenetic relationships among members of the Batatas complex. a Phylogenetic relationships among Batatas complex accessions inferred using the species-tree method ASTRAL-II. Bootstrap support values are shown next to the branches. Relationships among I. trifida and I. batatas accessions were not resolved. b Phylogenetic network of the Batatas complex including pseudolikelihood estimates for hybridization events in the ancestor of red, green and yellow clades as well as in the ancestry of cultivated sweetpotato. Blue lines indicate the two-reticulation events inferred in PhyloNet. Below the phylogenetic network are −log-likelihood scores for the tree generated in PhyloNet under the zero-reticulation model (Supplementary Fig. 20d) and the network estimated under the two-reticulation model. Color bars at the right of each tree denote the six inferred major lineages

References

    1. Loebenstein, G. in The Sweetpotato (eds Loebenstein, G. & Thottappilly, G. eds.) 9–12 (Springer, 2009).
    1. Labarta, R. in Crop Improvement, Adoption, and Impact of Improved Varieties in Food Crops in Sub-Saharan Africa (eds. Walker, T. S. & Alwang, J.) 164–182 (CABI, 2015).
    1. Low JW, Mwanga ROM, Andrade M, Carey E, Ball AM. Tackling vitamin A deficiency with biofortified sweetpotato in sub-Saharan Africa. Glob. Food Sec. 2017;14:23–30. doi: 10.1016/j.gfs.2017.01.004. - DOI - PMC - PubMed
    1. Austin, D. F. in Exploration, Maintenance and Utilization of Sweet Potato Genetic Resources. Report of the First Sweet Potato Planning Conference (International Potato Centre (CIP), Lima, Peru, 1987) (ed. P., G.) 27–59 (CIP, 1988).
    1. Roullier C, Benoit L, McKey DB, Lebot V. Historical collections reveal patterns of diffusion of sweet potato in Oceania obscured by modern plant movements and recombination. Proc. Natl Acad. Sci. USA. 2013;110:2205–2210. doi: 10.1073/pnas.1211049110. - DOI - PMC - PubMed

Publication types