. 2018 Nov 2;9(1):4593.
doi: 10.1038/s41467-018-07053-9.

Tissue-resident memory T cells populate the human brain

Affiliations

Tissue-resident memory T cells populate the human brain

Joost Smolders et al. Nat Commun. .

Abstract

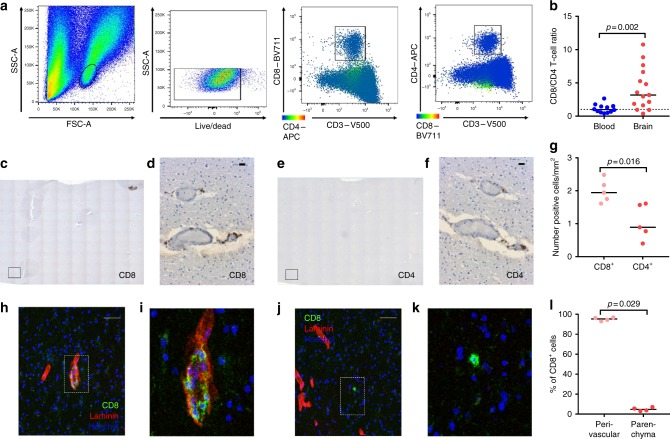
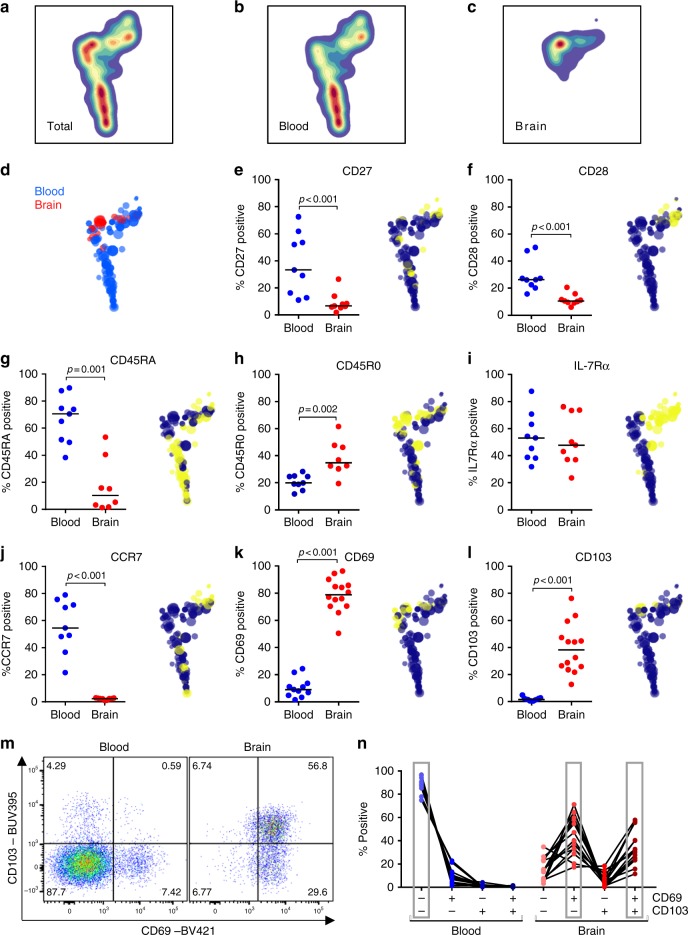
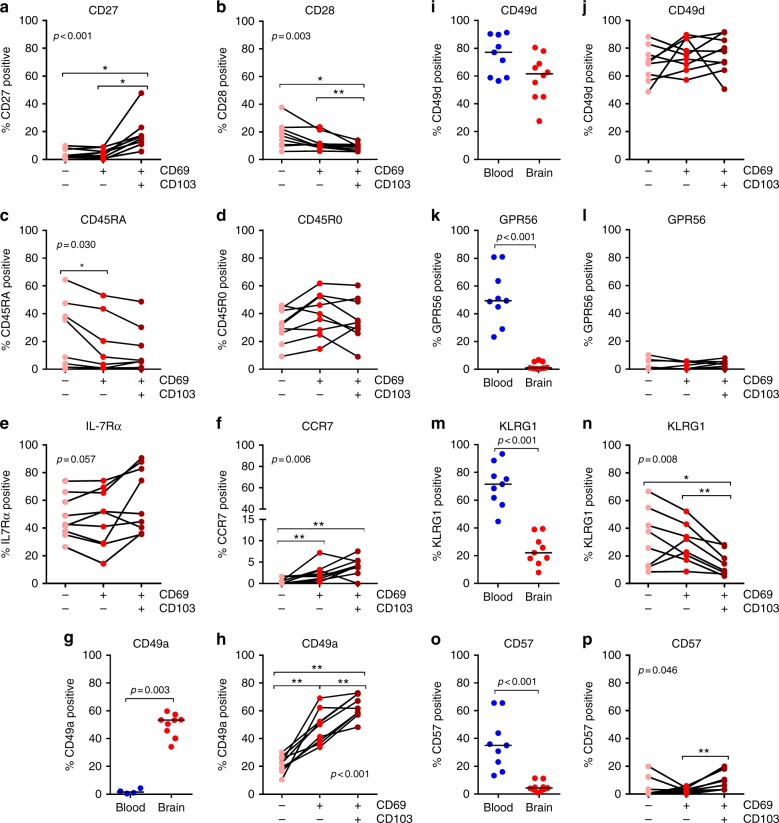
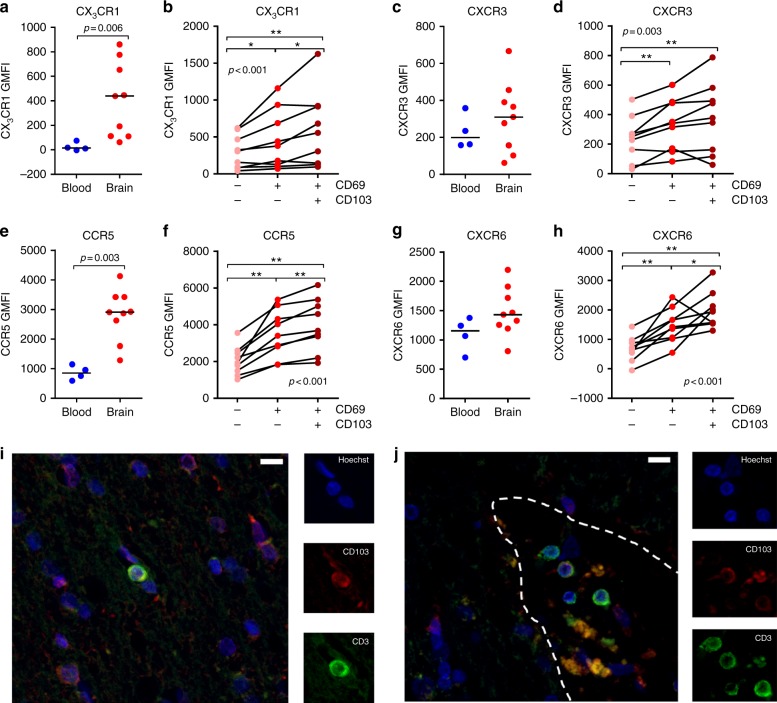
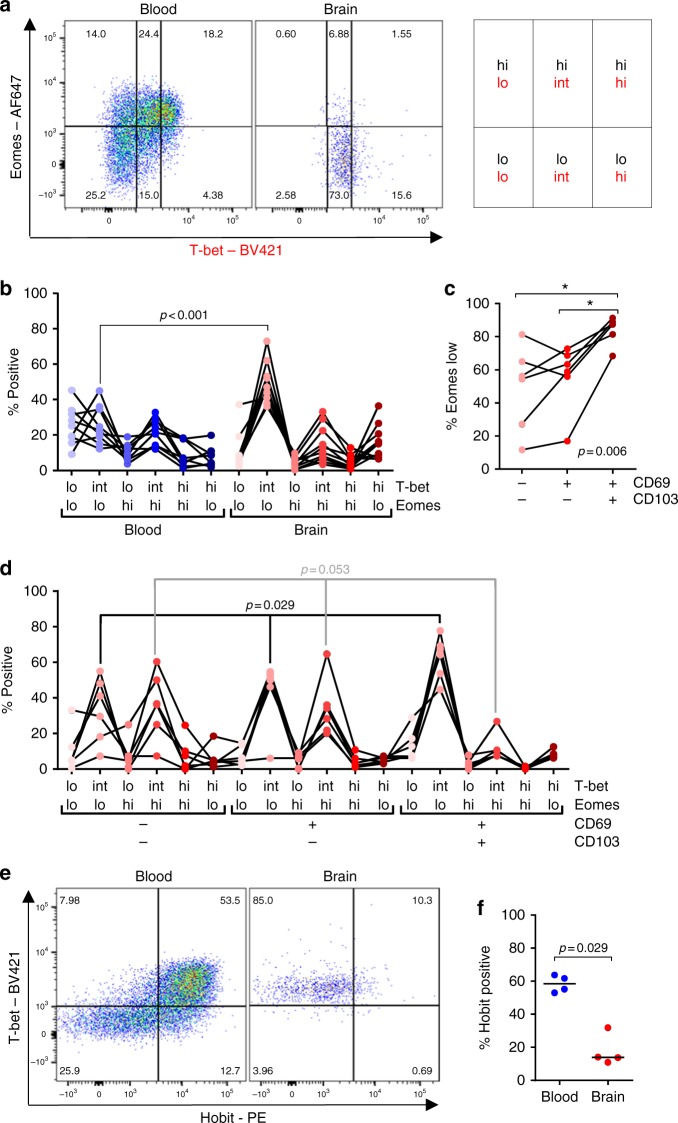
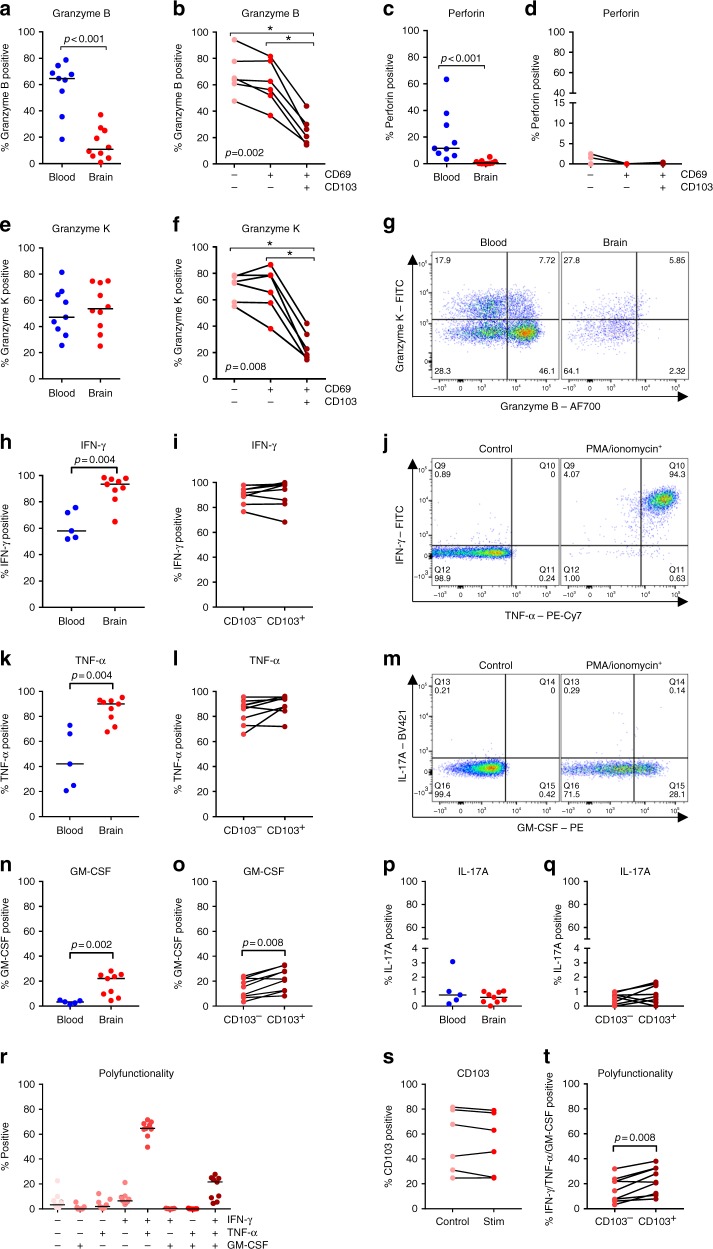
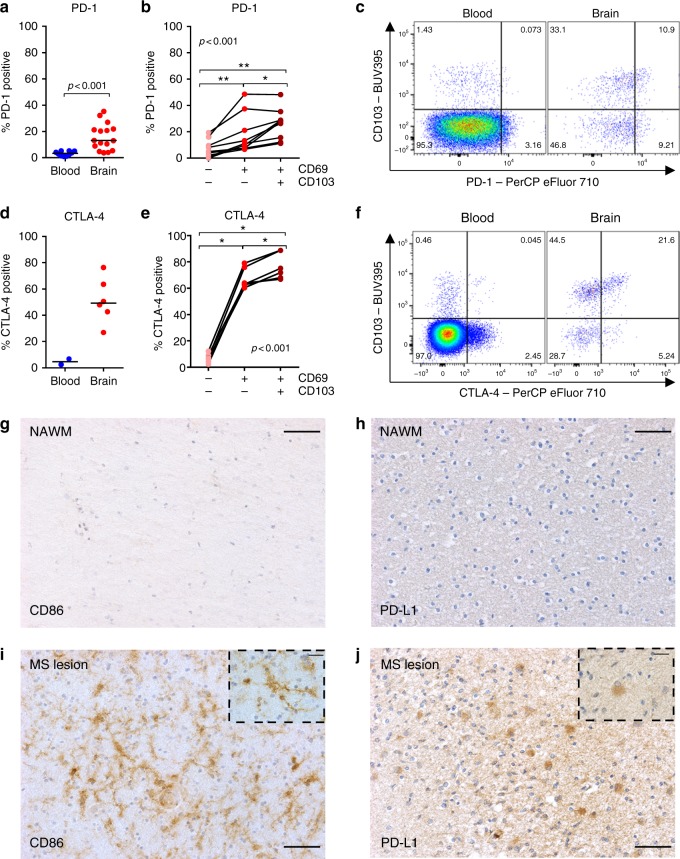
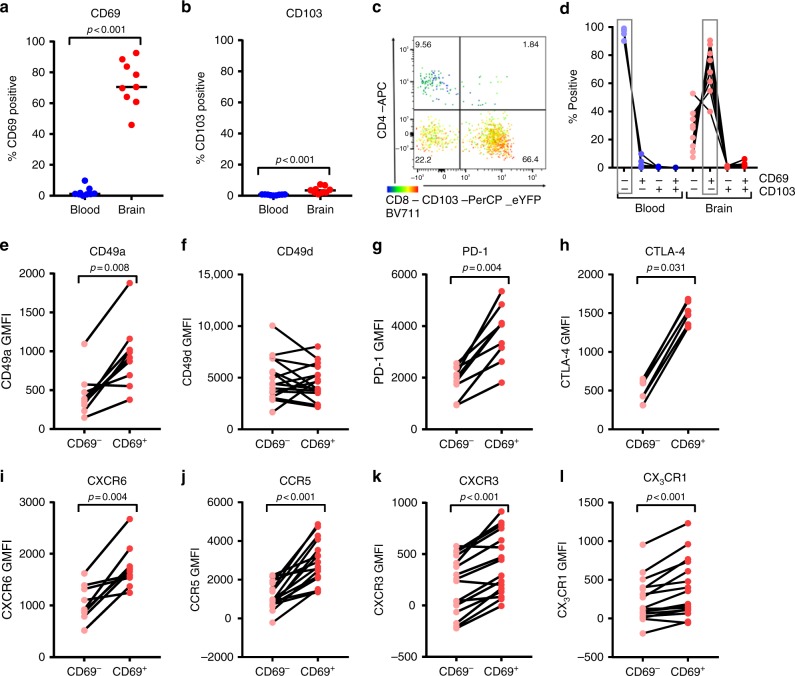
Most tissues are populated by tissue-resident memory T cells (TRM cells), which are adapted to their niche and appear to be indispensable for local protection against pathogens. Here we show that human white matter-derived brain CD8+ T cells can be subsetted into CD103-CD69+ and CD103+CD69+ T cells both with a phenotypic and transcription factor profile consistent with TRM cells. Specifically, CD103 expression in brain CD8+ T cells correlates with reduced expression of differentiation markers, increased expression of tissue-homing chemokine receptors, intermediate and low expression of the transcription factors T-bet and eomes, increased expression of PD-1 and CTLA-4, and low expression of cytolytic enzymes with preserved polyfunctionality upon activation. Brain CD4+ T cells also display TRM cell-associated markers but have low CD103 expression. We conclude that the human brain is surveilled by TRM cells, providing protection against neurotropic virus reactivation, whilst being under tight control of key immune checkpoint molecules.


Conflict of interest statement

The authors declare no competing interests.

Figures

Fig. 1
Fig. 1
CD8+ and CD4+ T cells populate the human brain. a Gating procedure applied to analyze brain CD3+CD4+ and CD3+CD8+ T cells, eluted from normal-appearing white matter. b Quantification of the CD8+/CD4+ T-cell ratio. Immunohistochemical staining of CD8- (c, d) and CD4- (e, f) immunoreactive cells in normal subcortical white matter of a donor without brain disease. c, e Overview of 10 × 10 tiled images at 10× magnification; the marked square indicates a bright field. d, f 20× magnification (scale bar = 20 µm). g Quantification of CD8-immunoreactive and CD4-immunoreactive cells (number/mm2). hk Immunofluorescent staining of CD8 (green), laminin (red), and Hoechst (blue) at 10× magnification (scale bar = 50 µm) (h, j) and a zoom-in (i, k). l Quantification of CD8-immunoreactive cells co-localizing with laminin (perivascular space) or not co-localizing with laminin (parenchyma). Bars show median values. p-values show Mann–Whitney U test
Fig. 2
Fig. 2
Human brain CD8+ T cells express the tissue residence markers CD69 and CD103. ac HSNE plot of paired brain-derived and blood-derived CD8+ T cells of n = 5 donors, based on expression of markers shown in this figure, as well as KLRG1 and GPR56, shows segregated clustering of blood-derived and brain-derived CD8+ T cells. d Distribution of hierarchical clusters in the HSNE plot with the size of the dots indicating hierarchical cluster size. el Quantification of CD8+ T cells expressing CD27, CD28, CD45RA, CD45R0, IL-7Rα, CCR7, CD69, and CD103, respectively. In the HSNE plots, yellow dots indicate positive and blue dots negative hierarchical clusters. Clustering of brain CD8+ T cells is most prominently characterized by high expression of CD69 and CD103. Bars show median values. p-values show Mann–Whitney U test; no brackets indicate no significant difference. m Dot plot of CD69 and CD103 co-expression in CD3+CD8+ T cells eluted from blood and brain. n Co-expression of CD69 and CD103. The dominant phenotype was CD69CD103 in blood and CD69+CD103 and CD69+CD103+ in brain
Fig. 3
Fig. 3
Human brain CD8+ T cells distinctly express surface markers, based on CD69 and CD103 co-expression. ap Quantification of CD8+ T cells expressing CD27, CD28, CD45RA, CD45R0, IL-7Rα, CCR7, CD49a, CD49d, GPR56, KLRG1, and CD57, respectively, in n = 9 donors. Bars show median values. p-values show Mann–Whitney U test for unpaired data (g, i, k, m, o) and Friedman test for paired data with Wilcoxon signed ranks as post hoc test (af, h, j, l, n, p) (*p < 0.05, **p < 0.01); no brackets indicate no significant difference
Fig. 4
Fig. 4
Human brain CD69+CD103+ CD8+ T cells are enriched for tissue-homing chemokine receptors. ah Quantification of CD8+ T-cell expression levels of CX3CR1, CXCR3, CCR5, and CXCR6 (GMFI, geometric mean fluorescence intensity). Bars show median values. p-values show Mann–Whitney U test for unpaired data (a, c, e, g) and Friedman test for paired data with Wilcoxon signed ranks as post hoc test (b, d, f, h) (*p < 0.05, **p < 0.01); no brackets indicate no significant difference. i, j Immunofluorescent staining for CD3 and CD103 of paraffin tissue shows a parenchymal (i) and perivascular (j) localization of CD3 (green) and CD103 (red) immunoreactive cells. Borders of the perivascular space were designated based on histological hallmarks (i.e., lymphocytes in close relationship with the extraluminal side of a blood vessel) and are marked with a dotted white line (scale bar = 10 µm)
Fig. 5
Fig. 5
Human brain CD8+ T cells show a T-bet-intermediate/eomes-low phenotype. a Dot plot showing the gating strategy T-bet and eomes in a paired blood and brain sample. T-bet and eomes co-expression (lo/lo > int/lo > lo/hi > int/hi > hi/hi > hi/lo) correlates in virus-specific CD8+ T-cell with differentiation from central memory to terminally differentiated effector cells, respectively. b Comparison between blood and brain CD8+ TRM cells, and stratification based on CD69 and CD103 co-expression of brain eomes low (c) and all T-bet/eomes subsets (d). e Dot plot of T-bet and Hobit co-expression by CD8+ T cells from brain and blood of a donor. f Quantification of Hobit-positive cells is shown. Bars show median values. p-values show Mann–Whitney U test (b, f) and Friedman test with Wilcoxon signed ranks as post hoc test (cd) (*p < 0.05, **p < 0.01); no brackets indicate no significant difference
Fig. 6
Fig. 6
CD103+ brain CD8+ T cells express few cytolytic enzymes but show a polyfunctional cytokine profile. af Quantification of the percentage of brain CD8+ T cells directly ex situ expressing granzyme B, perforin, and granzyme K, respectively. g Representative dot plots of CD3+CD8+ T cells stained for granzyme B and granzyme K. hi, kl, nq Quantification of the percentage of brain CD8+ T cells positive for IFN-γ, TNF-α, GM-CSF, and IL-17A after stimulation with PMA/ionomycin in vitro. j, m Dot plot of PMA/ionomycin-stimulated CD3+CD8+ T cells stained for the respective cytokines. r Quantification of IFN-γ, TNF-α, and GM-CSF co-expression, t stratified for expression CD103. s CD103 expression in brain CD8+ TRM control and PMA/ionomycin-stimulated cells. p-values show Mann–Whitney U test (a, c, e, h, k, n, p), Friedman test for paired data with Wilcoxon signed ranks as post hoc test (b, d, f), or Wilcoxon signed ranks test (il, o, qs, t) (*p < 0.05, **p < 0.01); no brackets indicate no significant difference
Fig. 7
Fig. 7
Enrichment CTLA-4 and PD-1 expression on brain CD8+ T cells. a, b, d, e Quantification of the percentage of CD8+ T cells expressing PD-1 and CTLA-4, respectively. Bars show median values. p-values show Mann–Whitney U test for unpaired data (a, d) and Friedman test for paired data with Wilcoxon signed ranks as post hoc test (b, e) (*p < 0.05, **p < 0.01); no brackets indicate no significant difference. Representative dot plots of CD3+CD8+ lymphocytes stained for c PD-1 and CD103 and f CTLA-4 and CD103. Immunohistochemical staining for g CD86 (ligand of CTLA-4, brown) and h PD-L1 (ligand of PD-1, brown) in a donor with Alzheimer’s disease and a donor without brain disease showed no staining (scale bar = 50 µm). However, in an HLA-DR-positive active, demyelinating MS lesion of a donor with MS, specific staining for i CD86 and j PD-L1 was found in microglia and astrocyte-like cells, respectively (scale bar = 50 µm; scale bar insert = 20 µm)
Fig. 8
Fig. 8
Human brain CD4+ CD69+ T cells are enriched for core phenotypic TRM-cell markers. a, b, d Quantification of CD69 and CD103 (co-)expression. p-values show Mann–Whitney U test. c Representative dot plot of CD4, CD8, and CD103 staining of brain CD3+ CD69+ T cells. d Co-expression of CD69 and CD103. The dominant phenotype was CD69CD103 in blood and CD69+CD103 in brain. el Quantification of CD4+ T-cell expression levels of CD49a, CD49d, PD-1, CTLA-4, CXCR6, CCR5, CXCR3, and CX3CR1 (GMFI, geometric mean fluorescence intensity). p-values show the Wilcoxon signed ranks test

References

    1. Schenkel JM, Masopust D. Tissue-resident memory T cells. Immunity. 2014;41:886–897. doi: 10.1016/j.immuni.2014.12.007. - DOI - PMC - PubMed
    1. Park CO, Kupper TS. The emerging role of resident memory T cells in protective immunity and inflammatory disease. Nat. Med. 2015;21:688–697. doi: 10.1038/nm.3883. - DOI - PMC - PubMed
    1. Mueller SN, Mackay LK. Tissue-resident memory T cells: local specialists in immune defence. Nat. Rev. Immunol. 2016;16:79–89. doi: 10.1038/nri.2015.3. - DOI - PubMed
    1. Ariotti S, et al. T cell memory. Skin-resident memory CD8+ T cells trigger a state of tissue-wide pathogen alert. Science. 2014;346:101–105. doi: 10.1126/science.1254803. - DOI - PubMed
    1. Wong MT, et al. A high-dimensional atlas of human T cell diversity reveals tissue-specific trafficking and cytokine signatures. Immunity. 2016;45:442–456. doi: 10.1016/j.immuni.2016.07.007. - DOI - PubMed

Publication types

MeSH terms