. 2018 Nov 2;9(1):4603.
doi: 10.1038/s41467-018-07054-8.

Loss of embryonic neural crest derived cardiomyocytes causes adult onset hypertrophic cardiomyopathy in zebrafish

Affiliations

Loss of embryonic neural crest derived cardiomyocytes causes adult onset hypertrophic cardiomyopathy in zebrafish

Sarah Abdul-Wajid et al. Nat Commun. .

Abstract

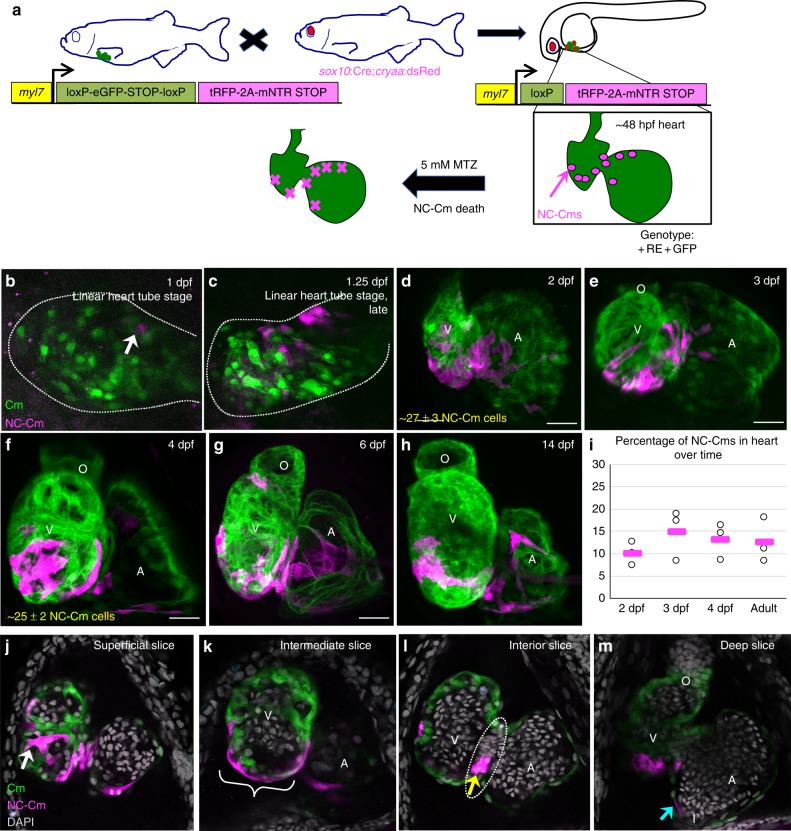
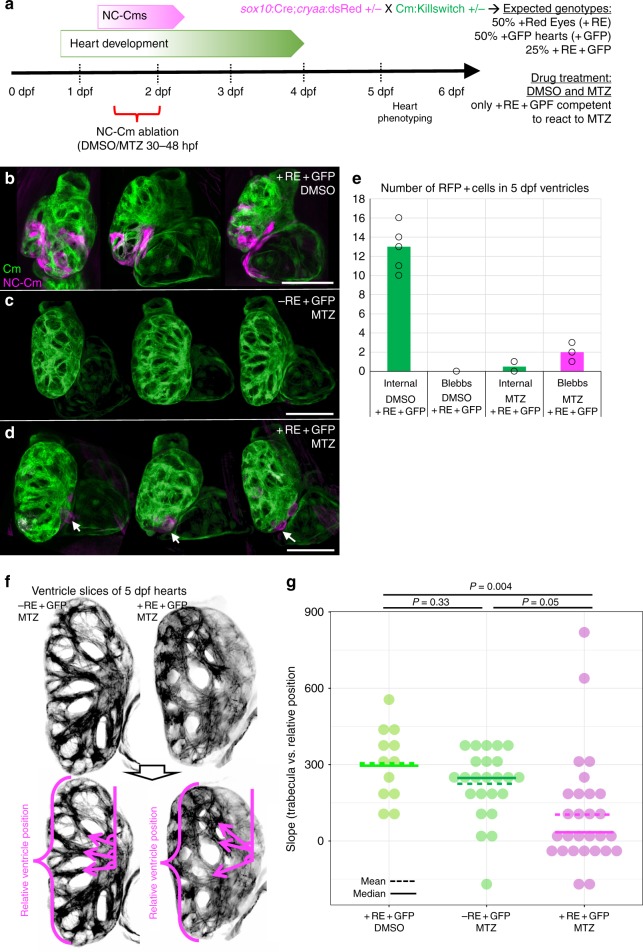
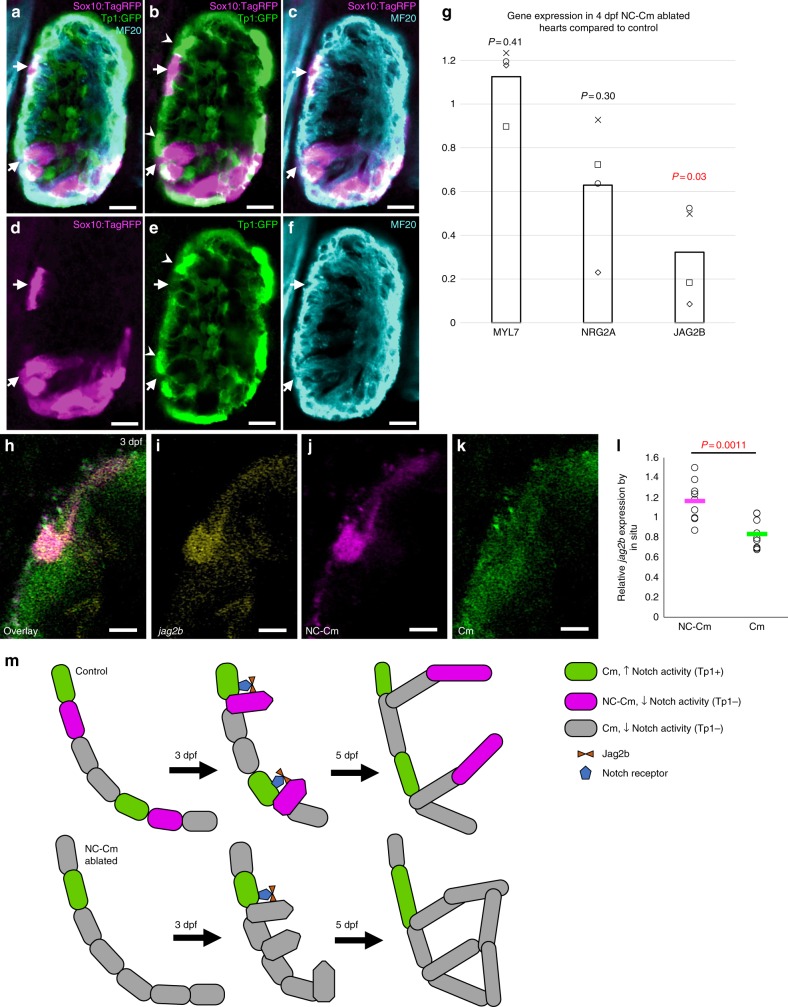
Neural crest cells migrate to the embryonic heart and transform into a small number of cardiomyocytes, but their functions in the developing and adult heart are unknown. Here, we show that neural crest derived cardiomyocytes (NC-Cms) in the zebrafish ventricle express Notch ligand jag2b, are adjacent to Notch responding cells, and persist throughout life. Genetic ablation of NC-Cms during embryogenesis results in diminished jag2b, altered Notch signaling and aberrant trabeculation patterns, but is not detrimental to early heart function or survival to adulthood. However, embryonic NC-Cm ablation results in adult fish that show severe hypertrophic cardiomyopathy (HCM), altered cardiomyocyte size, diminished adult heart capacity and heart failure in cardiac stress tests. Adult jag2b mutants have similar cardiomyopathy. Thus, we identify a cardiomyocyte population and genetic pathway that are required to prevent adult onset HCM and provide a zebrafish model of adult-onset HCM and heart failure.


Conflict of interest statement

The authors declare no competing interests.

Figures

Fig. 1
Fig. 1
Mapping neural crest-derived cardiomyocytes (NC-Cms) during zebrafish heart development. a Schematic of the NC-Cm lineage labeling and ablation setup using the Cm:KillSwitch transgenic (myl7-driven transgene) crossed to the NC driver Tg(sox10:cre;cryaa:dsRed). Metronidazole (MTZ) treatment causes mNTR-expressing cells to die, i.e., NC-Cms switched to express tagRFP + and mNTR. bh Contribution of NC-Cms to the developing heart over time. Confocal maximum intensity images of each development stage (1–14 dpf). On average, 27 ± 3 NC-Cms were found at 2 dpf, and this number did not significantly increase by 4 dpf (25 ± 2 NC-Cms). Quantification was from confocal 3D stack images at indicated timepoints and from three individuals. Dotted line outlines heart tube. Scale bar = 25 µm. i Graph displays percent of total cardiomyocytes that are tRFP + (i.e., NC-Cms). Cells were dissociated from isolated hearts at each of the indicated developmental stages and analyzed by flow cytometry. After live cell gating, the sum of GFP and RFP-positive counts was deemed as the total cardiomyocyte count. RFP counts divided by total cardiomyocyte count was used to compute percentages. Circles are biological replicates at each time point and bars are the average of replicates. jm Confocal slices of a 4 dpf heart from NC-Cm lineage-labeled embryos. White arrow indicates trabeculating NC-Cm. Bracket denotes the apex of the ventricle. Dashed line encircles the AV canal and the yellow arrow indicates the couple of NC-Cms found on the outer curvature of the AV canal. Blue arrow indicates the NC-Cm found at the border of the inflow tract. O = outflow tract, V = ventricle, A = atrium. Scale bar is 30 µm. Images are representative of n ≥ 3
Fig. 2
Fig. 2
NC-Cm ablation alters trabeculae patterning. a Schematic of NC-Cm ablation protocol. Tg(Cm:KillSwitch) and Tg(sox10:cre;cryaa:dsRed) heterozygotes were crossed to generate three genotypes: Tg(Cm:KillSwitch) ( + GFP); Tg(sox10:cre:cryaa:dsRed) ( + RE); or double-transgenic ( + RE + GFP). Double-transgenic embryos were treated with DMSO (control) or MTZ from 30–48hpf to ablate NC-Cms. Sibling Tg(Cm:KillSwitch (-RE + GFP) were treated with MTZ as a drug control. Embryos were phenotyped at 5 dpf. bd Confocal maximum intensity projection images from three hearts at 5 dpf from each condition. NC-Cm cells (tagRFP + ) were absent from the MTZ)-treated + RE + GFP embryos compared with their DMSO treated sibling controls (d compared with b). White arrows indicate a remnant, extruding NC-Cm as a consequence of cell death. Scale bar = 100 µm. e Quantification of the number of tagRFP + cells in the 5 dpf ventricle (“internal”) in control (DMSO + RE + GFP) and NC-CM ablated embryos (MTZ + RE + GFP). Bars are mean of individual hearts (open circles) quantified in each condition. Individual protrusions from the ventricle (“blebbs”) that were tagRFP + were also quantified. f Trabeculation analysis of control and NC-Cm-ablated hearts at 5 dpf. Control hearts (left panels) had an array of trabeculae with primary branches arranged along anterior–posterior coordinate. In contrast, NC-Cm-ablated ventricles (from protocol in a) had poorly organized trabeculae (right panels). The angle of the primary branch of a trabecula and relative anterior–posterior position of the primary branch within the ventricle were measured as shown in bottom panel, magenta arrows depict primary trabecula branch; relative position in ventricle axis as represented by bracket. The position and angle of the primary trabeculae branches were measured relative to the AV canal. These data were collected for controls (-RE + GFP, MTZ treated) and NC-Cm-ablated hearts ( + RE + GFP, MTZ treated) and a slope was computed using the trabecula angle to position data for each individual heart (see Supplementary Figure 7). g Computed slope values for individual hearts in each treatment. Mean is indicated by the dashed line and median by the solid line. The slope measurement was significantly different for NC-Cm-ablated hearts compared with their sibling controls. P-values computed by TukeyHSD on ANOVA (F(62,60) = 3.31)
Fig. 3
Fig. 3
NC-Cm cells regulate Notch signaling during trabeculation. af Ventricle sections of a 3 dpf embryo from a sox10:tagRFP transgenic line crossed with the Notch reporter Tp1:GFP line, immunostained for the cardiomyocyte marker MF20. NC-derived lineages (tagRFP) did not show high levels of Notch response (GFP). Arrows indicate trabeculating NC-Cms that were next to a Notch-activated cardiomyocyte (arrowheads). Scale bar = 10 µm. g qPCR gene expression of isolated 4 dpf hearts from NC-Cm-ablated and control siblings. Values are delta delta Ct computations. Bars represent mean of four biological replicates. Points are individual experiments. Delta Ct values used to compute standard T test significance (P-values shown) between NC-Cm ablated and control delta Ct values. hk Jag2b fluorescent in situ hybridization in a magnified ventricle section of 3 dpf NC-Cm lineage-labeled embryos. Scale bar = 5 µm. Image is representative of N = 17 embryos imaged and analyzed in probe positive in situs compared with probe negative embryos imaged and analyzed. l Quantification of jag2b fluorescent in situ signal in individual NC-Cm and Cm ventricle cells. Relative intensity was computed by the average intensity of all jag2b expression in the heart cells and then comparing with individual NC-Cm tRFP + and Cm GFP + cell intensities. Circles are individual cells from N = 3 embryos from three independent in situ experiments. Bar = mean. Standard T test was used for P-value. m Schematic model in which NC-Cms provide spatial patterning of trabeculation using Notch signaling components. During the transition to initiate trabeculae, NC-Cms provide a significant source of jag2b expression that triggers its neighbor Cm to repress protrusion and trabeculation initiation. This results in evenly, spatially distinct trabeculae branches at 5dpf. However, without NC-Cms and their major source of jag2b expression (although not exclusive as indicated by the remaining Cm expressing jag2b at 3dpf), more Cms are poised to protrude and create trabeculae, yielding conjoined branches and poor trabeculae spacing by 5 dpf
Fig. 4
Fig. 4
Ablation of embryonic NC-Cms results in adult-onset hypertrophic cardiomyopathy and heart failure. ac Whole-mount fluorescent images of adult hearts from embryonic NC-Cms ablation experiments (protocol in Fig. 2a). Red numbers represent percent of NC-Cms relative to total cardiomyocytes (GFP + and RFP + ), not total heart cells, quantified by flow cytometry (FACS) of dissociated adult hearts (Supplementary Figure 9). d FACS quantification of NC-Cms. Dots are individual hearts from each condition and bars = mean of individuals in each group (n = 4 + RE + GFP, DMSO and n = 5 + RE + GFP, MTZ) eg Fluorescent microscopy sections of hearts from sibling individuals as in A-C. scale bar = 100 µm. h Quantification of area of ventricle covered in cardiomyocytes from sections similar to df. Dots represent sibling individuals from each condition pooled from biological replicates. Solid line = median, dashed line = mean. P-values computed by TukeyHSD on ANOVA (F(2,16) = 9.48). i-j Examples of single-cell cardiomyocyte morphology from dissociated control (i) and NC-Cm-ablated adult ventricles. Cells were cultured in chambers for 24 h to allow cell attachment, then fixed and stained with anti-GFP and DAPI and visualized by microscopy. Scale bar = 10 µm. k Quantification of individual cardiomyocyte area from chamber cultures as in “i, j”; n ≥ 25 cells per sample. P-value from standard T test. l Quantification of individual cardiomyocyte lengths from chamber cultures as in “i, j”. P-value from standard T test. m Example still image from movies of swim tunnel assays of individual male zebrafish. Red arrow indicates water current direction. n Swim trial assay provided incremental water speed increases of 0.05 m/s every 6 min (solid black line). Average assay results for DMSO control (light green, n = 4), MTZ control (dark green, n = 5) and NC-Cm-ablated (magenta, n = 8) adults. Data are amalgamated from n = 5 biological replicates. See Supplementary Movie 2. o Individual Ucrit results normalized to body length from assay in "m". See Methods for Ucrit calculation. Dots represent individual males from each condition. Solid line = median, dashed line = mean. P-values computed by TukeyHSD on ANOVA (F(2,13) = 24.65)
Fig. 5
Fig. 5
Jag2b mutant adults phenocopy hypertrophic cardiomyopathy of the NC-Cm ablated adults. ac Microscopy sections of adult ventricles from jag2b wild-type ( + / + ), heterozygous ( + /-), and homozygous (-/-) mutants. Sections were stained with phalloidin-488 and imaged. Scale bar = 100 µm. d Area of ventricle with 488 + trabecular myocardium was quantified as in 4 H and tested for significance by two-way T tests

References

    1. Meulemans D, Bronner-Fraser M. Gene-regulatory interactions in neural crest evolution and development. Dev. Cell. 2004;7:291–299. doi: 10.1016/j.devcel.2004.08.007. - DOI - PubMed
    1. Sato M, Yost HJ. Cardiac neural crest contributes to cardiomyogenesis in zebrafish. Dev. Biol. 2003;257:127–139. doi: 10.1016/S0012-1606(03)00037-X. - DOI - PubMed
    1. Li YX, et al. Cardiac neural crest in zebrafish embryos contributes to myocardial cell lineage and early heart function. Dev. Dyn. 2003;226:540–550. doi: 10.1002/dvdy.10264. - DOI - PubMed
    1. Keyte A, Hutson MR. The neural crest in cardiac congenital anomalies. Differentiation. 2012;84:25–40. doi: 10.1016/j.diff.2012.04.005. - DOI - PMC - PubMed
    1. Cavanaugh AM, Huang J, Chen JN. Two developmentally distinct populations of neural crest cells contribute to the zebrafish heart. Dev. Biol. 2015;404:103–112. doi: 10.1016/j.ydbio.2015.06.002. - DOI - PMC - PubMed

Publication types