. 2018 Nov 2;8(1):16245.
doi: 10.1038/s41598-018-34631-0.

Flow cytometric analysis of Xenopus laevis and X. tropicalis blood cells using acridine orange

Affiliations

Flow cytometric analysis of Xenopus laevis and X. tropicalis blood cells using acridine orange

Kei Sato et al. Sci Rep. .

Abstract

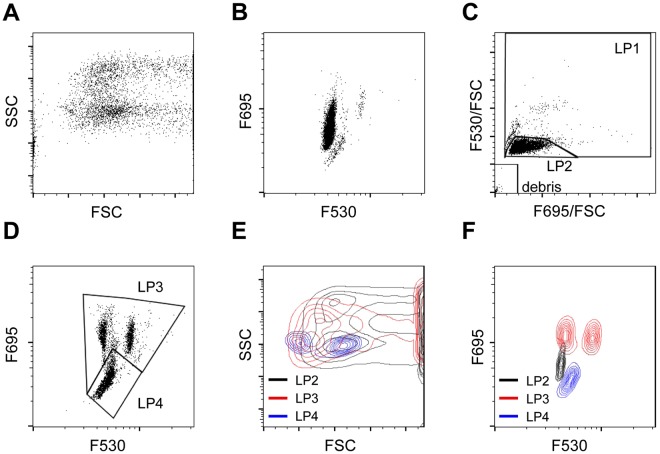
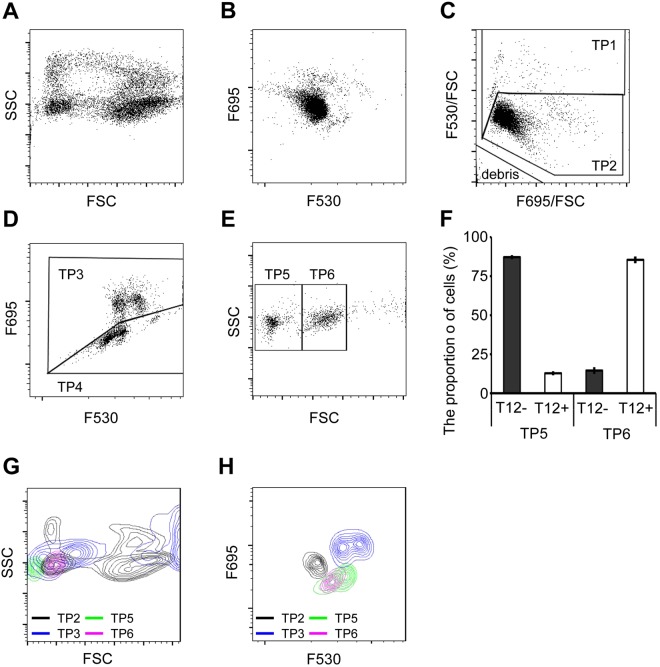
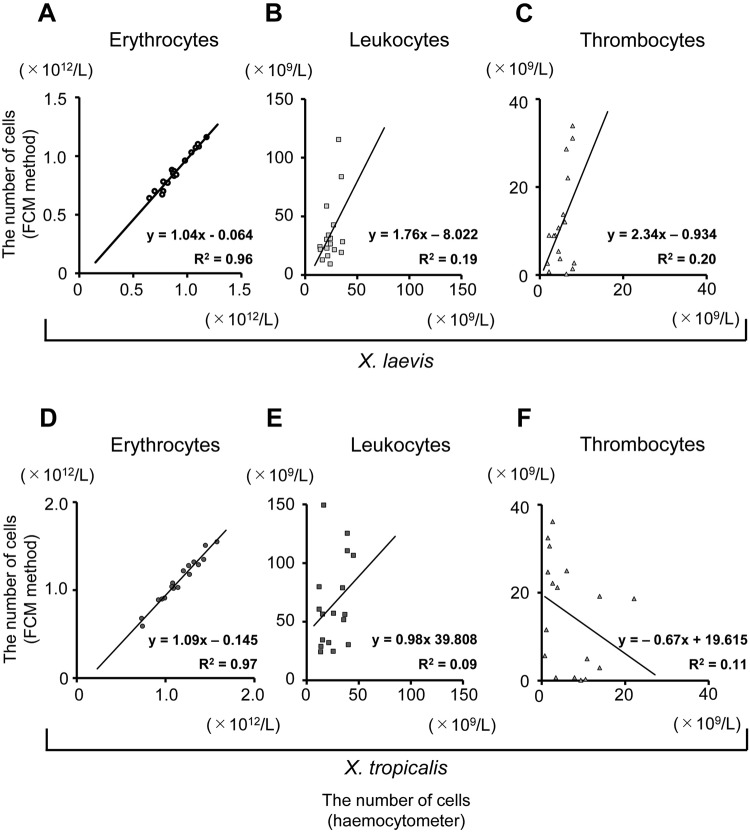
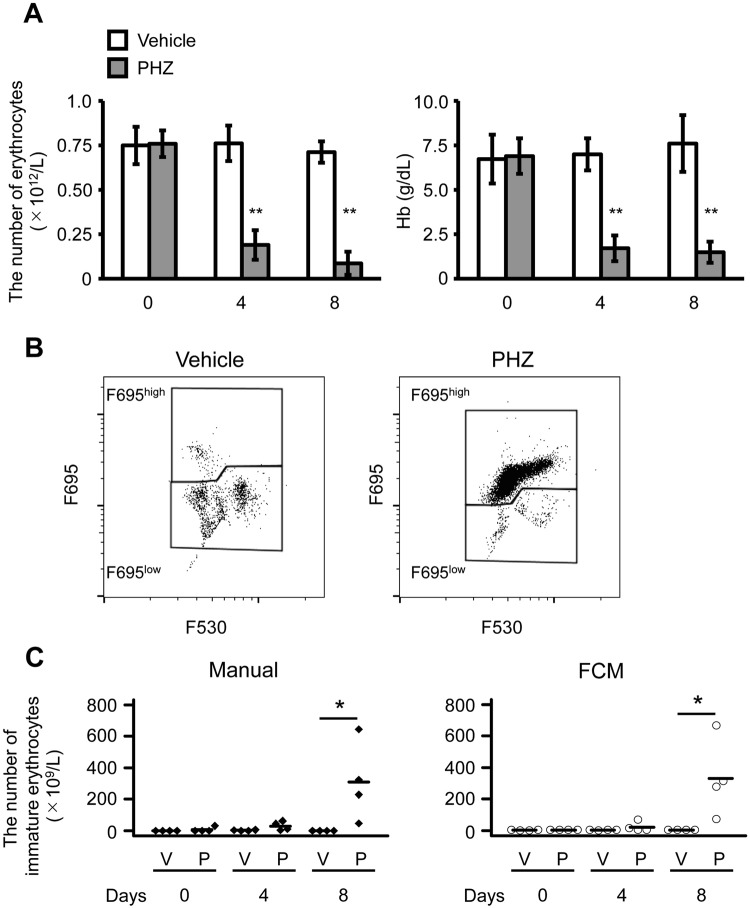
Automated blood cell counters can distinguish cells based on their size and the presence or absence of a nucleus. However, most vertebrates have nucleated blood cells that cannot be counted automatically. We established an alternative automatic method for counting peripheral blood cells by staining cells with the fluorescent dye acridine orange (AO) and analysing cell populations using flow cytometry (FCM). As promising new animal models, we chose Xenopus laevis and three inbred strains of X. tropicalis. We compared the haematological phenotypes, including blood cell types, cell sizes, cellular structure, and erythrocyte lifespans/turnover rate among X. laevis and the three inbred strains of X. tropicalis. Each cell type from X. laevis was sorted according to six parameters: forward- and side-scattered light emission, AO red and green fluorescence intensity, and cellular red and green fluorescence. Remarkably, the erythrocyte count was the highest in the Golden line, suggesting that genetic factors were associated with the blood cells. Furthermore, immature erythrocytes in anaemic X. laevis could be separated from normal blood cells based on red fluorescence intensity. These results show that FCM with AO staining allows for an accurate analysis of peripheral blood cells from various species.


Conflict of interest statement

Y. N. is an employee of NIHON KOHDEN CORPORATION.

Figures

Figure 1
Figure 1
The molar extinction coefficient of sodium lauryl sulphate-haemoglobin (SLS-Hb). (A) X. laevis haemoglobin was purified, and SDS-PAGE was performed. Monomeric (14 kDa) and dimeric (30 kDa) Hbs were detected. M: Molecular marker; N: Non-reduction condition; R: Reduction condition. (B) The absorbance at 535 nm of SLS-Hb was measured and the molar extinction coefficient was calculated. Bar indicates the mean of the extinction coefficient (n = 66). (C,D) The fluorescence of purified haemoglobin was measured. (C) Excitation 485/20 nm, emission 528/20 nm. (D) Excitation 485/20 nm, emission 590/35 nm.
Figure 2
Figure 2
Scattergram analysis of peripheral blood from X. laevis. (A) Scattergram indicates forward-scattered light (FSC) and side-scattered light (SSC). (B) Scattergram indicates the F530 and F695 fluorescence intensity. (C) X. laevis blood cell population LP1, LP2, and debris fractions developed based on the cellular red fluorescence intensity (F695/FSC) and cellular red fluorescence intensity (F530/FSC). (D) LP3 and LP4 were determined based on the F695 fluorescence intensity. (E) LP2, LP3, and LP4 were identified based on FSC and SSC. LP2 and LP3 partially overlapped, and LP4 completely overlapped with LP2 and LP3. (F) LP2, LP3 and LP4 were determined based on the F530 and F695 fluorescence intensity. LP2: Erythrocytes (grey); LP3: Granulocytes (Red); LP4: Lymphocytes and Thrombocytes (Blue).
Figure 3
Figure 3
Morphology of LP2, LP3, and LP4 cells. Erythrocytes and leukocytes/thrombocytes separated from whole blood cells using the Percoll method were analysed and sorted. May-Grunwald Giemsa (MGG) and periodic acid-Schiff (PAS) staining were performed on the LP2, LP3, and LP4 fractions. (A–C) MGG staining. (A) LP2, (B) LP3, and (C) LP4. LP2 cells were mononuclear with a large cytoplasm. LP2 cells had eosinophilic cytoplasm. LP3 had segmented nuclei and a large cytoplasm. Cells with a basophilic cytoplasm were found in the LP3 fraction. LP4 cells were mononuclear with a small cytoplasm. (D–F) PAS staining. (D) LP2, (E) LP3, and (F) LP4. The LP2 and LP4 cells were negative for PAS staining, and LP3 cells were positive for PAS staining. Scale bars: 20 µm. LP2: erythrocyte; LP3: granulocyte; LP4: lymphocyte and thrombocyte (inset).
Figure 4
Figure 4
Separation of thrombocytes from the LP4 fraction. (A) The LP4 fraction was analysed using forward-scattered light (FSC) and side-scattered light (SSC), and categorized as LP5 and LP6. The FSC of LP6 was higher than that of LP5. (B) LP5 and LP6 were analysed using F530 and F695 fluorescence intensity. LP5 and LP6 overlapped. (C,D) LP5 and LP6 cells were immunostained with the T12 antibody and analysed by flow cytometry (FCM). T12-positive cells were mostly found in the LP6 fraction, although the LP5 fraction had T12-positive cells (approx. 10%).
Figure 5
Figure 5
Scattergram analysis of peripheral blood (PB) from X. tropicalis. (A) Scattergram indicates FSC and SSC. (B) Scattergram indicates the F530 and F695 fluorescence intensity. (C) Blood cells were analysed for their cellular F695/FSC and F530/FSC intensities. The F530/FSC high and low populations were categorised as TP1 and TP2, respectively. (D) Based on F695 fluorescence intensity the TP1 fraction was separated into the TP3 (high intensity) and TP4 (low intensity) fractions. (E) Using FSC and SSC, the TP4 fraction was separated into TP5 (low FSC) and TP6 (high FSC). (F) TP5 and TP6 cells were immunostained with the T12 antibody and analysed by FCM. T12-positive cells were mostly found in the TP5 fraction, although the TP6 fraction had some T12-positive cells (approximately 10%). (G) TP2, TP3, TP5, and TP6 were developed using FSC and SSC. (H) TP2, TP3, TP5, and TP6 were analysed based on the F530 and F695 fluorescence intensity. TP2: Erythrocytes (grey); TP3: Granulocytes (Red); TP5: Lymphocytes (green); TP6: Thrombocytes (purple).
Figure 6
Figure 6
Comparison of haematological parameters between acridine orange (AO) staining and haemocytometer results. (A–C) Correlation between AO-staining and haemocytometer results in X. laevis. The number of (A) erythrocytes, (B) leucocytes, and (C) thrombocytes was identified. The number of leukocytes was determined using FCM, according to the sum of the number of granulocytes and lymphocytes. (D–F) Correlation between AO-staining and haemocytometer results in X. tropicalis. The number of (D) erythrocytes, (E) leucocytes, and (F) thrombocytes was determined.
Figure 7
Figure 7
Analysis of peripheral blood derived from anaemic X. laevis. (A) Erythrocyte counts (left panel) and haemoglobin (Hb) concentration (right panel) in peripheral blood after the administration of phenylhydrazine (PHZ; 25 mg/kg body weight, intraperitoneally, day 0). All values are shown as the mean ± SD. **p < 0.01 vs control (n = 4). (B) The LP3 fraction was analysed to determine the F530 and F695 fluorescence intensity. The F695high population of the LP3 fraction was markedly increased after PHZ administration. (C) Comparison of immature erythrocyte counts between the manual method (left panel) and flow cytometry (right panel). *p < 0.05 vs. control (n = 4).

Similar articles

Cited by

References

    1. Allender MC, Fry MM. Amphibian hematology. Vet Clin North Am Exot Anim Pract. 2008;11:463–480, vi. doi: 10.1016/j.cvex.2008.03.006. - DOI - PubMed
    1. Hadji-Azimi I, Coosemans V, Canicatti C. Atlas of adult Xenopus laevis laevis hematology. Dev Comp Immunol. 1987;11:807–874. doi: 10.1016/0145-305X(87)90068-1. - DOI - PubMed
    1. Wilson S, et al. Serum clinical biochemical and hematologic reference ranges of laboratory-reared and wild-caught Xenopus laevis. J Am Assoc Lab Anim Sci. 2011;50:635–640. - PMC - PubMed
    1. Session AM, et al. Genome evolution in the allotetraploid frog Xenopus laevis. Nature. 2016;538:336–343. doi: 10.1038/nature19840. - DOI - PMC - PubMed
    1. Kashiwagi K, et al. Xenopus tropicalis: an ideal experimental animal in amphibia. Exp Anim. 2010;59:395–405. doi: 10.1538/expanim.59.395. - DOI - PubMed

Publication types