

Enhanced method for High Spatial Resolution surface imaging and analysis of fungal spores using Scanning Electron Microscopy
- PMID: 30390022
- PMCID: PMC6214942
- DOI: 10.1038/s41598-018-34629-8
Enhanced method for High Spatial Resolution surface imaging and analysis of fungal spores using Scanning Electron Microscopy
Abstract
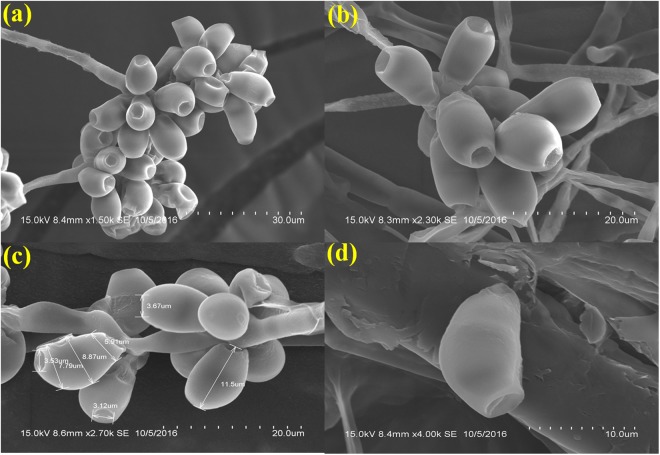
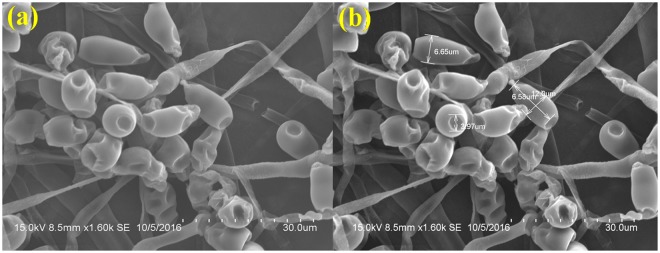
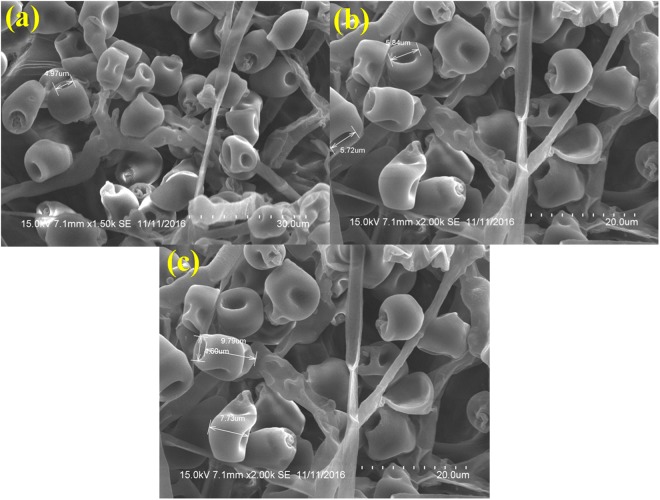
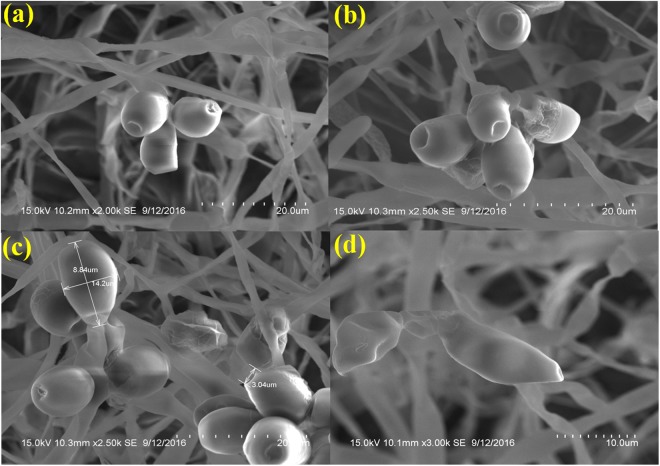
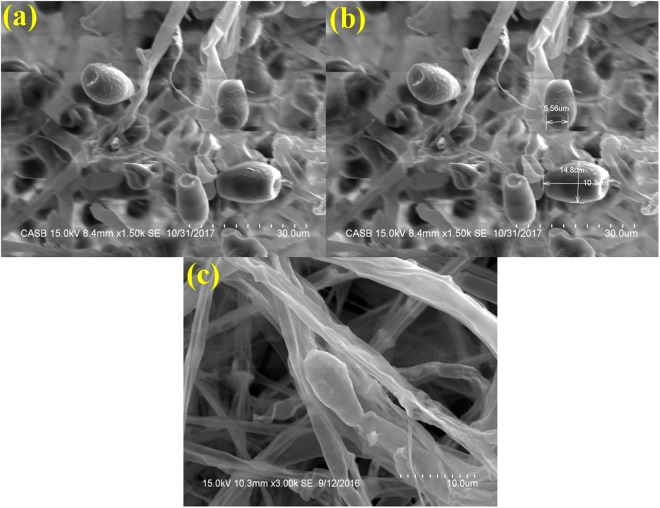
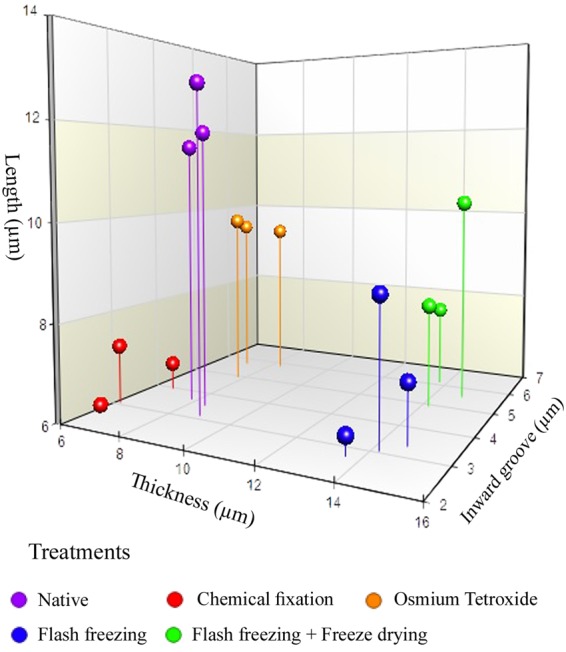
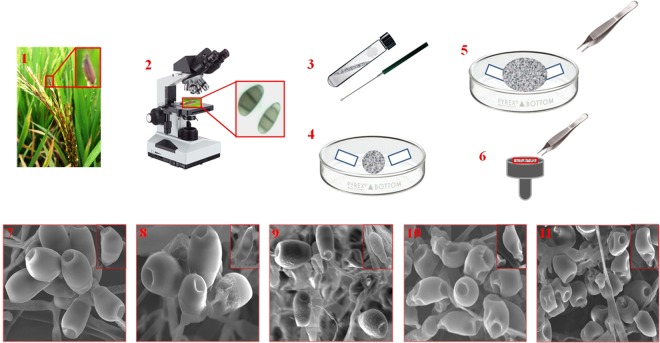
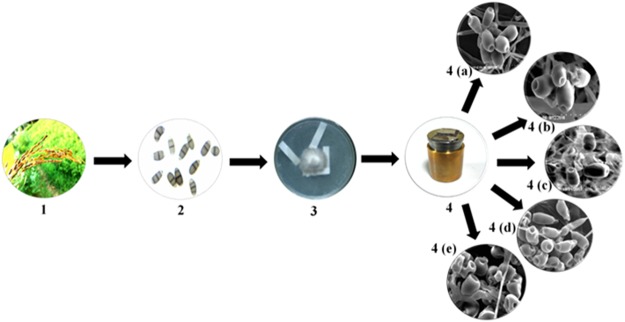
Efficient, fast and new micro-analytical methods for characterization of ultrastructures of fungal spores with electron microscopy are very much required and essential. SEM analysis of biological materials, especially fungi, requires optimal preparation of the specimen and often requires the usage of dried samples which demands a challenging sample preparation. In the present investigation, we described a fast and improved method for the preparation of fungal specimen for scanning electron microscopy (SEM). The fungus, Curvularia lunata was grown on the surface of sterile Whatman No.1 filter paper which was overlaid on Potato Dextrose Agar (PDA) medium, gold coated immediately after removal from the growth medium and subjected to imaging. Generally, SEM imaging is done with samples that were fixed with chemical fixatives, dehydrated and gold coated specimens, but here we describe an easy and more efficient sample preparation for SEM which enabled enhanced image quality and precision visualization of fungal cells, especially the spores. The developed method has enabled the analysis of even the robust samples like fungal spores that to eliminating special temperature requirement. The ultimate goal was to develop an improved protocol/method applied to analysis of fungal spores with greater coverage about fungal specimen preparation. This method permits the use of rapid sample preparation and will allow us to imaging of individual spore or conidia structures in the context of fungal cell architecture which clarifies our understanding in fungal taxonomy/biology.
Conflict of interest statement
The authors declare no competing interests.
Figures
Similar articles
-
High spatial resolution surface imaging and analysis of fungal cells using SEM and AFM.Micron. 2008 Jun;39(4):349-61. doi: 10.1016/j.micron.2007.10.023. Epub 2007 Oct 24. Micron. 2008. PMID: 18068995 Review.
-
High-resolution imaging of the microbial cell surface.J Microbiol. 2016 Nov;54(11):703-708. doi: 10.1007/s12275-016-6348-5. Epub 2016 Oct 29. J Microbiol. 2016. PMID: 27796933 Review.
-
Surface imaging of the filamentous fungus Penicillium simplicissimum growing in a solid-state fermentation system.Micron. 2017 Aug;99:19-25. doi: 10.1016/j.micron.2017.04.001. Epub 2017 Apr 5. Micron. 2017. PMID: 28395187
-
Application of polystyrene disk substrates in cellular cultivation methods: generalized specimen preparation protocol for scanning electron microscopy.J Microsc. 2016 Nov;264(2):189-197. doi: 10.1111/jmi.12429. Epub 2016 May 30. J Microsc. 2016. PMID: 27237089
-
Processing Embryo, Eggshell, and Fungal Culture for Scanning Electron Microscopy.J Vis Exp. 2019 Aug 16;(150). doi: 10.3791/60018. J Vis Exp. 2019. PMID: 31475973
Cited by
-
Exploring the Bioactive Potential of Calostoma insigne, an Endangered Culinary Puffball Mushroom, from Northeastern Thailand.Foods. 2023 Dec 28;13(1):113. doi: 10.3390/foods13010113. Foods. 2023. PMID: 38201139 Free PMC article.
-
Biosynthesis and characterization of silver nanoparticles from Punica granatum (pomegranate) peel waste and its application to inhibit foodborne pathogens.Sci Rep. 2023 Nov 9;13(1):19469. doi: 10.1038/s41598-023-46355-x. Sci Rep. 2023. PMID: 37945578 Free PMC article.
-
Stalk rot species diversity and molecular phylogeny associated with diseased maize in India.World J Microbiol Biotechnol. 2024 Apr 29;40(6):185. doi: 10.1007/s11274-024-03991-3. World J Microbiol Biotechnol. 2024. PMID: 38683236
-
Biological activities and application of Rosmarinus officinalis extract to improve the preservation and microbial qualities of some local meat products.Sci Rep. 2025 Aug 21;15(1):30806. doi: 10.1038/s41598-025-14247-x. Sci Rep. 2025. PMID: 40841413 Free PMC article.
-
Production of Red Pigments by a Newly Isolated Talaromyces aurantiacus Strain with LED Stimulation for Screen Printing.Indian J Microbiol. 2022 Jun;62(2):280-292. doi: 10.1007/s12088-022-01008-x. Epub 2022 Mar 1. Indian J Microbiol. 2022. PMID: 35462713 Free PMC article.
References
-
- Kammers AD, Daly S. Digital Image Correlation under Scanning Electron Microscopy: Methodology and Validation. Exp. Mech. 2013;53:1743–1761. doi: 10.1007/s11340-013-9782-x. - DOI
-
- Smith KCA, Oatley CW. The scanning electron microscope and its fields of application. Br. J. Appl. Phys. 1955;6:391–399. doi: 10.1088/0508-3443/6/11/304. - DOI
-
- Vernon-Parry KD. Scanning electron microscopy: an introduction. III-Vs Rev. 2000;13:40–44.
-
- Pathan AK, Bond J, Gaskin RE. Sample preparation for SEM of plant surfaces. Mater. Today. 2009;12:32–43. doi: 10.1016/S1369-7021(10)70143-7. - DOI
Publication types
MeSH terms
LinkOut - more resources
Full Text Sources
Medical
