. 2018 Dec;25(12):2101-2117.
doi: 10.1038/s41418-018-0229-x. Epub 2018 Nov 2.

Prevention of neuronal apoptosis by astrocytes through thiol-mediated stress response modulation and accelerated recovery from proteotoxic stress

Affiliations

Prevention of neuronal apoptosis by astrocytes through thiol-mediated stress response modulation and accelerated recovery from proteotoxic stress

Simon Gutbier et al. Cell Death Differ. 2018 Dec.

Abstract

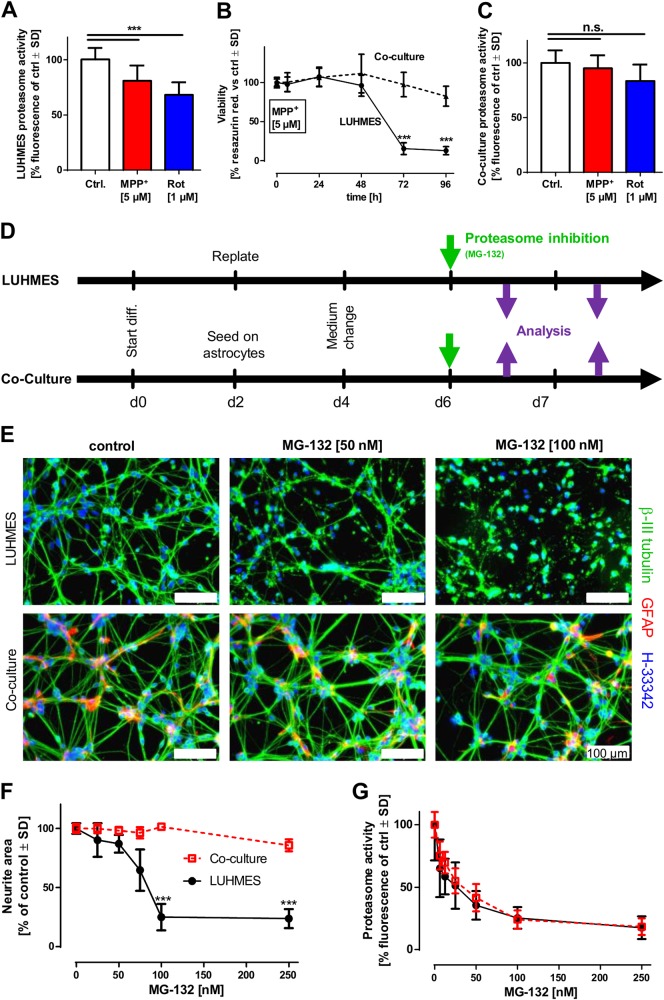
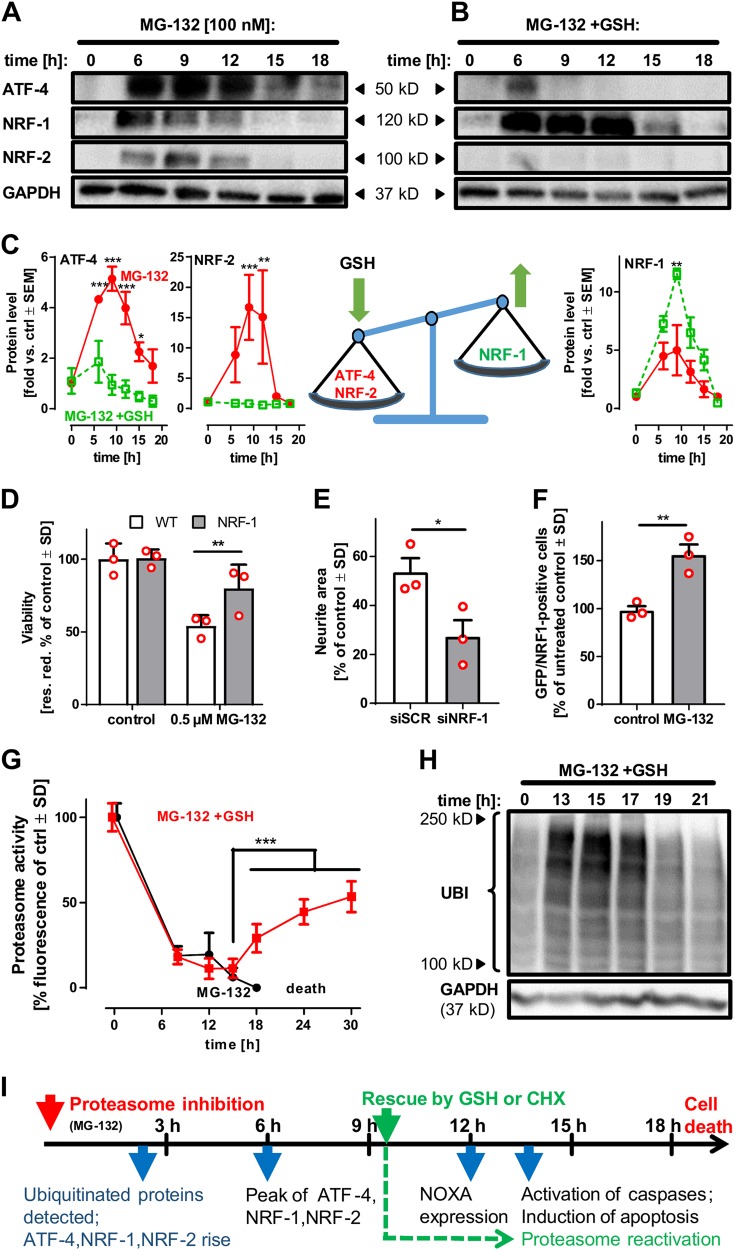
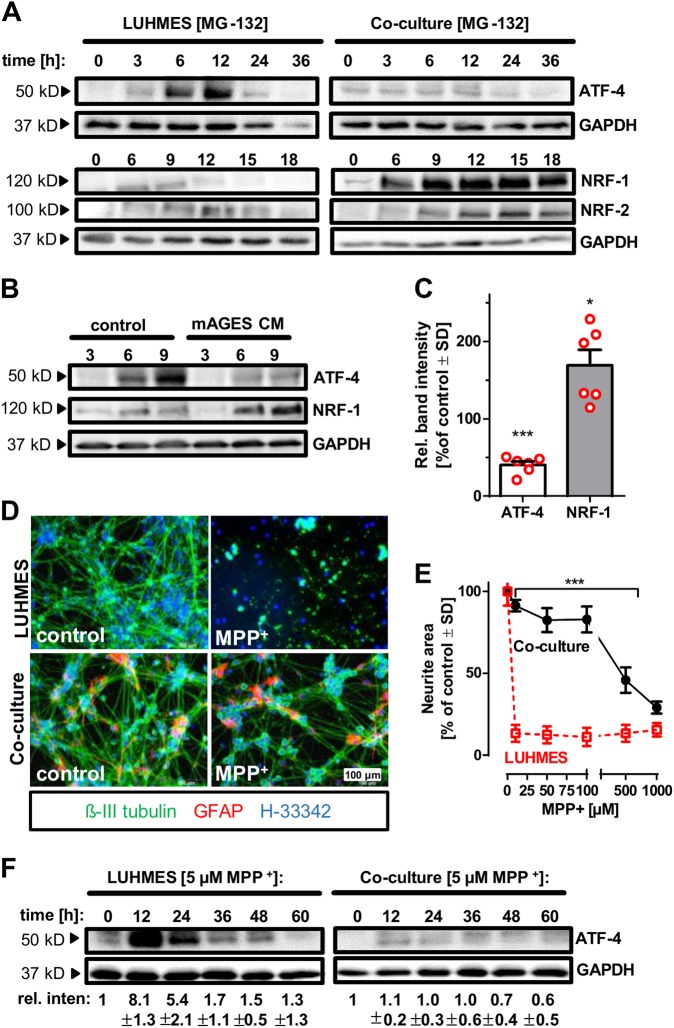
The development of drugs directly interfering with neurodegeneration has proven to be astonishingly difficult. Alternative therapeutic approaches could result from a better understanding of the supportive function of glial cells for stressed neurons. Therefore, here, we investigated the mechanisms involved in the endogenous neuro-defensive activity of astrocytes. A well-established model of postmitotic human dopaminergic neurons (LUHMES cells) was used in the absence ('LUHMES' mono-culture) or presence ('co-culture') of astrocytes. Inhibition of the LUHMES proteasome led to proteotoxic (protein aggregates; ATF-4 induction) and oxidative (GSH-depletion; NRF-2 induction) stress, followed by neuronal apoptosis. The presence of astrocytes attenuated the neuronal stress response, and drastically reduced neurodegeneration. A similar difference between LUHMES mono- and co-cultures was observed, when proteotoxic and oxidative stress was triggered indirectly by inhibitors of mitochondrial function (rotenone, MPP+). Human and murine astrocytes continuously released glutathione (GSH) into the medium, and transfer of glia-conditioned medium was sufficient to rescue LUHMES, unless it was depleted for GSH. Also, direct addition of GSH to LUHMES rescued the neurons from inhibition of the proteasome. Both astrocytes and GSH blunted the neuronal ATF-4 response and similarly upregulated NRF-1/NFE2L1, a transcription factor counter-regulating neuronal proteotoxic stress. Astrocyte co-culture also helped to recover the neurons' ability to degrade aggregated poly-ubiquitinated proteins. Overexpression of NRF-1 attenuated the toxicity of proteasome inhibition, while knockdown increased toxicity. Thus, astrocytic thiol supply increased neuronal resilience to various proteotoxic stressors by simultaneously attenuating cell death-related stress responses, and enhancing the recovery from proteotoxic stress through upregulation of NRF-1.


Conflict of interest statement

The authors declare that they have no conflict of interest.

Figures

Fig. 1
Fig. 1
Increased tolerance to neuronal proteasome inhibition in the presence of astrocytes. a LUHMES cells (d6) were treated with the indicated concentrations of MPP+ or rotenone for 24 h. Proteasome activity was assessed fluorometrically. b LUHMES cells (d6) were treated with MPP+ [5 µM] either in mono- or in co-culture with astrocytes for the indicated time periods. Viability was assessed by measuring resazurin reduction at the indicated time points. c LUHMES astrocyte co-cultures were treated with MPP+ [5 µM] or rotenone [1 µM] for 24 h. Proteasome activity was assessed fluorometrically. d LUHMES cells in mono- and co-culture with astrocytes were differentiated according to the depicted differentiation scheme. LUHMES cells were replated at d-1, and differentiation started by replacing the proliferation medium (PM) with differentiation medium (DM) containing tetracycline, cAMP and GDNF on d0. After 2 days (d2), LUHMES cells were re-plated either as mono-cultures or seeded on top of pre-differentiated astrocytes (mAGES). The medium was exchanged on d4 and 'mature cells' were ready on d6 for toxicant exposure. e LUHMES cells (d6) mono- or co-cultures were exposed to the indicated concentrations of MG-132 for 24 h. Differential toxicity was assessed by immunocytochemistry staining with antibodies against β-III tubulin and GFAP. Nuclei were counterstained with H-33342. f Toxicity of MG-132 on LUHMES mono- and co-cultures was assessed by measuring the neurite integrity after cells were exposed for 24 h to MG-132 at the indicated concentrations. g Proteasomal inhibition by MG-132 in LUHMES mono- and co-cultures was assessed by measuring proteasome activity fluorometrically. For A-F, differences were tested for significance by one-way ANOVA, followed by Dunnett’s post hoc test, n.s.: non-significant, *: p < 0.05, **: p < 0.01, ***: p < 0.001 for comparison of treatments to the respective untreated controls. Data are means ± SD of three independent experiments
Fig. 2
Fig. 2
Formation of protein aggregates and triggering of neuronal apoptosis. a LUHMES cells (d6) were treated with MG-132 [100 nM] for the indicated time periods. After incubation, cells were lysed and analysed by western blot using anti-ubiquitin and anti-GAPDH antibodies. One of two similar data sets is shown. b LUHMES cells (d6) were treated with MG-132 [100 nM] for the indicated time periods. Then, the cells were lysed and analysed by western blot with anti-NRF-1 and anti-GAPDH antibodies. The ratios of NRF-1/GAPDH were quantified densitometrically and normalised to untreated controls (displayed as NRF-1 protein). The lines in red, blue and green show the NNRF-1 levels of three independent experiments. Standard statistics were not displayed, as comparison to the control (without SD) would exaggerate apparent significances, and as the time-series data points are not independent of one another. Use of a repeated connected measures ANOVA with Dunnett’s post hoc test indicates p = 0.02; alternatively, when the values of 6 and 9 h (pooled) were compared to 0 h, by a standard one-sample t test, p was 0.019. c–e Cell death of LUHMES cells following proteasome inhibition by bortezomib, clasto-lactacystin β-lactone (lactacystin) and epoxomicin was monitored. Cells were exposed to the indicated concentrations of the compounds for 24 h. Viability was assessed measuring resazurin reduction and LDH release. Differences were tested for significance by one-way ANOVA, followed by Dunnett’s post hoc test, *: p < 0.05, ***: p < 0.001 for comparison of treatments to untreated control. Data are means ± SD of three independent experiments. f LUHMES cells (d6) were treated with MG-132 [100 nM] for the indicated time periods. After incubation, cells were lysed and analysed by western blot, using anti-PARP and anti-GAPDH antibodies. One of three similar experiments is displayed. g LUHMES cells (d6) were treated with MG-132 [100 nM]; then the nuclear morphology and DNA condensation were visualised by using the DNA intercalating dye H-33342. h LUHMES cells (d6) were treated with MG-132 [100 nM] in the presence or absence of cycloheximide (CHX) [10 µM] or cysteine (Cys) [1 mM] for the indicated time periods. After incubation, cells were lysed and analysed by western blot using anti-NOXA and anti-GAPDH antibodies. Induction of NOXA was quantified densitometrically. Differences were tested for significance by two-way ANOVA (treatment × time), followed by Tukey’s post hoc test, *: p < 0.05, **: p < 0.01, ***: p < 0.001 for the comparison of MG-132 treatment at the given time points to combined treatment with MG-132 with either CHX or Cys. Data are means ± SEM of three independent experiments. i The effect of cycloheximide [10 µM] on neuronal survival following proteasome inhibition was investigated by measuring neurite integrity as a surrogate for viability. Differences were tested for significance by one-way ANOVA, followed by Bonferroni’s post hoc test, ***: p < 0.05 for multiple comparisons. Bars show means ± SD of three independent experiments; black dots show values of all technical replicates run within these experiments
Fig. 3
Fig. 3
Protection by external cysteine from proteotoxic neuronal stress. a LUHMES cells (d6) were treated with MG-132 [100 nM] and the indicated concentrations of L-cysteine for 24 h. Viability was assessed by measuring resazurin reduction and LDH release. Differences were tested for significance by one-way ANOVA followed by Dunnett’s post hoc test, ***: p < 0.001. Data are means ± SD of three independent experiments. b Proteasomal inhibition by MG-132 in the presence or absence of 1 mM L-cysteine was assessed in LUHMES cells by measuring proteasome activity fluorometrically. Data are means ± SD of three independent experiments. c Intracellular cysteine levels of LUHMES cells exposed to MG-132 [100 nM] for 0 or 6 h in the presence or absence of 1 mM extracellular L-cysteine were measured by amino acid analysis. Data are means ± SD of three independent experiments. d LUHMES cells (d6) were treated with MG-132 [100 nM] and L-cysteine [1 mM] for the indicated time periods. After incubation, cells were lysed and analysed by western blot using anti-PARP and anti-GAPDH antibodies (data representative of three experiments). e LUHMES cells (d6) were treated with MG-132 [100 nM] in the presence or absence of 1 mM L-cysteine for 6 h. After incubation, cells were lysed and analysed by western blot using anti-ATF-4 and anti-GAPDH antibodies. ATF-4 induction was quantified densitometrically. Numbers indicate band intensities (means ± SD of three independent experiments, normalized to GAPDH) relative to MG-132-treated samples. f Differentiated d6 LUHMES cells were exposed to MG-132 [100 nM] in the presence or absence of 1 mM L-cysteine. Changes in mRNA levels of the ‘cystine/glutamate transporter (SLC7A11)’ and the ‘DNA damage inducible transcript 3 (CHOP)’ were quantified after the indicated time periods by qPCR. Data are means ± SEM of three independent experiments. Differences in c and f were tested for significance by two-way ANOVA (treatment × time), followed by a Bonferroni post hoc test, *: p < 0.05, **: p < 0.01, ***: p < 0.001 for comparison amongst treatments at the given time points
Fig. 4
Fig. 4
Rescue of neurons from proteasome inhibition by glutathione supply. a, b Intracellular GSH and cysteine levels of LUHMES cells that were exposed to MG-132 [100 nM] for 6 h in the presence or absence of extracellular GSH [1 mM] were measured by amino acid analysis. Differences were tested for significance by one-way ANOVA followed by Bonferroni’s post hoc test, *: p < 0.05, ***: p < 0.001 for comparison of all bars. Data are from ≥ four experiments (individual data shown as red circles). c LUHMES (d6) cells were incubated with MG-132 [100 nM] and the indicated concentrations of GSH for 24 h. Viability was assessed by measuring resazurin reduction and LDH release. Differences were tested for significance by one-way ANOVA followed by Dunnett’s post hoc test, *p < 0.05, ***p < 0.001 for comparison of GSH supplementation to MG-132 single treatment (three independent experiments). d LUHMES (d6) cells were treated with MG-132 [100 nM] and GSH [1 mM] for the indicated time periods. After incubation, cells were lysed and analysed by western blot using anti-PARP and anti-GAPDH antibodies. Representative blots (N = 3 experiments) are shown. PARP*: apoptotically cleaved PARP. e Proteasomal inhibition with the indicated concentrations of MG-132 in the presence or absence of GSH [1 mM] was assessed in LUHMES (d6) cells by measuring the proteasome activity fluorometrically. Data are means ± SD of four independent experiments. f LUHMES cells (d6) were treated with MG-132 [100 nM], and GSH [1 mM] was added at various indicated time points after the start of MG-132 exposure. Viability was assessed using calcein-AM/H-33342 staining at 24 h after the start of the MG-132 exposure. Double-positive cells were counted by automated microscopy and normalised for all H-33342-positive cells. Differences were tested for significance (N = 3 experiments) by one-way ANOVA followed by Dunnett’s post hoc test, ***: p < 0.001 for comparison of samples with GSH added vs MG-132 treatment without GSH (= 24 h data point). g Cells were treated as described in (f) and stained after 24 h of MG-132 treatment with the vital dye calcein-AM and H-33342. Representative pictures for control, MG-132 [100 nM] and cells treated with MG-132 [100 nM] plus GSH (with a time delay of 8 h). h Intracellular GSH levels of cells incubated for 6 h either with standard differentiation medium or astrocyte-conditioned medium were determined by amino acid analysis. Differences were tested for significance by Student’s t test (three independent experiments, indicated as red circles) to compare conditioned medium with standard medium control. i Combined GSH levels of LUHMES (d6) and mAGES mono-cultures, as well as GSH levels of ‘direct-contact co-cultures’. Values were normalised to cell number. Student’s t test: ***: p < 0.001 for comparison of total GSH content in co-cultures with the sum of GSH contents of the mono-cultures. Data are means ± SD of three independent experiments. j GSH levels of LUHMES cells cultured on a cover slip positioned 1 mm above mAGES (non-contact co-cultures) and LUHMES cells cultured alone were measured. *: p < 0.05 according to Student’s t test (three independent experiments, paired samples)
Fig. 5
Fig. 5
Influence of external thiols on the balance between ATF-4, NRF-1 and NRF-2. a, b To address the differences in the neuronal stress response following proteasome inhibition in the absence (a) or presence (b) of GSH [1 mM], cells were treated with MG-132 [100 nM] for the indicated time periods. After incubation, cells were lysed and analysed by western blot using anti-ATF-4, anti-NRF-1, anti-NRF-2 and anti-GAPDH antibodies. c Densitometric quantification of A and B and a schematic depiction of the influence of GSH on the stress response following MG-132 exposure. Differences were tested for significance by two-way ANOVA (treatment × time), followed by a Bonferroni post hoc test, *: p < 0.05, **: p < 0.01, ***: p < 0.001 for comparison amongst treatments at the given time points. Data are fold change vs control ± SEM of three independent experiments. d HEK-293 cells over-expressing NRF-1 and wild-type (WT) cells were incubated for 48 h with MG-132 [0.5 µM]. Viability was assessed by measuring resazurin reduction. Differences were tested for significance by two-way ANOVA (treatment × genotype), followed by a Bonferroni post hoc test, **: p < 0.01. Individual data of the three independent experiments are shown as red circles. e LUHMES cells (d2) were transfected with siRNA against NRF-1 or scrambled siRNA. On day 6 of differentiation, cells were incubated with MG-132 [100 nM], and then GSH [1 mM] was added with a time delay of 7 h. Viability was measured after 24 h, using the vital dye calcein-AM and the DNA stain H-33342. The neurite area of the cell cultures was assessed by automated microscopy. *: p < 0.05 (t test). f LUHMES cells (d2) were transfected with a plasmid driving the expression of NRF-1 and GFP. On d6, cells were treated with MG-132 [100 nM] for 18 h. The viability was assessed by calcein-AM/ H-33342 staining. Double-positive cells were counted by automated microscopy. **: p < 0.01 (t test, with individual data points shown as red circles). g Proteasomal recovery after exposure to MG-132 [100 nM] in the presence or absence of 1 mM GSH was assessed in LUHMES cells (d6) by measuring proteasome activity fluorometrically after the indicated incubation times. At 24 h after exposure to MG-132, proteasomal activity became undetectable in cells treated with MG-132 only (due to the death of the cells). Differences were tested for significance by two-way ANOVA (time × GSH treatment), followed by Dunnett’s post hoc test, ***:p < 0.001 for comparison of the GSH-treated cells at 18, 24 and 30 h (recovery phase) vs the 15-h time point (maximum inhibition as the baseline for recovery). h Cells were treated with MG-132 [100 nM] for the indicated time periods in the presence of GSH [1 mM]. After incubation, cells were lysed and analysed by western blot using anti-ubiquitin (UBI) and anti-GAPDH antibodies (an individual experiment in confirmation of fluorescence data). i Time line of events in neurons following MG-132 exposure. The red arrow indicates the start of MG-132 exposure. The green arrow shows the latest time point for complete rescue by GSH and CHX. The blue arrows indicate events associated with the stress response and cell death
Fig. 6
Fig. 6
Alterations in neuronal stress response and rescue by astrocytes. a LUHMES cells (d6) and LUHMES astrocyte co-cultures were treated with MG-132 [100 nM] for the indicated time periods. After incubation, cells were lysed and analysed by western blot using anti-ATF-4, anti-NRF-1, anti-NRF-2 and anti-GAPDH antibodies (one experiment, representative of two, is shown). b, c LUHMES cells (d6) were incubated with either standard differentiation medium (control) or astrocyte-conditioned medium (mAGES CM), and treated with MG-132 [100 nM] for the indicated time periods. After incubation, cells were lysed and analysed by western blot using anti-ATF-4, anti-NRF-1 and anti-GAPDH antibodies. After densitometric analysis (normalised for GAPDH), the 6  and 9 h bands (pooled data) of NRF-1 and ATF-4 were compared between the media conditions. Differences between normal and conditioned medium (normal set to 100%) are shown (n = 3). Means, error bars, as well as individual data (red circles) are displayed, *: p < 0.05 (Student’s t test, Benjamini-Hochberg-corrected; conditioned vs control medium). d, e Neuronal survival of co- and mono-cultured LUHMES was assessed 72 h after incubation with the indicated concentrations of MPP+. Representative pictures of cells treated with MPP+ [5 µM] are shown in (d) (note: astrocytes indicated in red). Quantification of the neurite area using automated microscopy is shown in (e). Differences were tested for significance by two-way ANOVA, followed by a Tukey post hoc test, ***: p < 0.001 for comparison of co-cultures vs mono-cultures at given MPP+ doses. Data are means ± SD of three independent experiments. f LUHMES cells (d6) and co-cultures were treated with MPP+ [5 µM] for the indicated time periods. After incubation, cells were lysed and analysed by western blot using anti-ATF-4 and anti-GAPDH antibodies. The band intensities from three such experiments were quantified (ATF-4/GAPDH ratios), and the relative band intensities (0 h = 1) are displayed as means ± SD

Similar articles

Cited by

References

    1. Dexter DT, Jenner P. Parkinson disease: from pathology to molecular disease mechanisms. Free Radic Biol Med. 2013;62:132–44. doi: 10.1016/j.freeradbiomed.2013.01.018. - DOI - PubMed
    1. Terron A, Bal-Price A, Paini A, Monnet-Tschudi F, Bennekou SH, Members EWE, et al. An adverse outcome pathway for parkinsonian motor deficits associated with mitochondrial complex I inhibition. Arch Toxicol. 2018;92:41–82. doi: 10.1007/s00204-017-2133-4. - DOI - PMC - PubMed
    1. Blesa J, Przedborski S. Parkinson’s disease: animal models and dopaminergic cell vulnerability. Front Neuroanat. 2014;8:155. doi: 10.3389/fnana.2014.00155. - DOI - PMC - PubMed
    1. Ekstrand MI, Galter D. The MitoPark Mouse - an animal model of Parkinson’s disease with impaired respiratory chain function in dopamine neurons. Park Relat Disord. 2009;15(Suppl 3):S185–188. doi: 10.1016/S1353-8020(09)70811-9. - DOI - PubMed
    1. Langley M, Ghosh A, Charli A, Sarkar S, Ay M, Luo J, et al. Mito-apocynin prevents mitochondrial dysfunction, microglial activation, oxidative damage, and progressive neurodegeneration in MitoPark transgenic mice. Antioxid Redox Signal. 2017;27:1048–66. doi: 10.1089/ars.2016.6905. - DOI - PMC - PubMed

Publication types

MeSH terms