

Left ventricular mechanoenergetics in excised, cross-circulated rat hearts under hypo-, normo-, and hyperthermic conditions
- PMID: 30390094
- PMCID: PMC6214925
- DOI: 10.1038/s41598-018-34666-3
Left ventricular mechanoenergetics in excised, cross-circulated rat hearts under hypo-, normo-, and hyperthermic conditions
Abstract
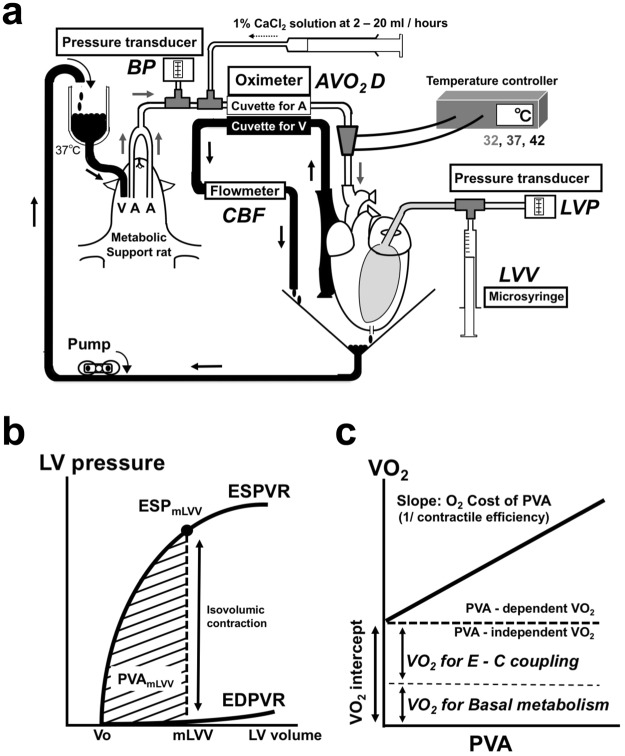
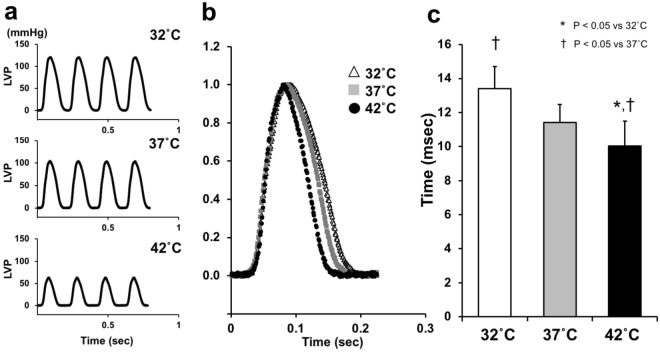
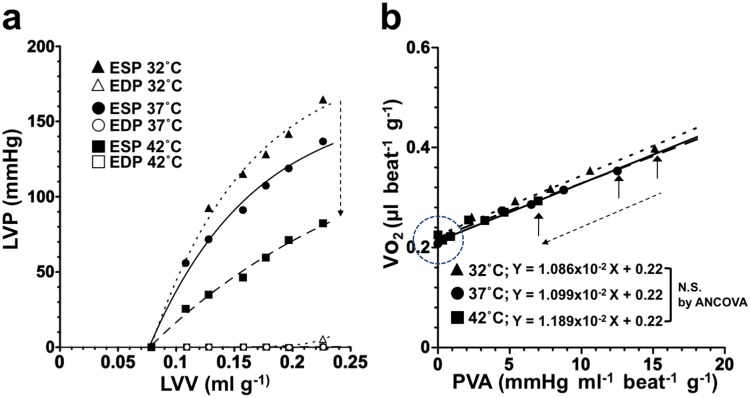
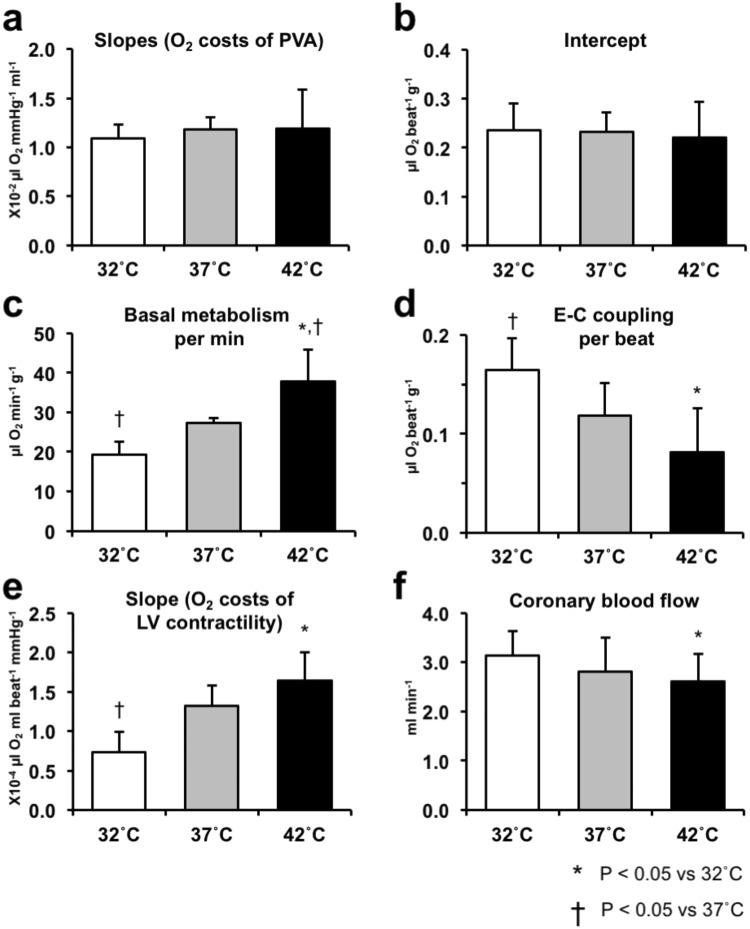
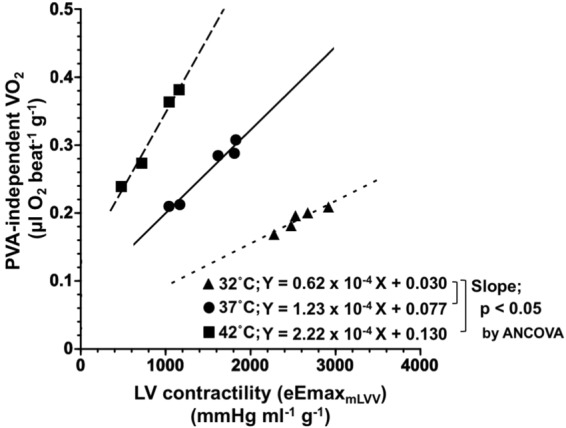
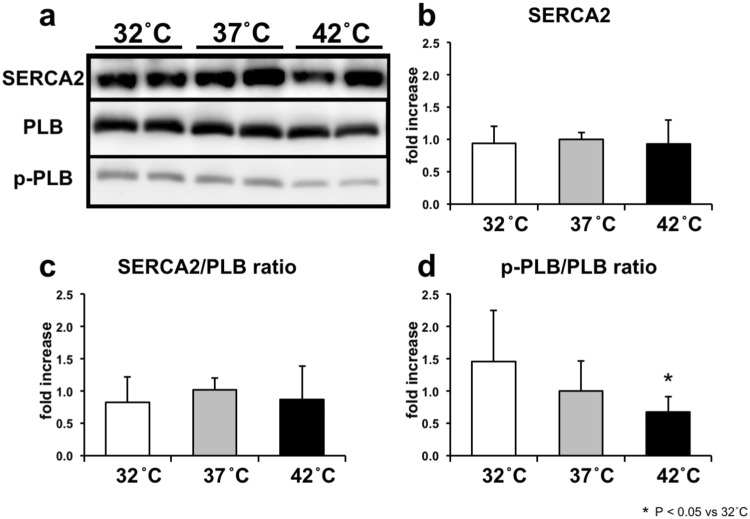
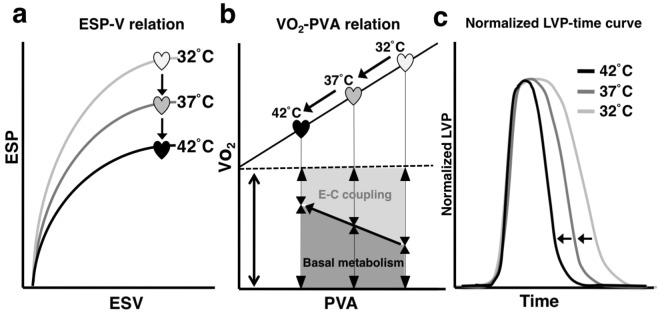
We investigated the effects of altering cardiac temperature on left ventricular (LV) myocardial mechanical work and energetics using the excised, cross-circulated rat heart model. We analyzed the LV end-systolic pressure-volume relationship (ESPVR) and linear relationship between myocardial oxygen consumption per beat (VO2) and systolic pressure-volume area (PVA; total mechanical energy per beat) in isovolumically contracting rat hearts during hypo- (32 °C), normo- (37 °C), and hyperthermia (42 °C) under a 300-beats per minute pacing. LV ESPVR shifted downward with increasing cardiac temperature. The VO2-PVA relationship was superimposable in these different thermal conditions; however, each data point of VO2-PVA shifted left-downward during increasing cardiac temperature on the superimposable VO2-PVA relationship line. VO2 for Ca2+ handling in excitation-contraction coupling decreased, which was associated with increasing cardiac temperature, during which sarcoplasmic reticulum Ca2+-ATPase (SERCA) activity was suppressed, due to phospholamban phosphorylation inhibition, and instead, O2 consumption for basal metabolism was increased. The O2 cost of LV contractility for Ca2+ also increased with increasing cardiac temperature. Logistic time constants evaluating LV relaxation time were significantly shortened with increasing cardiac temperature related to the acceleration of the detachment in cross-bridge (CB) cycling, indicating increased myosin ATPase activity. The results suggested that increasing cardiac temperature induced a negative inotropic action related to SERCA activity suppression in Ca2+ handling and increased myosin ATPase activity in CB cycling. We concluded that thermal intervention could modulate cardiac inotropism by changing CB cycling, Ca2+ handling, and basal metabolism in rat hearts.
Conflict of interest statement
The authors declare no competing interests.
Figures
Similar articles
-
Mechanism underlying the negative inotropic effect in rat left ventricle in hyperthermia: the role of TRPV1.J Physiol Sci. 2020 Feb 5;70(1):4. doi: 10.1186/s12576-020-00734-5. J Physiol Sci. 2020. PMID: 32039693 Free PMC article.
-
The energy-saving effect of a new myosin activator, omecamtiv mecarbil, on LV mechanoenergetics in rat hearts with blood-perfused isovolumic contraction model.Naunyn Schmiedebergs Arch Pharmacol. 2019 Sep;392(9):1065-1070. doi: 10.1007/s00210-019-01685-4. Epub 2019 Jul 2. Naunyn Schmiedebergs Arch Pharmacol. 2019. PMID: 31267148
-
Mechanoenergetics of rat left ventricles in in situ and excised blood-perfused hearts and in unloaded rat left ventricular slices.Heart Vessels. 1997;Suppl 12:100-2. Heart Vessels. 1997. PMID: 9476555
-
Left ventricular mechanoenergetics in small animals.Jpn J Physiol. 2004 Jun;54(3):175-207. doi: 10.2170/jjphysiol.54.175. Jpn J Physiol. 2004. PMID: 15541198 Review.
-
[Energy utility of failing heart].Nihon Yakurigaku Zasshi. 2004 Feb;123(2):77-86. doi: 10.1254/fpj.123.77. Nihon Yakurigaku Zasshi. 2004. PMID: 14745127 Review. Japanese.
Cited by
-
Resolving an inconsistency in the estimation of the energy for excitation of cardiac muscle contraction.Front Physiol. 2023 Oct 3;14:1269900. doi: 10.3389/fphys.2023.1269900. eCollection 2023. Front Physiol. 2023. PMID: 38028799 Free PMC article.
-
Thermal Activation of Thin Filaments in Striated Muscle.Front Physiol. 2020 Apr 16;11:278. doi: 10.3389/fphys.2020.00278. eCollection 2020. Front Physiol. 2020. PMID: 32372968 Free PMC article. Review.
-
Mechanism underlying the negative inotropic effect in rat left ventricle in hyperthermia: the role of TRPV1.J Physiol Sci. 2020 Feb 5;70(1):4. doi: 10.1186/s12576-020-00734-5. J Physiol Sci. 2020. PMID: 32039693 Free PMC article.
-
Thermal modulation of epicardial Ca2+ dynamics uncovers molecular mechanisms of Ca2+ alternans.J Gen Physiol. 2021 Feb 1;153(2):e202012568. doi: 10.1085/jgp.202012568. J Gen Physiol. 2021. PMID: 33410862 Free PMC article.
References
-
- Mackiewicz U, Lewartowski B. Temperature dependent contribution of Ca2+ transporters to relaxation in cardiac myocytes: important role of sarcolemmal Ca2+-ATPase. J Physiol Pharmacol. 2006;57:3–15. - PubMed
Publication types
MeSH terms
LinkOut - more resources
Full Text Sources
Miscellaneous
