

Comparing allele specific expression and local expression quantitative trait loci and the influence of gene expression on complex trait variation in cattle
- PMID: 30390624
- PMCID: PMC6215656
- DOI: 10.1186/s12864-018-5181-0
Comparing allele specific expression and local expression quantitative trait loci and the influence of gene expression on complex trait variation in cattle
Abstract
Background: The mutations changing the expression level of a gene, or expression quantitative trait loci (eQTL), can be identified by testing the association between genetic variants and gene expression in multiple individuals (eQTL mapping), or by comparing the expression of the alleles in a heterozygous individual (allele specific expression or ASE analysis). The aims of the study were to find and compare ASE and local eQTL in 4 bovine RNA-sequencing (RNA-Seq) datasets, validate them in an independent ASE study and investigate if they are associated with complex trait variation.
Results: We present a novel method for distinguishing between ASE driven by polymorphisms in cis and parent of origin effects. We found that single nucleotide polymorphisms (SNPs) driving ASE are also often local eQTL and therefore presumably cis eQTL. These SNPs often, but not always, affect gene expression in multiple tissues and, when they do, the allele increasing expression is usually the same. However, there were systematic differences between ASE and local eQTL and between tissues and breeds. We also found that SNPs significantly associated with gene expression (p < 0.001) were likely to influence some complex traits (p < 0.001), which means that some mutations influence variation in complex traits by changing the expression level of genes.
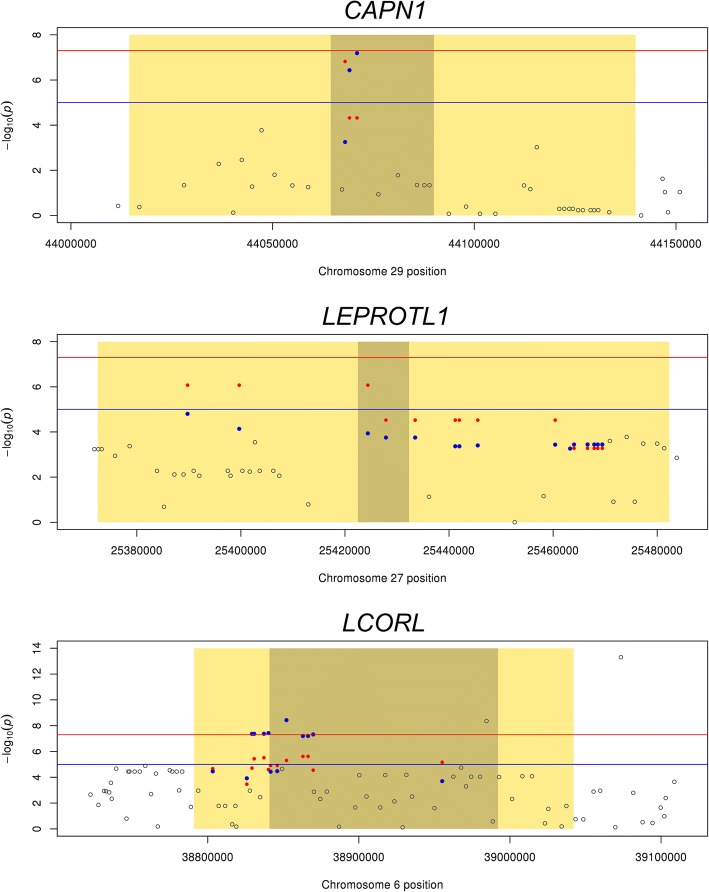
Conclusion: We conclude that ASE detects phenomenon that overlap with local eQTL, but there are also systematic differences between the SNPs discovered by the two methods. Some mutations influencing complex traits are actually eQTL and can be discovered using RNA-Seq including eQTL in the genes CAST, CAPN1, LCORL and LEPROTL1.
Keywords: ASE analysis; Allele specific expression; Genetic variation of complex traits; Genome-wide association study; RNA-sequencing; eQTL mapping.
Conflict of interest statement
Ethics approval and consent to participate
For the Angus bulls, the liver tissue sampling procedure was approved by the University of New England (New South Wales, Australia) Animal Ethics Committee (AEC 06/123) and the muscle biopsy procedure was approved by Orange Animal Ethics Committee (ORA09/015), Orange Agriculture Institute (New South Wales, Australia).
For the Holstein cows, the blood sampling and liver tissue biopsy procedures were approved by The Department of Economic Development, Jobs, Transport and Resources, Animal Ethics Committee; DEDJTR 2011–23, Victoria, Australia.
Consent for publication
Not applicable.
Competing interests
The authors declare that they have no competing interests.
Publisher’s Note
Springer Nature remains neutral with regard to jurisdictional claims in published maps and institutional affiliations.
Figures


Similar articles
-
Powerful identification of cis-regulatory SNPs in human primary monocytes using allele-specific gene expression.PLoS One. 2012;7(12):e52260. doi: 10.1371/journal.pone.0052260. Epub 2012 Dec 26. PLoS One. 2012. PMID: 23300628 Free PMC article.
-
Genome-wide analysis of expression QTL (eQTL) and allele-specific expression (ASE) in pig muscle identifies candidate genes for meat quality traits.Genet Sel Evol. 2020 Oct 9;52(1):59. doi: 10.1186/s12711-020-00579-x. Genet Sel Evol. 2020. PMID: 33036552 Free PMC article.
-
Deciphering the genetic regulation of peripheral blood transcriptome in pigs through expression genome-wide association study and allele-specific expression analysis.BMC Genomics. 2017 Dec 13;18(1):967. doi: 10.1186/s12864-017-4354-6. BMC Genomics. 2017. PMID: 29237423 Free PMC article.
-
Expression Quantitative Trait Loci Information Improves Predictive Modeling of Disease Relevance of Non-Coding Genetic Variation.PLoS One. 2015 Oct 16;10(10):e0140758. doi: 10.1371/journal.pone.0140758. eCollection 2015. PLoS One. 2015. PMID: 26474488 Free PMC article. Review.
-
Genetic association of molecular traits: A help to identify causative variants in complex diseases.Clin Genet. 2018 Mar;93(3):520-532. doi: 10.1111/cge.13187. Clin Genet. 2018. PMID: 29194587 Review.
Cited by
-
Signatures of selection reveal candidate genes involved in economic traits and cold acclimation in five Swedish cattle breeds.Genet Sel Evol. 2020 Sep 4;52(1):52. doi: 10.1186/s12711-020-00571-5. Genet Sel Evol. 2020. PMID: 32887549 Free PMC article.
-
Differential Allele-Specific Expression Revealed Functional Variants and Candidate Genes Related to Meat Quality Traits in B. indicus Muscle.Genes (Basel). 2022 Dec 11;13(12):2336. doi: 10.3390/genes13122336. Genes (Basel). 2022. PMID: 36553605 Free PMC article.
-
An organism-wide ATAC-seq peak catalog for the bovine and its use to identify regulatory variants.Genome Res. 2023 Oct;33(10):1848-1864. doi: 10.1101/gr.277947.123. Epub 2023 Sep 26. Genome Res. 2023. PMID: 37751945 Free PMC article.
-
Whole genome sequencing identified genomic diversity and candidated genes associated with economic traits in Northeasern Merino in China.Front Genet. 2024 Jan 25;15:1302222. doi: 10.3389/fgene.2024.1302222. eCollection 2024. Front Genet. 2024. PMID: 38333624 Free PMC article.
-
Cis-eQTL Analysis and Functional Validation of Candidate Genes for Carcass Yield Traits in Beef Cattle.Int J Mol Sci. 2022 Dec 1;23(23):15055. doi: 10.3390/ijms232315055. Int J Mol Sci. 2022. PMID: 36499383 Free PMC article.
References
MeSH terms
LinkOut - more resources
Full Text Sources
Miscellaneous
