. 2018 Nov 3;18(1):163.
doi: 10.1186/s12862-018-1275-1.

Variable gene transcription underlies phenotypic convergence of hypoxia tolerance in sculpins

Affiliations

Variable gene transcription underlies phenotypic convergence of hypoxia tolerance in sculpins

Milica Mandic et al. BMC Evol Biol. .

Abstract

Background: The degree by which mechanisms underlying phenotypic convergence are similar among taxa depends on the number of evolutionary paths available for selection to act upon. Likelihood of convergence will be influenced by an interplay of factors such as genetic architecture, phylogenetic history and population demography. To determine if there is convergence or divergence in mechanisms underlying phenotypic similarity, we assessed whether gene transcription patterns differed among species with similar levels of hypoxia tolerance.

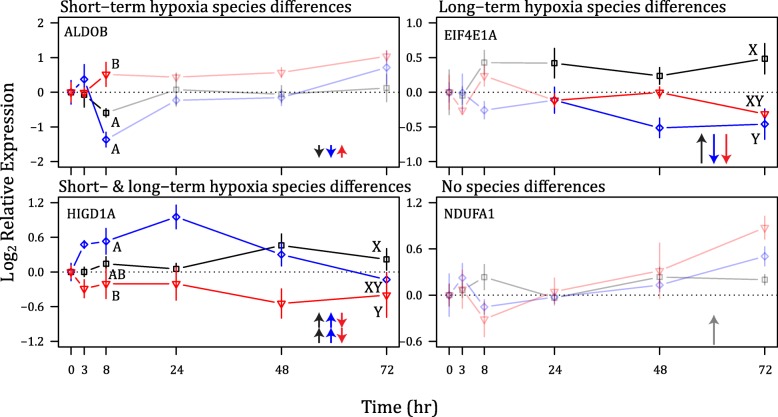
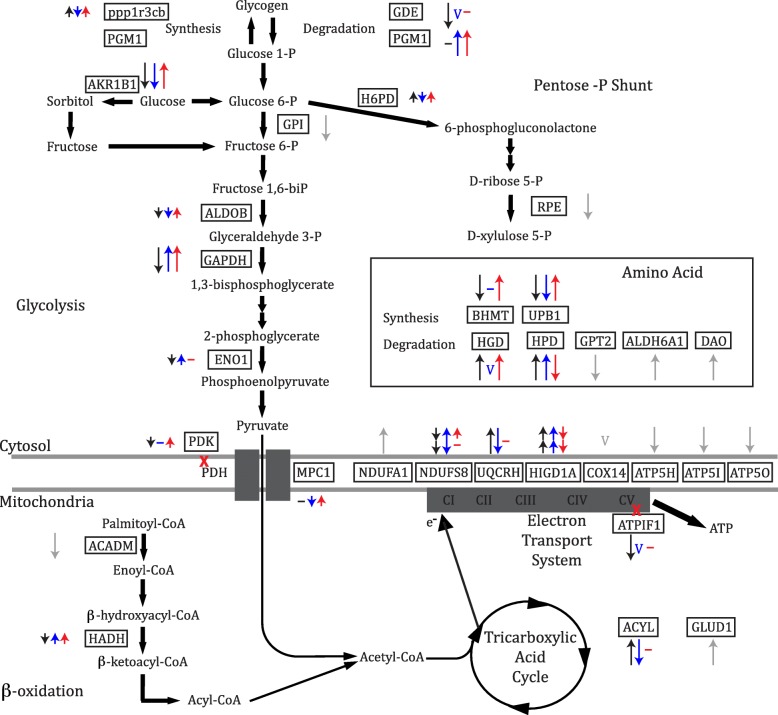
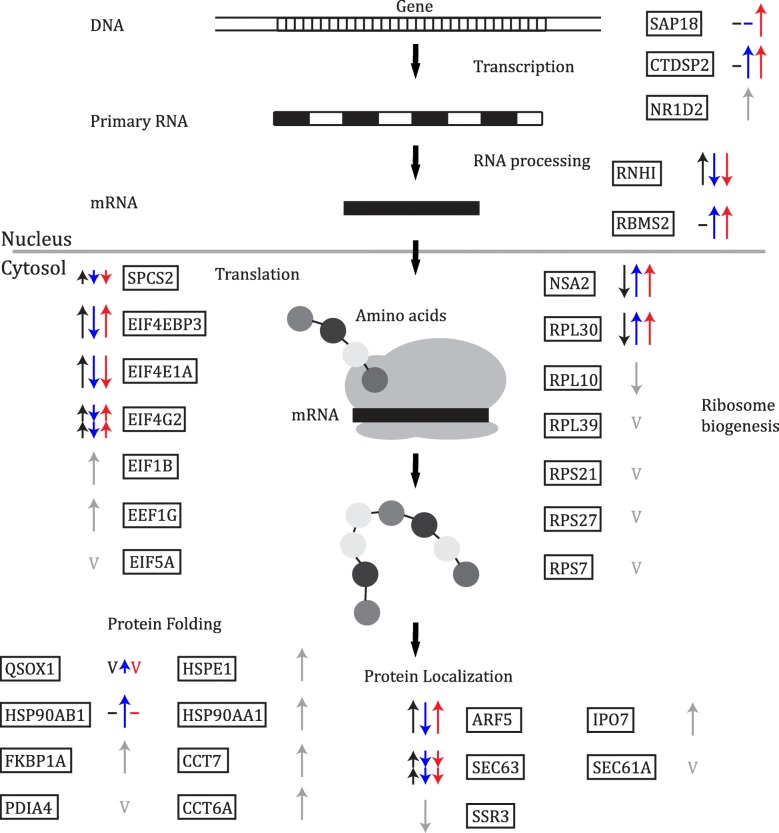
Results: Three species of marine fish from the superfamily Cottoidea (smoothhead sculpin [Artedius lateralis], sailfin sculpin [Nautichthys oculofasciatus] and Pacific staghorn sculpin [Leptocottus armatus]), all of which have previously been shown to share the same level of hypoxia tolerance, were exposed to short-(8 h) and longer-term (72 h) hypoxia and mRNA transcripts were assessed using a custom microarray. We examined hypoxia-induced transcription patterns in metabolic and protein production pathways and found that a high proportion of genes associated with these biological processes showed significant differences among the species. Specifically, the data suggest that the smoothhead sculpin, unlike the sailfin sculpin and the Pacific staghorn sculpin, relied on amino acid degradation rather than glycolysis or fatty acid oxidation to generate ATP during hypoxia exposure. There was also variation across the species in the transcription of genes involved in protein production (e.g. mRNA processing and protein translation), such that it increased in the smoothhead sculpin, decreased in the sailfin sculpin and was variable in the Pacific staghorn sculpin.

Conclusions: Changes in metabolic and protein production pathways are part of the key responses of fishes to exposures to environmental hypoxia. Yet, species with similar overall hypoxia tolerance exhibited different transcriptional responses in these pathways, indicating flexibility and complexity of interactions in the evolution of the mechanisms underlying the hypoxia tolerance phenotype. The variation in the hypoxia-induced transcription of genes across species with similar hypoxia tolerance suggests that similar whole-animal phenotypes can emerge from divergent evolutionary paths that may affect metabolically important functions.

Keywords: Convergent evolution; Fish; Hypoxia; Sculpin; Transcriptomics.


Conflict of interest statement

Ethics approval

Animal collections were approved by Department of Fisheries and Oceans (License XR 143 2010) and Bamfield Marine Sciences Centre animal care committee (AUP RS-11-17) and followed the appropriate guidelines. All experiments were approved by The University of British Columbia animal care committee (A09–0611).

Consent for publication

Not applicable.

Competing interests

The authors declare that they have no competing interests.

Publisher’s Note

Springer Nature remains neutral with regard to jurisdictional claims in published maps and institutional affiliations.

Figures

Fig. 1
Fig. 1
Transcript levels of a representative gene for each category of the transcription response. Smoothhead sculpin (black line, square symbol), sailfin sculpin (blue line, diamond symbol) and Pacific staghorn sculpin (red line, inverted triangle symbol) were exposed to 72 h of hypoxia. Opaque lines represent the portion of the time-course that is different among the species, while transparent lines represent the portion of the time-course for which transcription does not differ among the species. Letters represent significant difference in transcript levels between species (A-B represent difference in the short term hypoxia and X-Y represent differences in the long term hypoxia). Full gene names are as follows: fructose-bisphosphate aldolase B (ALDOB), eukaryotic translation initiation factor 4E-1A (EIF4E1A), HIG1 domain family member 1A (HIGD1A) and NADH dehydrogenase 1 alpha subcomplex subunit 1 (NDUFA1)
Fig. 2
Fig. 2
Schematic representation of genes associated with metabolism. Arrows represent gene transcription changes in response to hypoxia in the smoothhead sculpin (black), sailfin sculpin (blue) and Pacific staghorn sculpin (red). Gray arrows represent genes with similar transcription patterns among the species. Short arrows indicate transcription patterns during short-term hypoxia, long arrows indicate transcription patterns during long-term hypoxia, double arrows indicate transcription patterns during short- and long-term hypoxia, a horizontal line indicates no change from normoxia and the letter ‘v’ represents a variable response. Full names for each gene abbreviation as well as complete transcription profiles of the genes are found in Additional files 2, 4 and 5 (Figures S2, S4-S5).
Fig. 3
Fig. 3
Schematic representation of genes associated with protein production, localization and folding. Arrows represent gene transcription changes in response to hypoxia in the smoothhead sculpin (black), sailfin sculpin (blue) and Pacific staghorn sculpin (red). Gray arrows represent genes with similar transcription patterns among the species. Short arrows indicate transcription patterns during short-term hypoxia, long arrows indicate transcription patterns during long-term hypoxia, double arrows indicate transcription patterns during short- and long-term hypoxia, a horizontal line indicates no change from normoxia and the letter ‘v’ represents a variable response. See Additional files 3, 4 and 5 (Figures S3-S5) for full gene names and complete transcription profiles of the genes

References

    1. Chevin L-M, Martin G, Lenormand T. Fisher’s model and the genomics of adaptation: restricted pleiotropy, heterogenous mutation, and parallel evolution. Evolution. 2010;64:3213–3231. doi: 10.1111/j.1558-5646.2010.01058.x. - DOI - PubMed
    1. Christin P-A, Weinreich DM, Besnard G. Causes and evolutionary significance of genetic convergence. Trends Genet. 2010;26:400–405. doi: 10.1016/j.tig.2010.06.005. - DOI - PubMed
    1. Losos JB. Convergence, adaptation, and constraint. Evolution. 2011;65:1827–1840. doi: 10.1111/j.1558-5646.2011.01289.x. - DOI - PubMed
    1. Hoekstra HE, Hirschmann RJ, Bundey RA, Insel PA, Crossland JP. A single amino acid mutation contributes to adaptive beach mouse color pattern. Science. 2006;313:101–104. doi: 10.1126/science.1126121. - DOI - PubMed
    1. Gross JB, Borowsky R, Tabin CJ. A novel role for Mc1r in the parallel evolution of depigmentation in independent populations of the cavefish Astyanax mexicanus. PLoS Genet. 2009;5:e1000326. doi: 10.1371/journal.pgen.1000326. - DOI - PMC - PubMed

Publication types

LinkOut - more resources