. 2018 Nov 3;19(1):795.
doi: 10.1186/s12864-018-5186-8.

Transcriptome analysis of Xenopus orofacial tissues deficient in retinoic acid receptor function

Affiliations

Transcriptome analysis of Xenopus orofacial tissues deficient in retinoic acid receptor function

Stacey E Wahl et al. BMC Genomics. .

Abstract

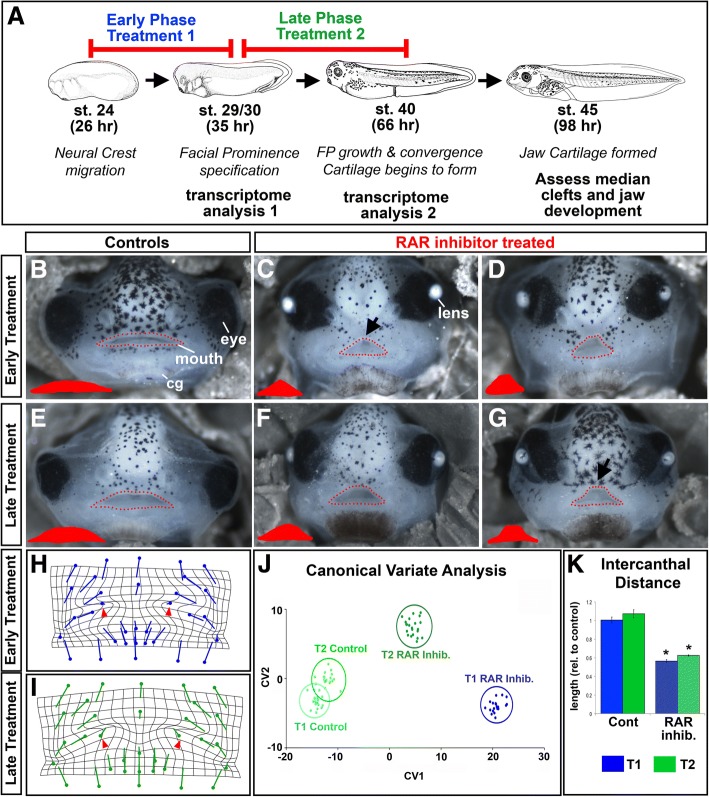
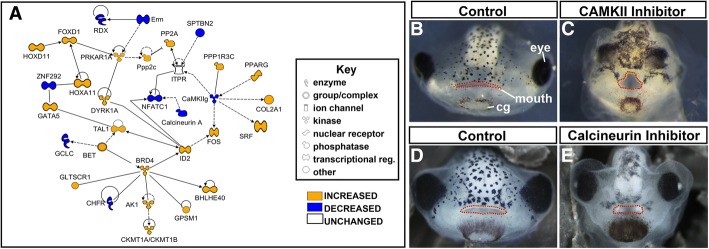
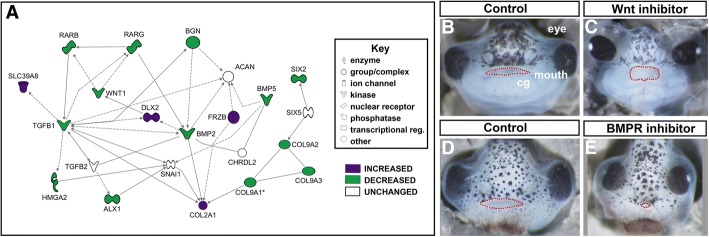
Background: Development of the face and mouth is orchestrated by a large number of transcription factors, signaling pathways and epigenetic regulators. While we know many of these regulators, our understanding of how they interact with each other and implement changes in gene expression during orofacial development is still in its infancy. Therefore, this study focuses on uncovering potential cooperation between transcriptional regulators and one important signaling pathway, retinoic acid, during development of the midface.

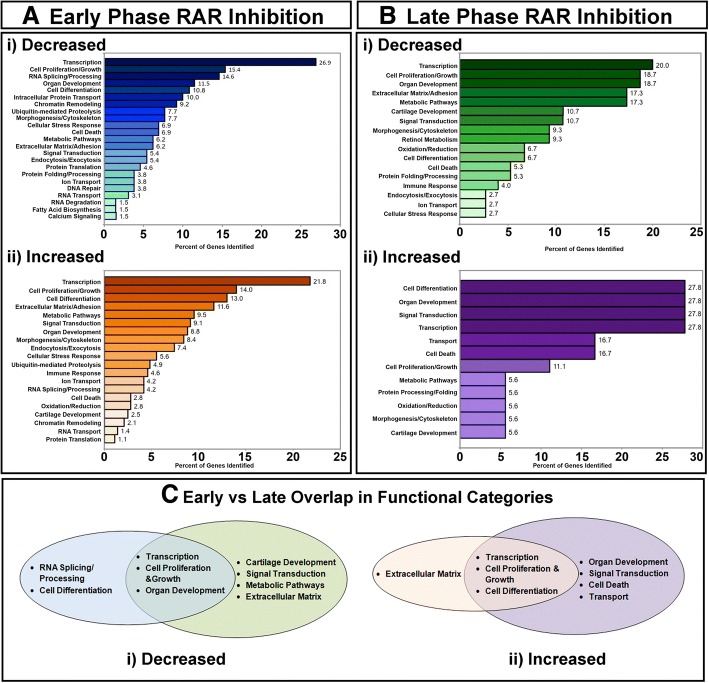
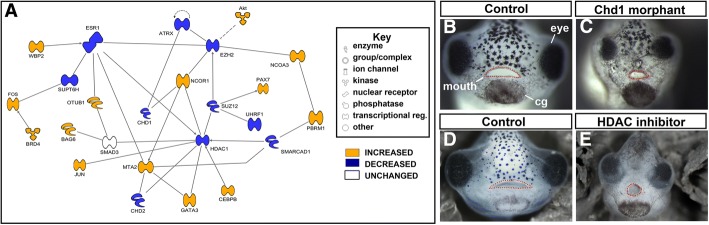
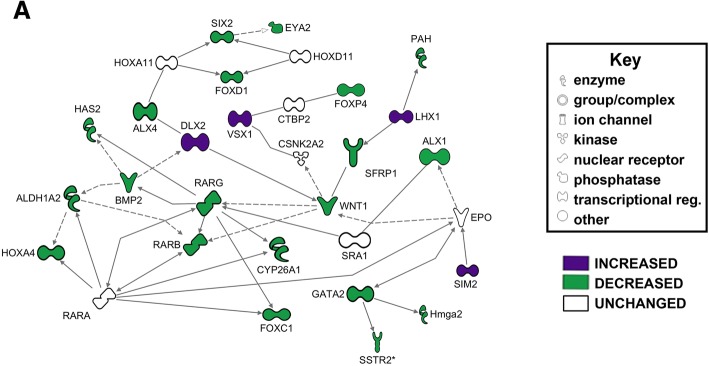
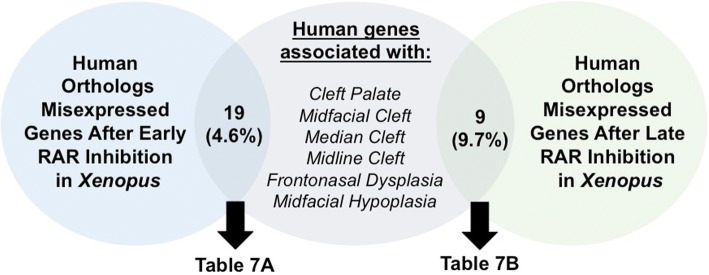
Results: Transcriptome analyses was performed on facial tissues deficient for retinoic acid receptor function at two time points in development; early (35 hpf) just after the neural crest migrates and facial tissues are specified and later (60 hpf) when the mouth has formed and facial structures begin to differentiate. Functional and network analyses revealed that retinoic acid signaling could cooperate with novel epigenetic factors and calcium-NFAT signaling during early orofacial development. At the later stage, retinoic acid may work with WNT and BMP and regulate homeobox containing transcription factors. Finally, there is an overlap in genes dysregulated in Xenopus embryos with median clefts with human genes associated with similar orofacial defects.

Conclusions: This study uncovers novel signaling pathways required for orofacial development as well as pathways that could interact with retinoic acid signaling during the formation of the face. We show that frog faces are an important tool for studying orofacial development and birth defects.

Keywords: Cleft palate; Orofacial development; Retinoic acid; Transcriptomics; Xenopus laevis.


Conflict of interest statement

Ethics approval and consent to participate

All procedures using animals were approved by the VCU Institutional Animal Care and Use Committee (IACUC protocol number 5 AD20261).

Consent for publication

Not applicable to this study.

Competing interests

The authors declare that they have no competing interests.

Publisher’s Note

Springer Nature remains neutral with regard to jurisdictional claims in published maps and institutional affiliations.

Figures

Fig. 1
Fig. 1
RAR Inhibition during early and late orofacial development. a Schematic of the RAR inhibitor treatment paradigm. b-g Representative images of frontal views of stage 43 (87–92 hpf) embryos. The mouths are outlined in red dots and the shape of the mouth is shown in red in the left corners. b) Embryos treated with 1% DMSO from stage 24 to stage 29/30 (26–35 hpf). c,d Two different embryos treated from stage 24 to stage 29/30 (26–35 hpf) with 1 uM RAR Inhibitor. Black arrow indicates a triangular shaped mouth e Embryos treated with 1% DMSO from stage 29/30 to stage 40 (35–66 hpf). f,g Two different embryos treated with 1 uM RAR Inhibitor from stage 29/30 to stage 40 (35–66 hpf). Black arrow indicates a mouth shape with a flat dorsal aspect at the midline h-i Transformation grids exhibiting changes in orofacial landmarks during early (h) and late (i) RAR Inhibition. Flat end of the vector represents average position of control landmark; closed circle represents average position of landmark in treated embryos. j CVA analysis scatter plot. k Intercanthal distance relative to control. For all experiments n = 22/treatment, 2 biological replicates
Fig. 2
Fig. 2
Functional classification of altered genes with RAR inhibition. (a). Functional categories of genes decreased (i) or increased (ii) after early RAR inhibition. (b). Functional categories of genes decreased (i) or increased (ii) after late RAR inhibition. For all graphs: numbers represent the percent of genes identified. (ci-ii): Venn diagrams representing the overlap between decreased genes (i) and increased genes (ii) in early and late RAR inhibition. Blue and orange represent functional categories altered with early RAR inhibition; green and purple represent functional categories altered with late RAR inhibition
Fig. 3
Fig. 3
Transcription regulation was altered in early RAR inhibition. a Functional network built in IPA software, utilizing DAVID pathway analysis. Blue genes are decreased relative to control; orange genes are increased relative to control. Legend denotes the type of gene product represented in the network. b-c Representative images of Control (b) and CHD1 morphants (c). Facial structures are labeled in b. d-e Representative images of Control (1% DMSO, d) and TSA treated embryos (e). In all representative images the mouth is outlined in red dots
Fig. 4
Fig. 4
Transcription regulation was largely decreased in late RAR inhibition. Functional network build in IPA software, utilizing IPA and DAVID pathway analysis. Green genes are decreased relative to control; purple genes are increased relative to control. Key denotes the type of gene product represented in the network
Fig. 5
Fig. 5
Calcium signaling in Organ Development and Differentiation were altered with early RAR inhibition. a Functional network built in IPA software utilizing IPA and DAVID pathway analysis. Blue genes are decreased relative to control; orange genes are increased relative to control. Key denotes type of gene product represented in diagram. b-c Representative images of control (b, 1% DMSO) and CAMKII inhibitor treated embryos (c, 100 μM KN93). d-e Representative images of control (1% DMSO, d) or calcineurin inhibitor treated embryos (e, 100 μM FK506). Mouths are outlined in red dots
Fig. 6
Fig. 6
Wnt and BMP signaling were altered with late RAR inhibition. a Functional network built in IPA software utilizing IPA and DAVID functional analyses. Green genes are decreased and purple genes are increased relative to control. Key denotes type of gene product represented in diagram. b-c Representative images of control (b, 1% DMSO) and Wnt inhibitor treated embryos (c, IWR-1 10 μM). d-e Representative images of control (d, 1% DMSO) and BMPR Inhibitor (e, LDN193189, 100 μM). Mouths are outlined in red dots
Fig. 7
Fig. 7
Overlap of altered gene expression in RAR deficient face and human orofacial defects. Venn diagram exhibiting the overlap among genes altered in our treatment paradigm in Xenopus and human median orofacial defects. Blue circle: total number of Xenopus genes with human orthologs (415) that were significantly altered with early RAR inhibition. Green circle: total number of Xenopus genes with human orthologs (93) that were significantly altered with late RAR inhibition. Grey circle: Human genes associated with one of the six craniofacial defects listed (325 total). Overlap of circles denotes genes that appeared in both lists

Similar articles

Cited by

References

    1. Suzuki A, Sangani DR, Ansari A, Iwata J. Molecular mechanisms of midfacial developmental defects. Dev Dyn. 2016;245(3):276–293. doi: 10.1002/dvdy.24368. - DOI - PMC - PubMed
    1. Dubey Aditi, Rose Rebecca E., Jones Drew R., Saint-Jeannet Jean-Pierre. Generating retinoic acid gradients by local degradation during craniofacial development: One cell's cue is another cell's poison. genesis. 2018;56(2):e23091. doi: 10.1002/dvg.23091. - DOI - PMC - PubMed
    1. Chen Justin, Jacox Laura A., Saldanha Francesca, Sive Hazel. Mouth development. Wiley Interdisciplinary Reviews: Developmental Biology. 2017;6(5):e275. doi: 10.1002/wdev.275. - DOI - PMC - PubMed
    1. Szabo-Rogers HL, Smithers LE, Yakob W, Liu KJ. New directions in craniofacial morphogenesis. Dev Biol. 2010;341(1):84–94. doi: 10.1016/j.ydbio.2009.11.021. - DOI - PubMed
    1. Helms JA, Cordero D, Tapadia MD. New insights into craniofacial morphogenesis. Development. 2005;132(5):851–861. doi: 10.1242/dev.01705. - DOI - PubMed

MeSH terms