

Changes in the liver transcriptome of farmed Atlantic salmon (Salmo salar) fed experimental diets based on terrestrial alternatives to fish meal and fish oil
- PMID: 30390635
- PMCID: PMC6215684
- DOI: 10.1186/s12864-018-5188-6
Changes in the liver transcriptome of farmed Atlantic salmon (Salmo salar) fed experimental diets based on terrestrial alternatives to fish meal and fish oil
Abstract
Background: Dependence on marine natural resources threatens the sustainability of Atlantic salmon aquaculture. In the present study, Atlantic salmon fed for 14 weeks with an experimental diet based on animal by-products and vegetable oil (ABP) exhibited reduced growth performance compared with others fed a fish meal/fish oil based experimental diet (MAR) and a plant protein/vegetable oil-based experimental diet (VEG). To characterize the molecular changes underlying the differences in growth performance, we conducted a 44 K microarray study of the liver transcriptome of the three dietary groups.
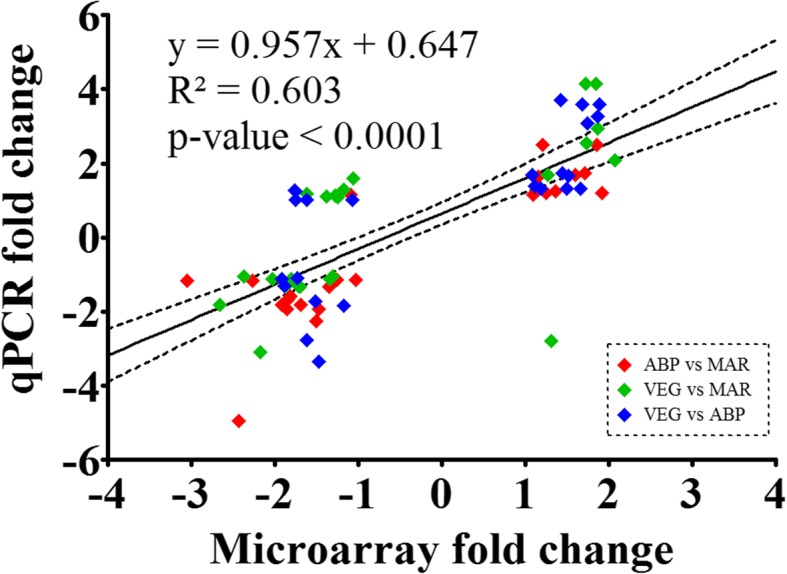
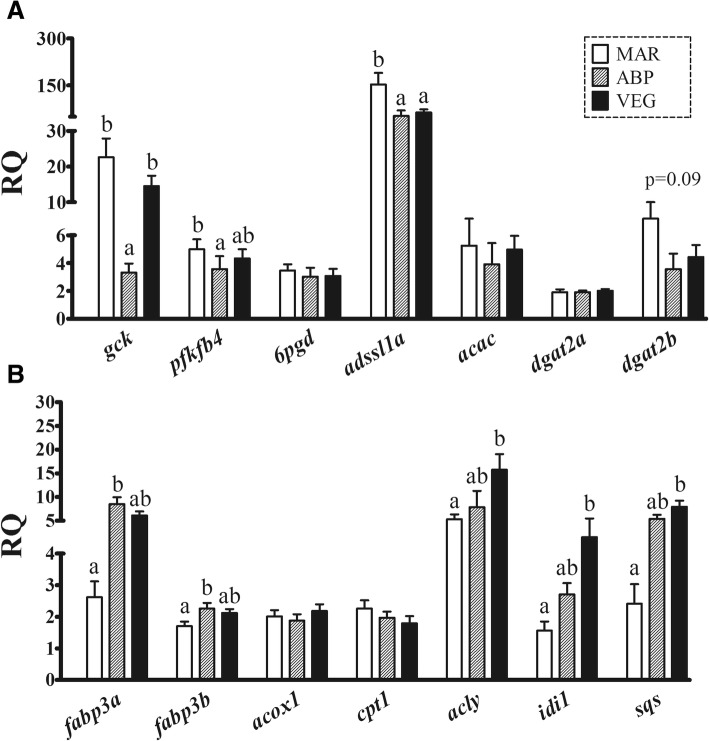
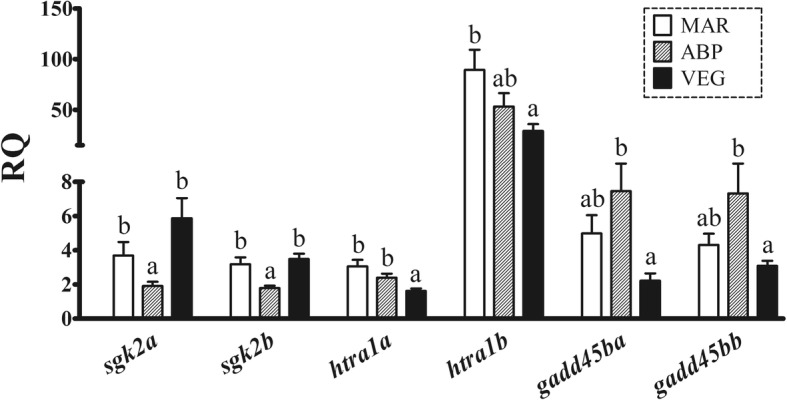
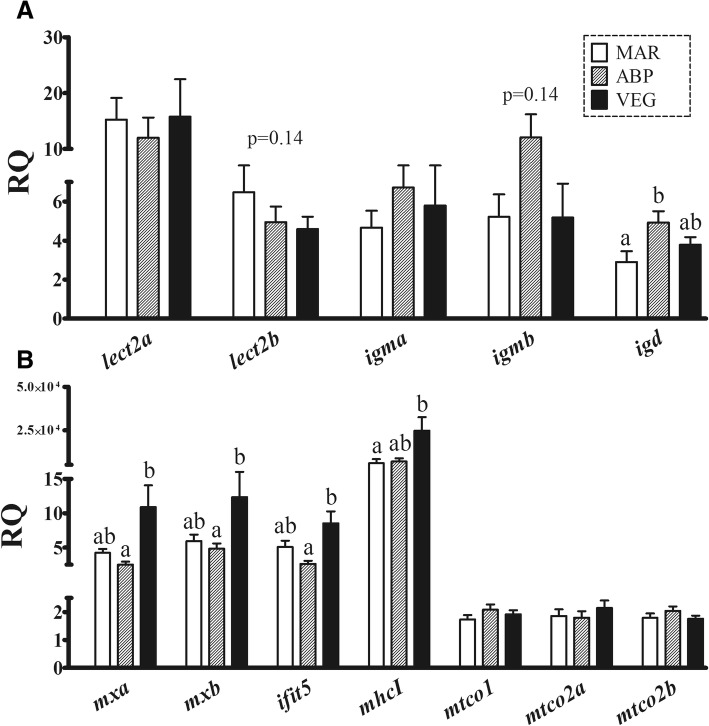
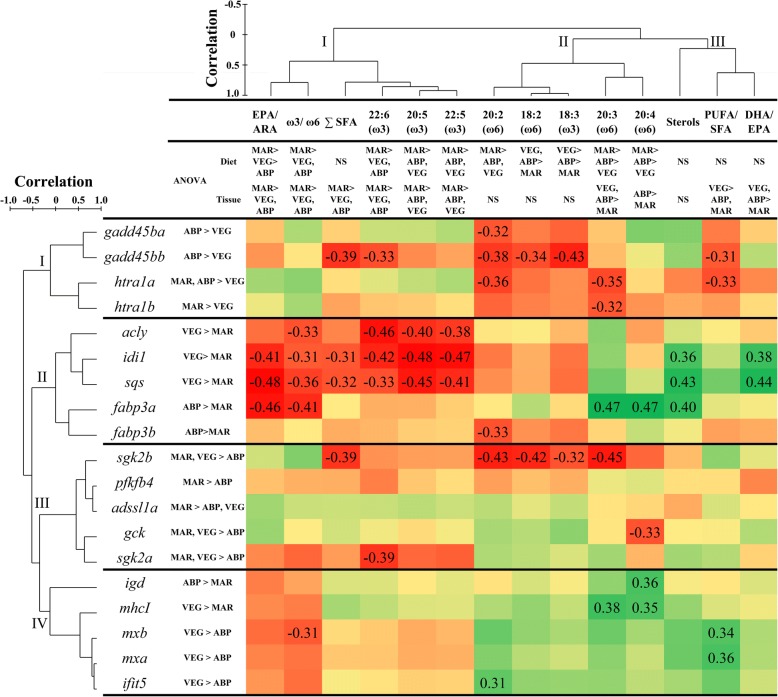
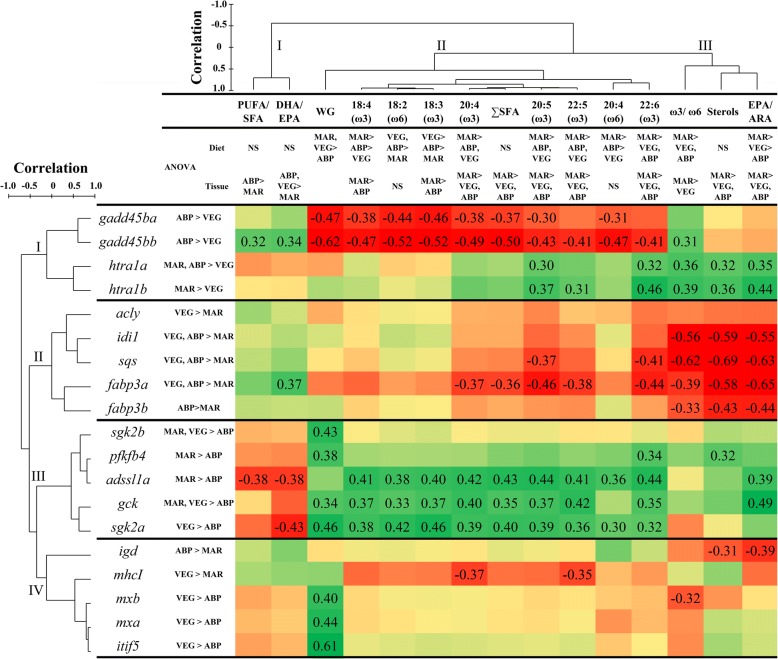
Results: The microarray experiment identified 122 differentially expressed features (Rank Products, PFP < 10%). Based on their associated Gene Ontology terms, 46 probes were classified as metabolic and growth-relevant genes, 25 as immune-related, and 12 as related to oxidation-reduction processes. The microarray results were validated by qPCR analysis of 29 microarray-identified transcripts. Diets significantly modulated the transcription of genes involved in carbohydrate metabolism (gck and pfkfb4), cell growth and proliferation (sgk2 and htra1), apoptosis (gadd45b), lipid metabolism (fabp3, idi1, sqs), and immunity (igd, mx, ifit5, and mhcI). Hierarchical clustering and linear correlation analyses were performed to find gene expression patterns among the qPCR-analyzed transcripts, and connections between them and muscle and liver lipid composition. Overall, our results indicate that changes in the liver transcriptome and tissue lipid composition were driven by cholesterol synthesis up-regulation by ABP and VEG diets, and the lower carbohydrate intake in the ABP group. Two of the microarray-identified genes (sgk2 and htra1) might be key to explaining glucose metabolism regulation and the dietary-modulation of the immune system in fish. To evaluate the potential of these genes as predictive biomarkers, we subjected the qPCR data to a stepwise discriminant analysis. Three sets of no more than four genes were found to be able to predict, with high accuracy (67-94%), salmon growth and fatty acid composition.
Conclusions: This study provides new findings on the impact of terrestrial animal and plant products on the nutrition and health of farmed Atlantic salmon, and a new method based on gene biomarkers for potentially predicting desired phenotypes, which could help formulate superior feeds for the Atlantic salmon aquaculture industry.
Keywords: Aquaculture; Atlantic salmon; Cholesterol; Lipid composition; Liver transcriptome; Marine ingredients; Microarray; Nutrigenomics; Predictive biomarkers; Terrestrial ingredients.
Conflict of interest statement
Ethics approval
All procedures involving fish handling, treatment, euthanasia, and dissection were performed in accordance with the guidelines of the Canadian Council of Animal Care (approved Memorial University Institutional Animal Care Protocol 14–71-MR).
Consent for publication
Not applicable.
Competing interests
RGT is employed by Cargill Innovation, one of the funders of this study. The experimental diets used in the present study were formulated and manufactured by Cargill Innovation (formerly EWOS Innovation). The authors declare that they have no competing interests.
Publisher’s Note
Springer Nature remains neutral with regard to jurisdictional claims in published maps and institutional affiliations.
Figures
References
-
- FAO . The state of world fisheries and aquaculture 2016: contributing to food security and nutrition for all. Rome: Food and Agriculture Organization of the United Nations; 2016.
-
- Hixson SM. Fish nutrition and current issues in aquaculture: the balance in providing safe and nutritious seafood, in an environmentally sustainable manner. J Aquac Res Dev. 2014;5(3):1.
-
- Jobling M. Fish nutrition research: past, present and future. Aquacult Int. 2016;24(3):767–786. doi: 10.1007/s10499-014-9875-2. - DOI
-
- Leaver MJ, Bautista JM, Björnsson BT, Jönsson E, Krey G, Tocher DR, Torstensen BE. Towards fish lipid nutrigenomics: current state and prospects for fin-fish aquaculture. Rev Fish Sci. 2008;16(sup1):73–94. doi: 10.1080/10641260802325278. - DOI
MeSH terms
Substances
Grants and funding
LinkOut - more resources
Full Text Sources
Molecular Biology Databases
Miscellaneous
