

Developing transformative capacity through systematic assessments and visualization of urban climate transitions
- PMID: 30392034
- PMCID: PMC6462282
- DOI: 10.1007/s13280-018-1109-9
Developing transformative capacity through systematic assessments and visualization of urban climate transitions
Abstract
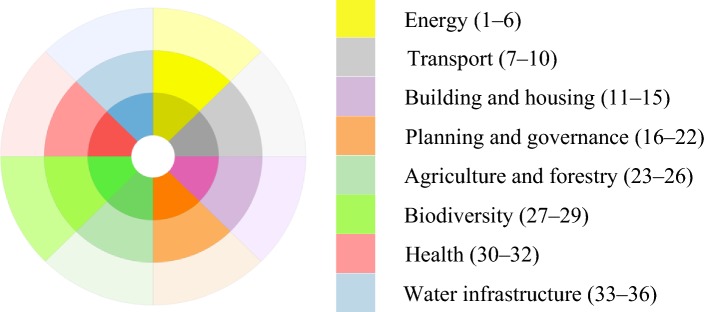
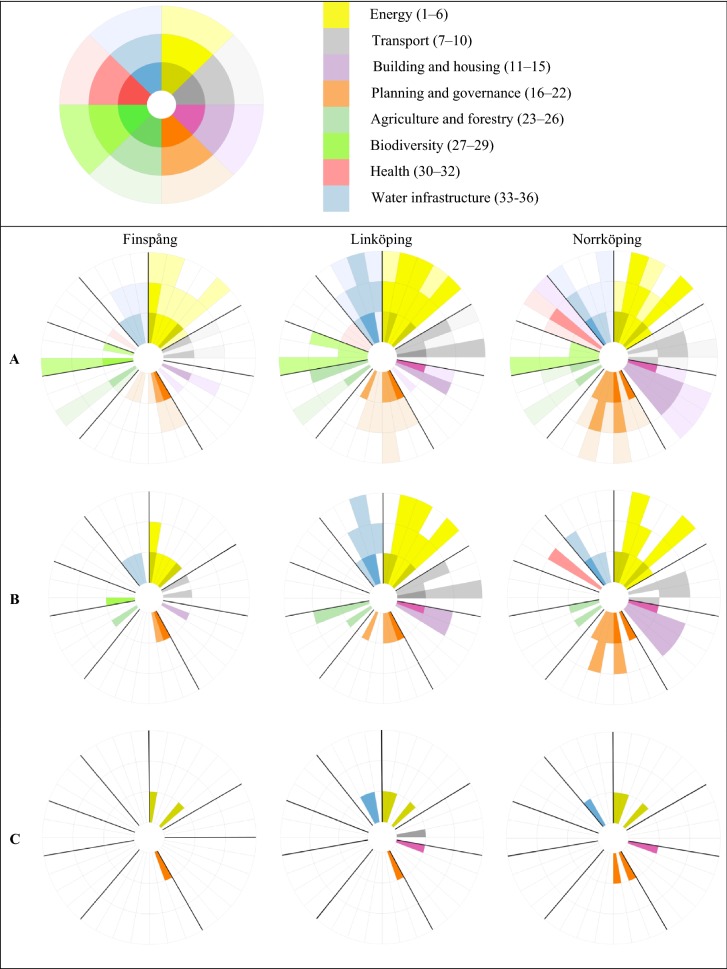
Transforming cities into low-carbon, resilient, and sustainable places will require action encompassing most segments of society. However, local governments struggle to overview and assess all ongoing climate activities in a city, constraining well-informed decision-making and transformative capacity. This paper proposes and tests an assessment framework developed to visualize the implementation of urban climate transition (UCT). Integrating key transition activities and process progression, the framework was applied to three Swedish cities. Climate coordinators and municipal councillors evaluated the visual UCT representations. Results indicate that their understanding of UCT actions and implementation bottlenecks became clearer, making transition more governable. To facilitate UCT, involving external actors and shifting priorities between areas were found to be key. The visual UCT representations improved system awareness and memory, building local transformative capacity. The study recommends systematic assessment and visualization of process progression as a promising method to facilitate UCT governance, but potentially also broader sustainability transitions.
Keywords: Assessment; Climate change; Governance; Transformative capacity; Urban Climate Transition; Visualization.
Figures
References
-
- Al-Kassab J, Ouertani ZM, Schiuma G, Neely A. Information visualization to support management decisions. International Journal of Information Technology and Decision Making. 2014;13:407–428. doi: 10.1142/S0219622014500497. - DOI
-
- Arnott JC, Moser SC, Goodriche KA. Evaluation that counts: A review of climate change adaptation indicators and metrics using lessons from effective evaluation and science-practice interaction. Environmental Science and Policy. 2016;66:383–392. doi: 10.1016/j.envsci.2016.06.017. - DOI
-
- Borgström, S. In search for smart diversity: Navigating multi-level governance for sustainable development in the Stockholm region, Sweden. Ambio. Under review.
-
- Boyd E, Juhola S. Adaptive climate change governance for urban resilience. Urban Studies. 2015;52:1234–1264. doi: 10.1177/0042098014527483. - DOI
-
- Bulkeley H, Castan-Broto V. Government by experiment? Global cities and the governing of climate change. Transactions of the Institute of British Geographers. 2013;38:361–375. doi: 10.1111/j.1475-5661.2012.00535.x. - DOI
MeSH terms
Grants and funding
LinkOut - more resources
Full Text Sources
Medical
