

Community Water Fluoridation and Urinary Fluoride Concentrations in a National Sample of Pregnant Women in Canada
- PMID: 30392399
- PMCID: PMC6371693
- DOI: 10.1289/EHP3546
Community Water Fluoridation and Urinary Fluoride Concentrations in a National Sample of Pregnant Women in Canada
Abstract
Background: Fluoride exposures have not been established for pregnant women who live in regions with and without community water fluoridation.
Objective: Our aim was to measure urinary fluoride levels during pregnancy. We also assessed the contribution of drinking-water and tea consumption habits to maternal urinary fluoride (MUF) concentrations and evaluated the impact of various dilution correction standards, including adjustment for urinary creatinine and specific gravity (SG).
Methods: We measured MUF concentrations in spot samples collected in each trimester of pregnancy from 1,566 pregnant women in the Maternal-Infant Research on Environmental Chemicals cohort. We calculated intraclass correlation coefficients (ICCs) to assess variability in MUF concentrations across pregnancy. We used regression analyses to estimate associations between MUF levels, tea consumption, and water fluoride concentrations as measured by water treatment plants.
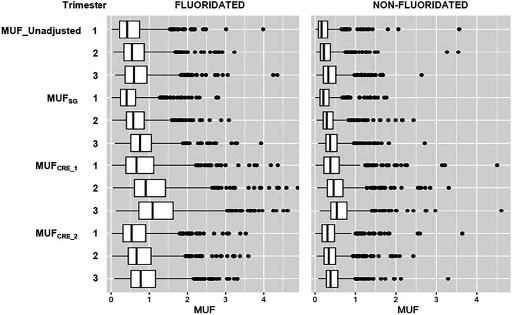
Results: Creatinine-adjusted MUF values ([Formula: see text]; milligrams per liter) were almost two times higher for pregnant women living in fluoridated regions ([Formula: see text]) compared with nonfluoridated regions ([Formula: see text]; [Formula: see text]). MUF values tended to increase over the course of pregnancy using both unadjusted values and adjusted values. Reproducibility of the unadjusted and adjusted MUF values was modest ([Formula: see text]). The municipal water fluoride level was positively associated with creatinine-adjusted MUF ([Formula: see text], 95% CI: 0.46, 0.57), accounting for 24% of the variance after controlling for covariates. Higher MUF concentrations correlated with numbers of cups of black ([Formula: see text] but not green tea ([Formula: see text]). Urinary creatinine and SG correction methods were highly correlated ([Formula: see text]) and were interchangeable in models examining predictors of MUF.
Conclusion: Community water fluoridation is a major source of fluoride exposure for pregnant women living in Canada. Urinary dilution correction with creatinine and SG were shown to be interchangeable for our sample of pregnant women. https://doi.org/10.1289/EHP3546.
Figures
Comment in
-
Comparing Fluoride Exposures in Pregnant Canadian Women: Fluoridated versus Nonfluoridated Drinking Water.Environ Health Perspect. 2019 Jul;127(7):74002. doi: 10.1289/EHP4903. Epub 2019 Jul 18. Environ Health Perspect. 2019. PMID: 31318275 Free PMC article. No abstract available.
Similar articles
-
Maternal and fetal exposures to fluoride during mid-gestation among pregnant women in northern California.Environ Health. 2020 Apr 6;19(1):38. doi: 10.1186/s12940-020-00581-2. Environ Health. 2020. PMID: 32248806 Free PMC article.
-
[Urinary excretion of fluorides in inhabitants of the Canton Vaud who consume fluoridated salt as compared with that of the inhabitants of neighboring cantons who consume nonfluoridated salt].Soz Praventivmed. 1975 Nov-Dec;20(6):263-71. doi: 10.1007/BF02027408. Soz Praventivmed. 1975. PMID: 1229731 French.
-
Fluoride exposure from infant formula and child IQ in a Canadian birth cohort.Environ Int. 2020 Jan;134:105315. doi: 10.1016/j.envint.2019.105315. Epub 2019 Nov 16. Environ Int. 2020. PMID: 31743803 Free PMC article.
-
Water fluoridation and osteoporotic fracture.Community Dent Health. 1996 Sep;13 Suppl 2:63-8. Community Dent Health. 1996. PMID: 8897754 Review.
-
Water fluoridation: a critical review of the physiological effects of ingested fluoride as a public health intervention.ScientificWorldJournal. 2014 Feb 26;2014:293019. doi: 10.1155/2014/293019. eCollection 2014. ScientificWorldJournal. 2014. PMID: 24719570 Free PMC article. Review.
Cited by
-
Dose dependence of prenatal fluoride exposure associations with cognitive performance at school age in three prospective studies.Eur J Public Health. 2024 Feb 5;34(1):143-149. doi: 10.1093/eurpub/ckad170. Eur J Public Health. 2024. PMID: 37798092 Free PMC article.
-
Effect of Fluoride Concentration in Drinking Water on Dental Fluorosis in Southwest Saudi Arabia.Int J Environ Res Public Health. 2020 Jun 1;17(11):3914. doi: 10.3390/ijerph17113914. Int J Environ Res Public Health. 2020. PMID: 32492867 Free PMC article.
-
Sirtuin 3-activated superoxide dismutase 2 mediates fluoride-induced osteoblastic differentiation in vitro and in vivo by down-regulating reactive oxygen species.Arch Toxicol. 2024 Oct;98(10):3351-3363. doi: 10.1007/s00204-024-03819-x. Epub 2024 Jul 16. Arch Toxicol. 2024. PMID: 39012504
-
Epigenome-wide association study of fluoride exposure during early adolescence and DNA methylation among U.S. children.Sci Total Environ. 2024 Oct 20;948:174916. doi: 10.1016/j.scitotenv.2024.174916. Epub 2024 Jul 20. Sci Total Environ. 2024. PMID: 39038671 Free PMC article.
-
Urinary Iodine Concentration and Thyroid Hormone Metabolism in Pregnant Women and Neurodevelopment in Their Children: A Longitudinal Canadian Birth Cohort.Nutrients. 2025 Feb 27;17(5):830. doi: 10.3390/nu17050830. Nutrients. 2025. PMID: 40077700 Free PMC article.
References
-
- Ahmed I, Rafique T, Hasan SK, Khan N, Khan MH, Usmani TH. 2012. Correlation of fluoride in drinking water with urine, blood plasma, and serum fluoride levels of people consuming high and low fluoride drinking water in Pakistan. Fluoride 45(4):336–340.
-
- An J, Mei S, Liu A, Fu Y, Wang Q, Hu LLZ, et al. . 1992. The effects of high fluoride on the intelligence level of primary and secondary students. Chin J Control Endemic Dis 7(2):93–94.
Publication types
MeSH terms
Substances
Grants and funding
LinkOut - more resources
Full Text Sources
Medical
