. 2018 Oct;126(10):107004.
doi: 10.1289/EHP3766.

Estimates of the Global Burden of Ambient PM 2.5 , Ozone, and NO 2 on Asthma Incidence and Emergency Room Visits

Affiliations

Estimates of the Global Burden of Ambient PM 2.5 , Ozone, and NO 2 on Asthma Incidence and Emergency Room Visits

Susan C Anenberg et al. Environ Health Perspect. 2018 Oct.

Abstract

Background: Asthma is the most prevalent chronic respiratory disease worldwide, affecting 358 million people in 2015. Ambient air pollution exacerbates asthma among populations around the world and may also contribute to new-onset asthma.

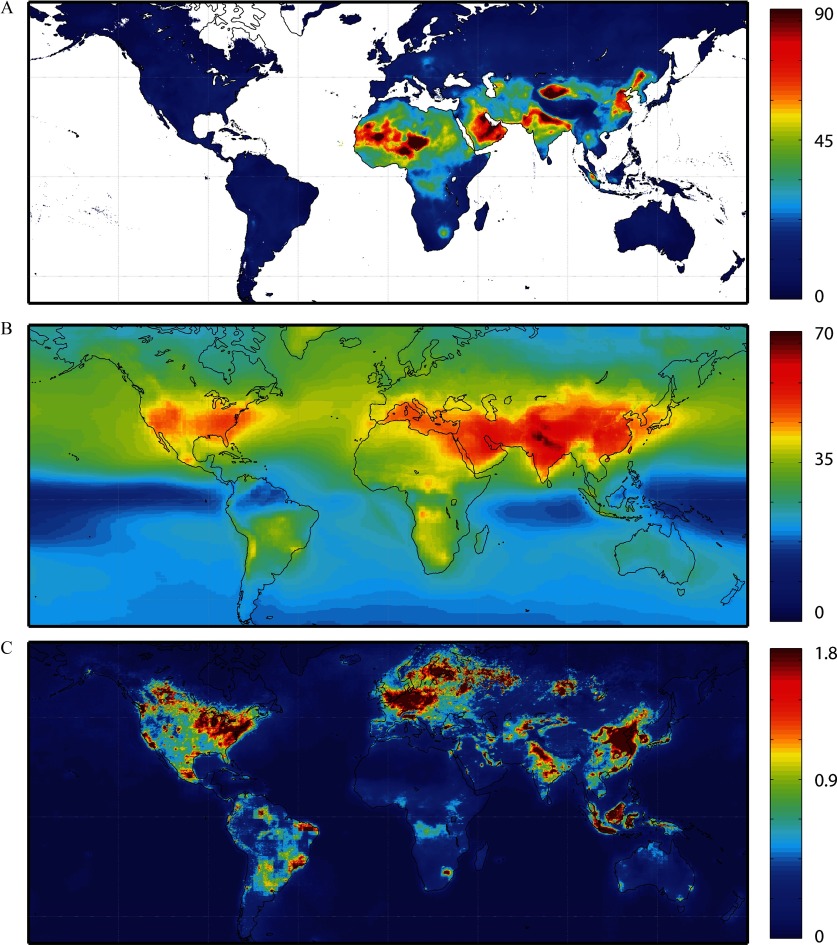
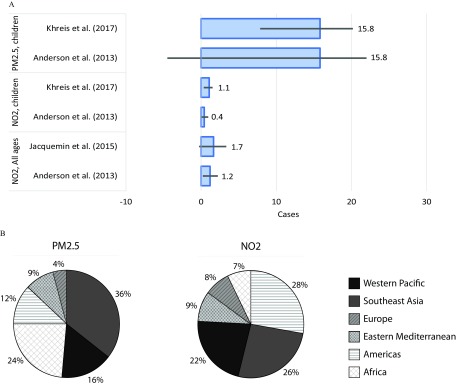
Objectives: We aimed to estimate the number of asthma emergency room visits and new onset asthma cases globally attributable to fine particulate matter ( PM 2.5 ), ozone, and nitrogen dioxide ( NO 2 ) concentrations.

Methods: We used epidemiological health impact functions combined with data describing population, baseline asthma incidence and prevalence, and pollutant concentrations. We constructed a new dataset of national and regional emergency room visit rates among people with asthma using published survey data.

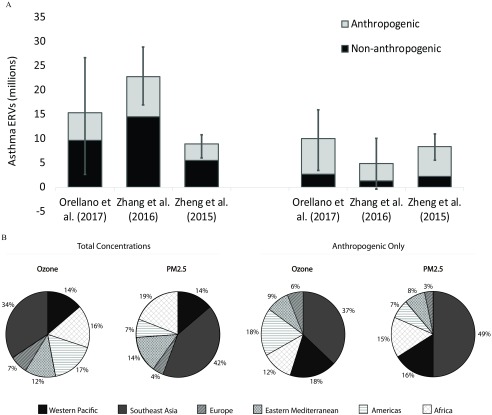
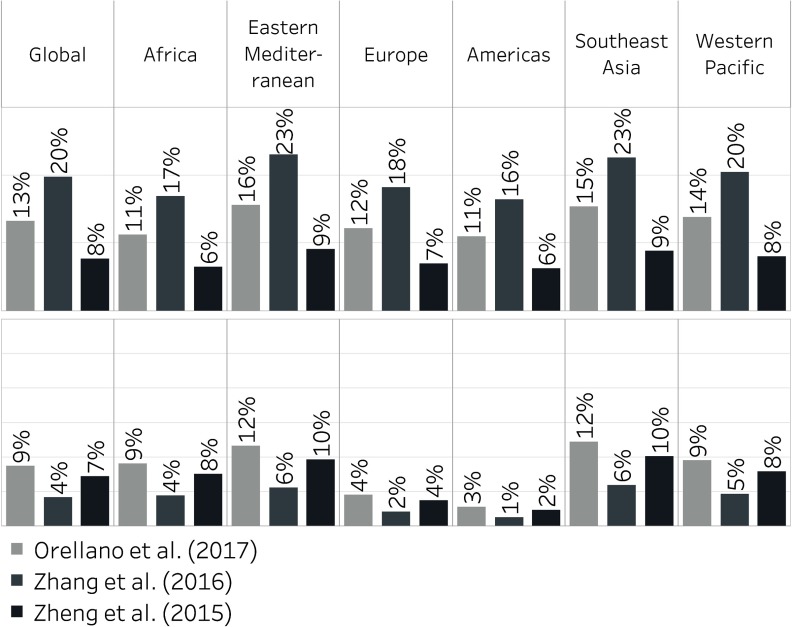
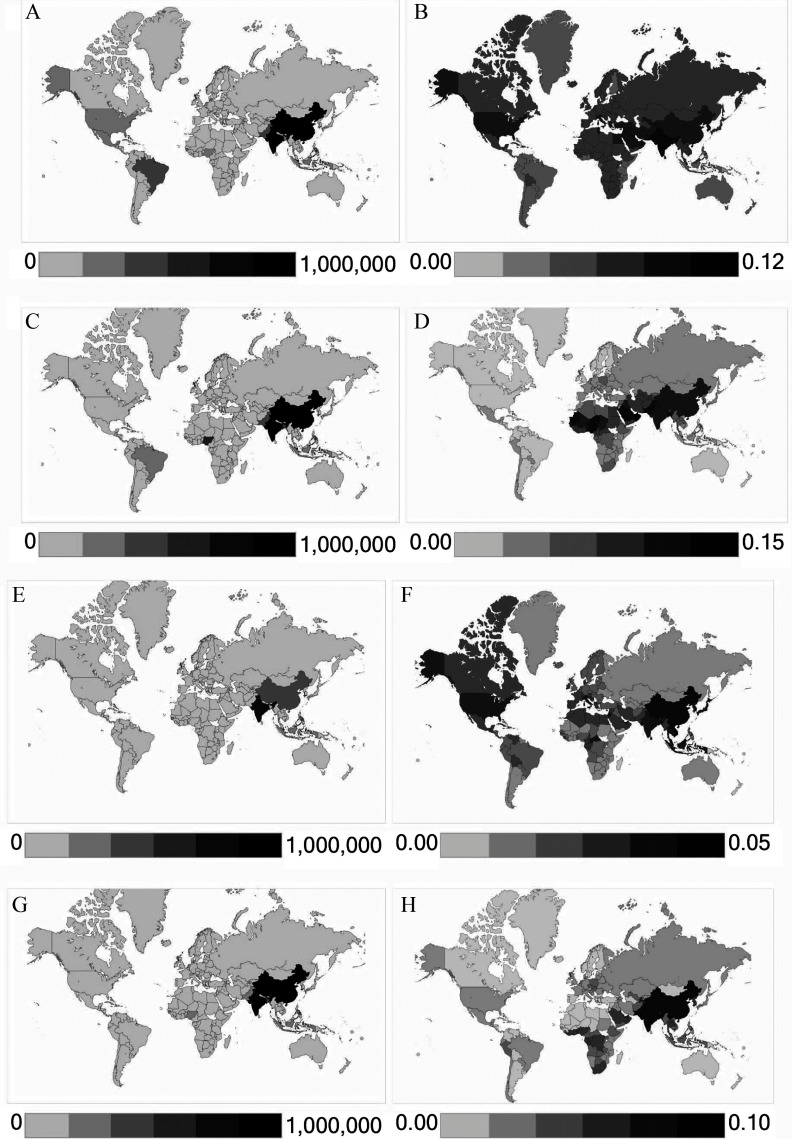
Results: We estimated that 9–23 million and 5–10 million annual asthma emergency room visits globally in 2015 could be attributable to ozone and PM 2.5 , respectively, representing 8–20% and 4–9% of the annual number of global visits, respectively. The range reflects the application of central risk estimates from different epidemiological meta-analyses. Anthropogenic emissions were responsible for 37 % and 73% of ozone and PM 2.5 impacts, respectively. Remaining impacts were attributable to naturally occurring ozone precursor emissions (e.g., from vegetation, lightning) and PM 2.5 (e.g., dust, sea salt), though several of these sources are also influenced by humans. The largest impacts were estimated in China and India.

Conclusions: These findings estimate the magnitude of the global asthma burden that could be avoided by reducing ambient air pollution. We also identified key uncertainties and data limitations to be addressed to enable refined estimation. https://doi.org/10.1289/EHP3766.


Figures

Figures 1a, 1b, and 1c are world maps of concentrations of PM sub 2.5 derived from satellite remote sensing, ozone from chemical transport models, and N O sub 2 from satellite remote sensing, respectively.
Figure 1.
Pollutant concentrations used to estimate asthma impacts. (A) PM2.5 concentrations (annual average, in μg/m3) in 2015, described by van Donkelaar et al. (2016; maxconcentration=179.8μg/m3). (B) Ozone concentrations in 2015 (annual average of 8hr daily maximum, in ppb), using multi-model average from TF HTAP ensemble (maxconcentration=72.9ppb). (C) NO2 concentrations in 2015 (annual average, in ppb), using satellite-derived dataset from method described by Lamsal et al. (2008) and adjusted by modeled ratio of daily average to 12P.M.(13001400hours) concentration (maxconcentration=17.5ppb).
Figure 2a comprises two sets of stacked bar graphs for anthropogenic and all pollutant concentrations plotting asthma ERVs in millions (y-axis) applying relative risk estimates from three epidemiological meta-analyses, namely, Orellano et al (2017), Zhang et al. (2016), and Zheng et al. (2015) (x-axis). Figure 2b comprises two sets of pie charts from total concentrations and anthropogenic sources only. Under total concentrations, the break up is as follows: For ozone, Western Pacific (14 percent), Southeast Asia (34 percent), Europe (7 percent), Eastern Mediterranean (12 percent), Americas (17 percent), and Africa (16 percent); and for PM sub 2.5, Western Pacific (14 percent), Southeast Asia (42 percent), Europe (4 percent), Eastern Mediterranean (14 percent), Americas (7 percent), and Africa (19 percent). Under anthropogenic concentrations, the break up is as follows: For ozone, Western Pacific (18 percent), Southeast Asia (37 percent), Europe (6 percent), Eastern Mediterranean (9 percent), Americas (18 percent), and Africa (12 percent); and for PM sub 2.5, Western Pacific (16 percent), Southeast Asia (49 percent), Europe (3 percent), Eastern Mediterranean (8 percent), Americas (7 percent), and Africa (15 percent).
Figure 2.
Global asthma ERVs associated with total ozone and PM2.5 concentrations among all ages in 2015, using RR central estimates from three epidemiological meta-analyses. (A) Asthma ERVs (millions) attributable to ozone and PM2.5 from anthropogenic and all sources. Confidence intervals (CI) (95%) reflect uncertainty in RR only. (B) Portion of pollution-attributable asthma ERVs occurring in each world region (results identical for all three RR estimates).
Bar graphs plotting percentage of global and regional asthma ERVs (y-axis) applying relative risk estimates from three epidemiological meta-analyses, namely, Orellano et al (2017), Zhang et al. (2016), and Zheng et al. (2015) (x-axis), that are attributable to total ozone (top panel) and PM sub 2.5 (bottom panel) concentrations for Global, Africa, Eastern Mediterranean, Europe, Americas, Southeast Asia, and Western Pacific.
Figure 3.
Percent of global and regional asthma ERVs for all ages in 2015 that are attributable to total ozone (top) and PM2.5 (bottom) concentrations, using RR central estimates from three epidemiological meta-analyses.
Figures 4a, 4b, 4c, and 4d are world maps marking areas with asthma ERVs attributable to total number of cases for ozone, fraction of national asthma ERVs for ozone, total number of cases for PM sub 2.5, and fraction of national asthma ERVs for PM sub 2.5, respectively. Figures 4e, 4f, 4g, and 4h show the same results using anthropogenic concentrations.
Figure 4.
Asthma ERVs attributable to PM2.5 and ozone in 2015, using Zheng et al. (2015) RR central estimates. Panels show asthma ERVs attributable to total: (A) ozone, number of cases; (B) ozone, fraction of national asthma ERVs; (C) PM2.5, number of cases (D) PM2.5, fraction of national asthma ERVs. Panels (E–H) show the same results but using anthropogenic concentrations.
Figure 5a is a bar graph plotting the number of pollution-attributable new asthma cases applying relative risk estimates from a number of epidemiological meta-analyses. Figure 5b is a pie chart showing percentage of pollution-attributable new asthma cases estimated to occur in each world region. Under PM sub 2.5, the break up is as follows: Western Pacific (16 percent), Southeast Asia (36 percent), Europe (4 percent), Eastern Mediterranean (9 percent), Americas (12 percent), and Africa (24 percent). Under N O sub 2, the break up is as follows: Western Pacific (22 percent), Southeast Asia (26 percent), Europe (8 percent), Eastern Mediterranean (9 percent), Americas (28 percent), and Africa (7 percent).
Figure 5.
Asthma incidence attributable to anthropogenic PM2.5 and NO2 in 2015. (A) Number of new asthma cases (millions) associated with PM2.5 and NO2 for various age groups using RRs from multiple epidemiological meta-analyses. Confidence intervals (CI) (95%) reflect error in the RR estimate only. (B) Percent of pollution-attributable new asthma cases among children occurring in each region (for each pollutant, results are identical for all RR estimates applied).

Comment in

References

    1. Allegra L, Cremonesi G, Girbino G, Ingrassia E, Marsico S, Nicolini G, et al. . 2012. Real-life prospective study on asthma control in Italy: cross-sectional phase results. Respir Med 106(2):205–214, PMID: 22035853, 10.1016/j.rmed.2011.10.001. - DOI - PubMed
    1. Anderson HR, Butland BK, van Donkelaar A, Brauer M, Strachan DP, Clayton T, et al. . 2012. Satellite-based estimates of ambient air pollution and global variations in childhood asthma prevalence. Environ Health Perspect 120(9):1333–1339, PMID: 22548921, 10.1289/ehp.1104724. - DOI - PMC - PubMed
    1. Anderson HR, Favarato G, Atkinson RW. 2013. Long-term exposure to air pollution and the incidence of asthma: meta-analysis of cohort studies. Air Qual Atmos Health 6(1):47–56, 10.1007/s11869-011-0144-5. - DOI
    1. Anenberg S, Horowitz LW, Tong DQ, West JJ. 2010. An estimate of the global burden of anthropogenic ozone and fine particulate matter on premature human mortality using atmospheric modeling. Environ Health Perspect 118(9):1189–1195, PMID: 20382579, 10.1289/ehp.0901220. - DOI - PMC - PubMed
    1. Anenberg S, West JJ, Fiore AM, Jaffe DA, Prather MJ, Bergmann D, et al. . 2009. Intercontinental impacts of ozone pollution on human mortality. Environ Sci Technol 43(17):6482–6487, PMID: 19764205, 10.1021/es900518z. - DOI - PubMed

Publication types