

Integrated Epigenetic Mapping of Human and Mouse Salivary Gene Regulation
- PMID: 30392435
- PMCID: PMC6761733
- DOI: 10.1177/0022034518806518
Integrated Epigenetic Mapping of Human and Mouse Salivary Gene Regulation
Abstract
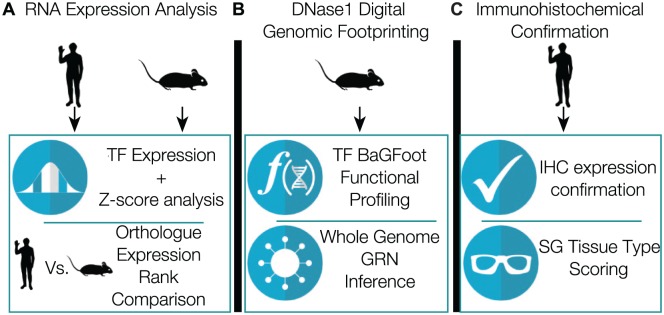
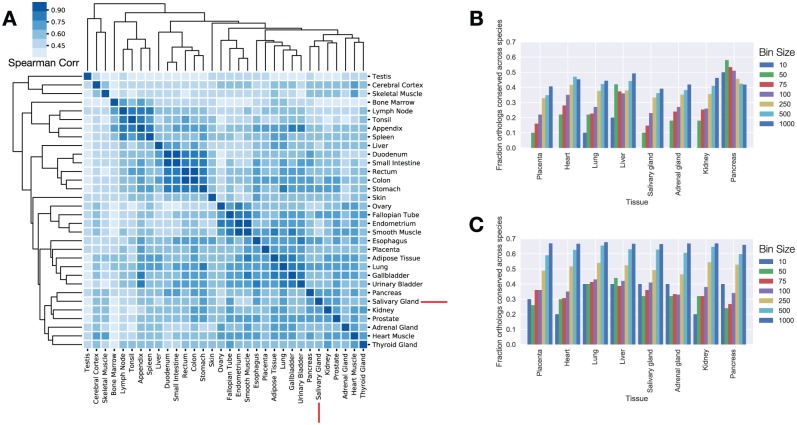
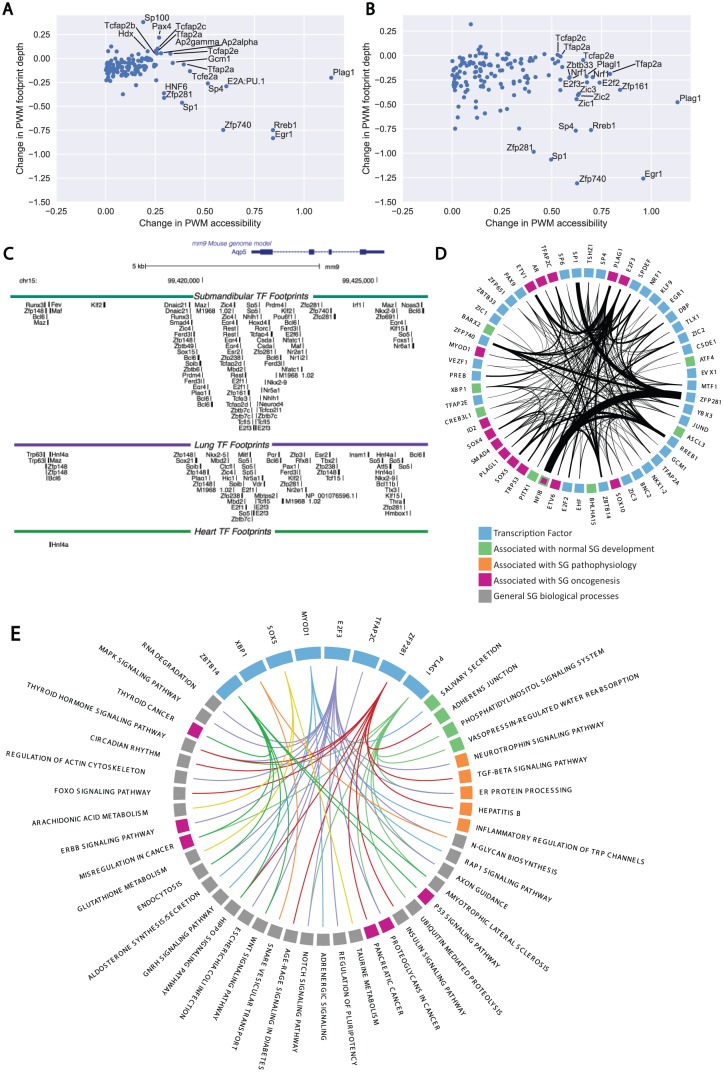
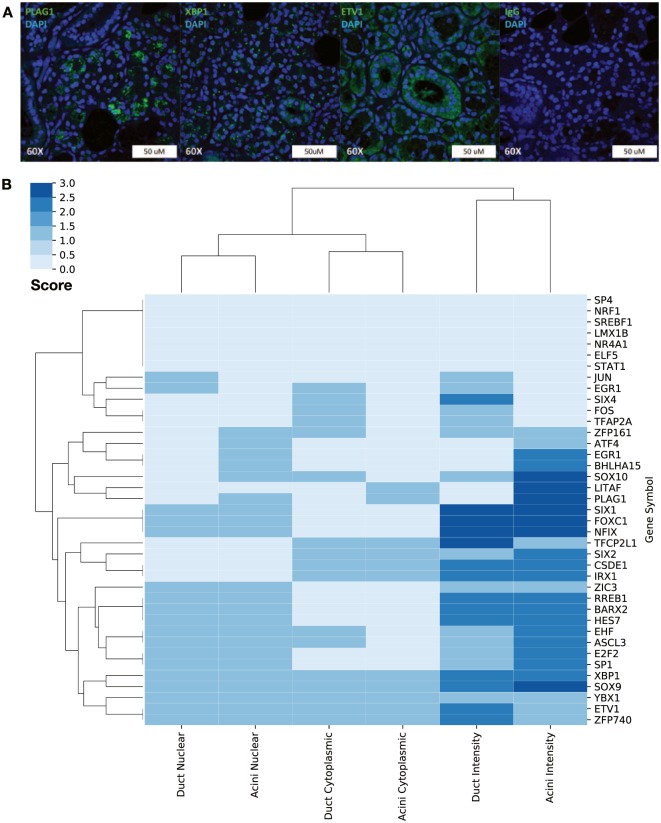
Significant effort has been applied to identify the genome-wide gene expression profiles associated with salivary gland development and pathophysiology. However, relatively little is known about the regulators that control salivary gland gene expression. We integrated data from DNase1 digital genomic footprinting, RNA-seq, and gene expression microarrays to comprehensively characterize the cis- and trans-regulatory components controlling gene expression of the healthy submandibular salivary gland. Analysis of 32 human tissues and 87 mouse tissues was performed to identify the highly expressed and tissue-enriched transcription factors driving salivary gland gene expression. Following RNA analysis, protein expression levels and subcellular localization of 39 salivary transcription factors were confirmed by immunohistochemistry. These expression analyses revealed that the salivary gland highly expresses transcription factors associated with endoplasmic reticulum stress, human T-cell lymphotrophic virus 1 expression, and Epstein-Barr virus reactivation. DNase1 digital genomic footprinting to a depth of 333,426,353 reads was performed and utilized to generate a salivary gland gene regulatory network describing the genome-wide chromatin accessibility and transcription factor binding of the salivary gland at a single-nucleotide resolution. Analysis of the DNase1 gene regulatory network identified dense interconnectivity among PLAG1, MYB, and 13 other transcription factors associated with balanced chromosomal translocations and salivary gland tumors. Collectively, these analyses provide a comprehensive atlas of the cis- and trans-regulators of the salivary gland and highlight known aberrantly regulated pathways of diseases affecting the salivary glands.
Keywords: exocrine glands; gene expression regulation; gene regulatory networks; messenger RNA; salivary glands; systems biology.
Conflict of interest statement
The authors declare no potential conflicts of interest with respect to the authorship and/or publication of this article.
Figures
Similar articles
-
Pleomorphic adenoma gene 1 is expressed in cultured benign and malignant salivary gland tumor cells.Lab Invest. 1999 May;79(5):583-9. Lab Invest. 1999. PMID: 10334569
-
Conserved mechanism of PLAG1 activation in salivary gland tumors with and without chromosome 8q12 abnormalities: identification of SII as a new fusion partner gene.Cancer Res. 1999 Feb 15;59(4):918-23. Cancer Res. 1999. PMID: 10029085
-
RNA-seq based transcriptomic map reveals new insights into mouse salivary gland development and maturation.BMC Genomics. 2016 Nov 16;17(1):923. doi: 10.1186/s12864-016-3228-7. BMC Genomics. 2016. PMID: 27852218 Free PMC article.
-
[Molecular techniques lead to the first insights into the pathophysiology of salivary gland adenomas].Verh K Acad Geneeskd Belg. 2001;63(1):35-40. Verh K Acad Geneeskd Belg. 2001. PMID: 11284386 Review. Dutch.
-
Updated Salivary Gland Immunohistochemistry: A Review.Arch Pathol Lab Med. 2023 Dec 1;147(12):1383-1389. doi: 10.5858/arpa.2022-0461-RA. Arch Pathol Lab Med. 2023. PMID: 37074867 Review.
Cited by
-
Evaluating the transcriptional landscape and cell-cell communication networks in chronically irradiated parotid glands.iScience. 2023 Apr 11;26(5):106660. doi: 10.1016/j.isci.2023.106660. eCollection 2023 May 19. iScience. 2023. PMID: 37168562 Free PMC article.
-
Tlx1 regulates acinar and duct development in mouse salivary glands.J Anat. 2024 Feb;244(2):343-357. doi: 10.1111/joa.13964. Epub 2023 Oct 13. J Anat. 2024. PMID: 37837237 Free PMC article.
-
Gene expression alterations in salivary gland epithelia of Sjögren's syndrome patients are associated with clinical and histopathological manifestations.Sci Rep. 2021 May 27;11(1):11154. doi: 10.1038/s41598-021-90569-w. Sci Rep. 2021. PMID: 34045583 Free PMC article.
-
A Global Vista of the Epigenomic State of the Mouse Submandibular Gland.J Dent Res. 2021 Dec;100(13):1492-1500. doi: 10.1177/00220345211012000. Epub 2021 May 12. J Dent Res. 2021. PMID: 33978512 Free PMC article.
-
Sclerosing Sialadenitis Is Associated With Salivary Gland Hypofunction and a Unique Gene Expression Profile in Sjögren's Syndrome.Front Immunol. 2021 Jul 30;12:699722. doi: 10.3389/fimmu.2021.699722. eCollection 2021. Front Immunol. 2021. PMID: 34400910 Free PMC article.
References
Publication types
MeSH terms
Substances
Grants and funding
LinkOut - more resources
Full Text Sources
Medical
