

Malaria epidemiology and interventions in Ethiopia from 2001 to 2016
- PMID: 30392470
- PMCID: PMC6217769
- DOI: 10.1186/s40249-018-0487-3
Malaria epidemiology and interventions in Ethiopia from 2001 to 2016
Abstract
Background: Ethiopia is one of the African countries where Plasmodium falciparum and P. vivax co-exist. Monitoring and evaluation of current malaria transmission status is an important component of malaria control as it is a measure of the success of ongoing interventions and guides the planning of future control and elimination efforts.
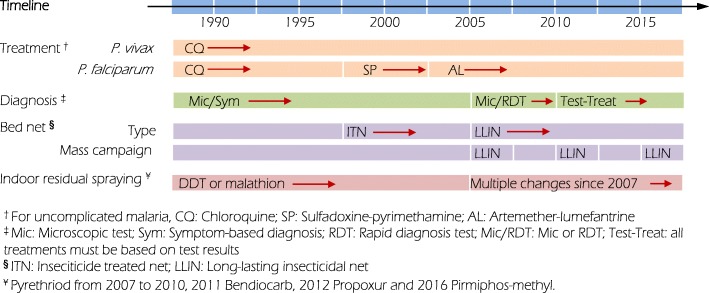
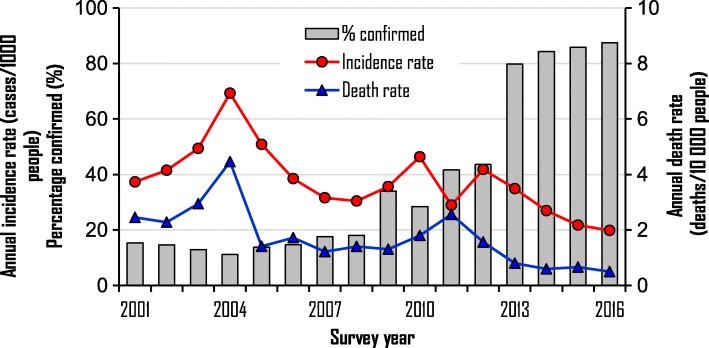
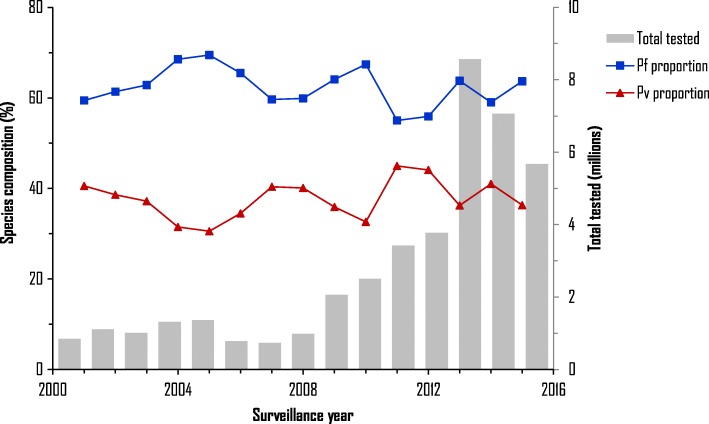
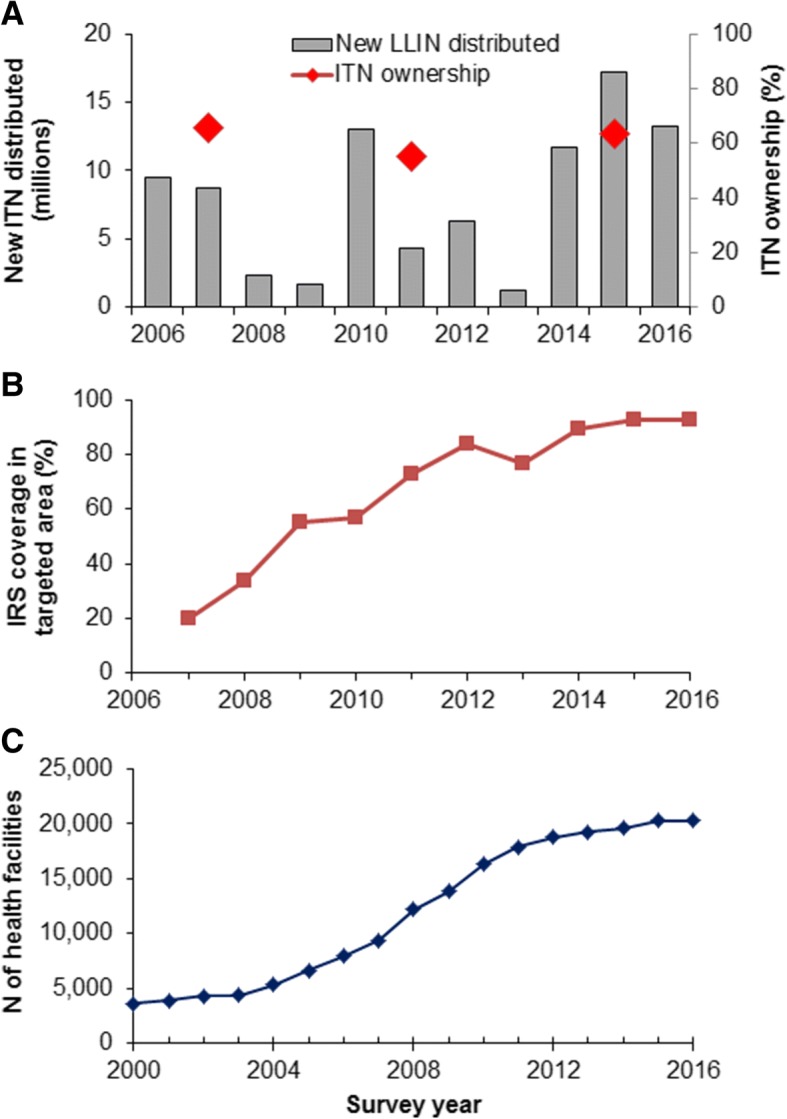
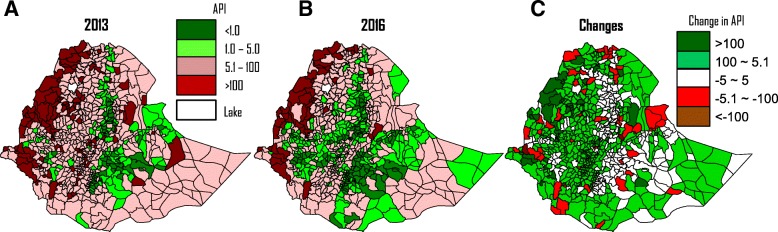
Main text: We evaluated changes in malaria control policy in Ethiopia, and reviewed dynamics of country-wide confirmed and clinical malaria cases by Plasmodium species and reported deaths for all ages and less than five years from 2001 to 2016. Districts level annual parasite incidence was analysed to characterize the malaria transmission stratification as implemented by the Ministry of Health. We found that Ethiopia has experienced major changes from 2003 to 2005 and subsequent adjustment in malaria diagnosis, treatment and vector control policy. Malaria interventions have been intensified represented by the increased insecticide treated net (ITN) and indoor residual spraying (IRS) coverage, improved health services and improved malaria diagnosis. However, countrywide ITN and IRS coverages were low, with 64% ITN coverage in 2016 and IRS coverage of 92.5% in 2016 and only implemented in epidemic-prone areas of > 2500 m elevation. Clinical malaria incidence rate dropped from an average of 43.1 cases per 1000 population annually between 2001 and 2010 to 29.0 cases per 1000 population annually between 2011 and 2016. Malaria deaths decreased from 2.1 deaths per 100 000 people annually between 2001 and 2010 to 1.1 deaths per 100 000 people annually between 2011 to 2016. There was shrinkage in the malaria transmission map and high transmission is limited mainly to the western international border area. Proportion of P. falciparum malaria remained nearly unchanged from 2000 to 2016 indicating further efforts are needed to suppress transmission.
Conclusions: Malaria morbidity and mortality have been significantly reduced in Ethiopia since 2001, however, malaria case incidence is still high, and there were major gaps between ITN ownership and compliance in malarious areas. Additional efforts are needed to target the high transmission area of western Ethiopia to sustain the achievements made to date.
Keywords: Epidemiology; Ethiopia; Incidence; Malaria control; Plasmodium falciparum; Plasmodium vivax; Policy; Spatial distribution.
Conflict of interest statement
Ethics approval and consent to participate
Not applicable
Consent for publication
Not applicable.
Competing interests
The authors declare that they have no competing interests.
Figures
Similar articles
-
Malaria epidemiology and stratification of incidence in the malaria elimination setting in Harari Region, Eastern Ethiopia.Infect Dis Poverty. 2020 Nov 22;9(1):160. doi: 10.1186/s40249-020-00773-5. Infect Dis Poverty. 2020. PMID: 33222698 Free PMC article.
-
Spatiotemporal clustering of malaria in southern-central Ethiopia: A community-based cohort study.PLoS One. 2019 Sep 30;14(9):e0222986. doi: 10.1371/journal.pone.0222986. eCollection 2019. PLoS One. 2019. PMID: 31568489 Free PMC article. Clinical Trial.
-
Malaria indicator survey 2007, Ethiopia: coverage and use of major malaria prevention and control interventions.Malar J. 2010 Feb 24;9:58. doi: 10.1186/1475-2875-9-58. Malar J. 2010. PMID: 20178654 Free PMC article.
-
[Role of primaquine in malaria control and elimination in French-speaking Africa].Bull Soc Pathol Exot. 2017 Aug;110(3):198-206. doi: 10.1007/s13149-017-0556-z. Epub 2017 Apr 17. Bull Soc Pathol Exot. 2017. PMID: 28417346 Review. French.
-
Malaria in Meghalaya: a systematic literature review and analysis of data from the National Vector-Borne Disease Control Programme.Malar J. 2018 Nov 6;17(1):411. doi: 10.1186/s12936-018-2563-3. Malar J. 2018. PMID: 30400879 Free PMC article.
Cited by
-
Anopheles arabiensis continues to be the primary vector of Plasmodium falciparum after decades of malaria control in southwestern Ethiopia.Malar J. 2024 Jan 9;23(1):14. doi: 10.1186/s12936-024-04840-2. Malar J. 2024. PMID: 38195563 Free PMC article.
-
Feasibility of Malaria Elimination in Ethiopia.Ethiop J Health Sci. 2020 Jul 1;30(4):607-614. doi: 10.4314/ejhs.v30i4.16. Ethiop J Health Sci. 2020. PMID: 33897221 Free PMC article. Review.
-
Plasticity of blood feeding behavior of Anopheles mosquitoes in Ethiopia: a systematic review.Parasit Vectors. 2024 Sep 28;17(1):408. doi: 10.1186/s13071-024-06493-1. Parasit Vectors. 2024. PMID: 39342300 Free PMC article.
-
Antimalarial activity of the hydroalcoholic crude extract and solvent fractions of Commelina latifolia Hochst. ex C.B.Clarke (Commelinaceae) leaves against Plasmodium berghei in mice.Heliyon. 2022 Dec 10;8(12):e12045. doi: 10.1016/j.heliyon.2022.e12045. eCollection 2022 Dec. Heliyon. 2022. PMID: 36578416 Free PMC article.
-
Epidemic malaria dynamics in Ethiopia: the role of self-limiting, poverty, HIV, climate change and human population growth.Malar J. 2022 Apr 27;21(1):135. doi: 10.1186/s12936-022-04161-2. Malar J. 2022. PMID: 35477448 Free PMC article.
References
-
- World Health Organization. World Malaria Report 2017. http://www.who.int/malaria/publications/world-malaria-report-2016/report.... Accessed 30 Mar 2018.
-
- McCann JC. The historical ecology of malaria in Ethiopia. Deposing the spirits. Athens: Ohio University Press; 2014.
-
- Ministry of Health . National strategic plan for malaria prevention, control and elimination in Ethiopia, 2011–2015. Addis Ababa: Ministry of Health of Ethiopia; 2010.
