

Intra- and inter-operator reproducibility of automated cloud-based carotid lumen diameter ultrasound measurement
- PMID: 30392503
- PMCID: PMC6205023
- DOI: 10.1016/j.ihj.2018.01.024
Intra- and inter-operator reproducibility of automated cloud-based carotid lumen diameter ultrasound measurement
Abstract
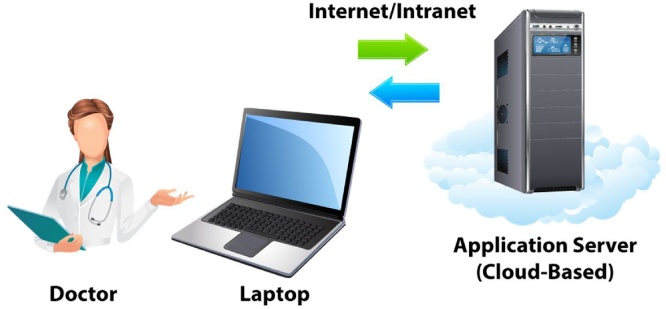
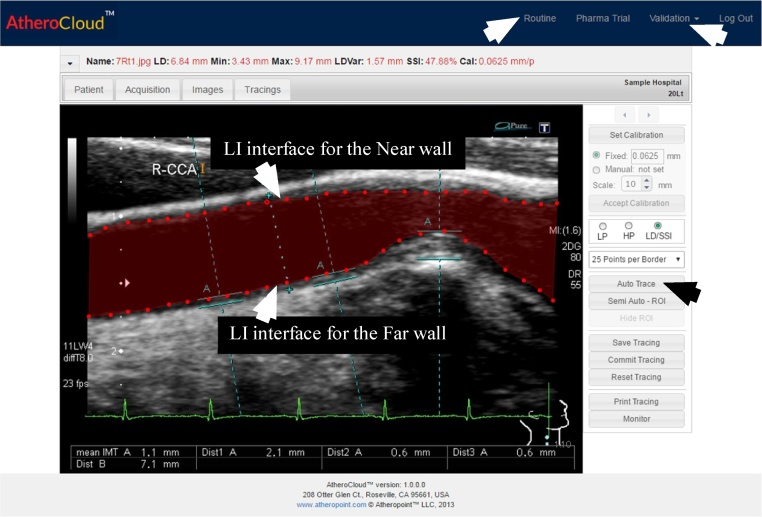
Background: Common carotid artery lumen diameter (LD) ultrasound measurement systems are either manual or semi-automated and lack reproducibility and variability studies. This pilot study presents an automated and cloud-based LD measurements software system (AtheroCloud) and evaluates its: (i) intra/inter-operator reproducibility and (ii) intra/inter-observer variability.
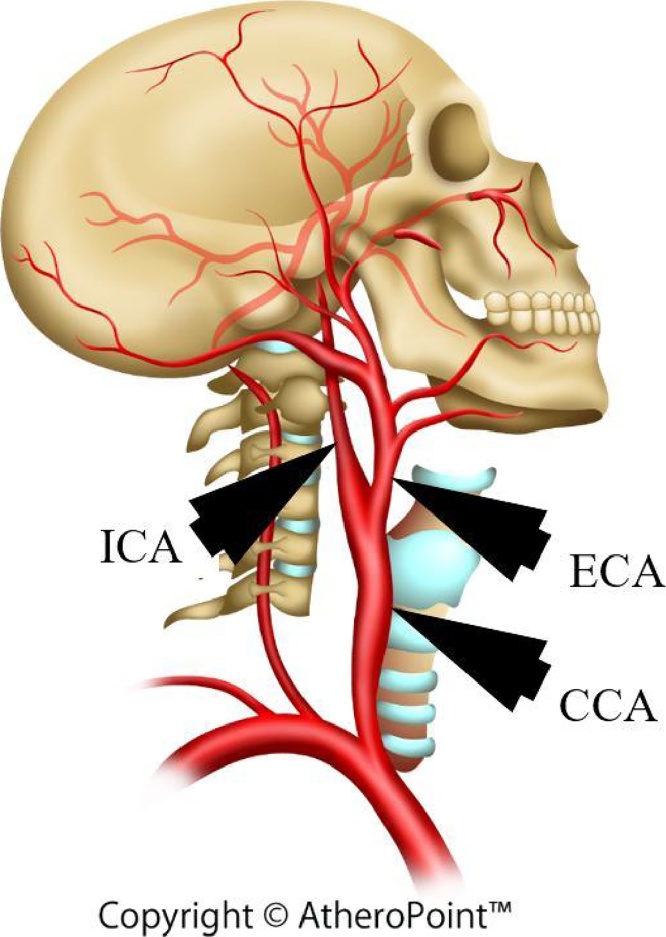
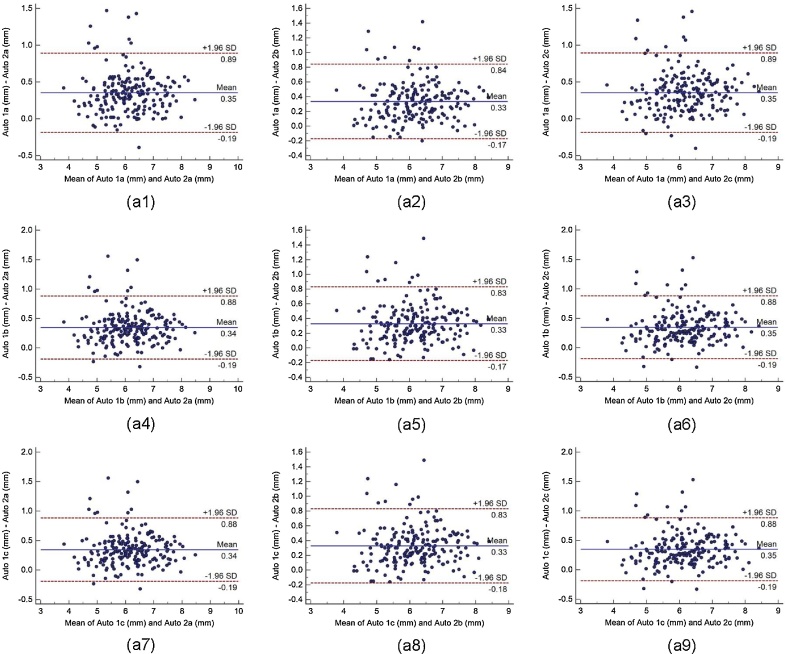
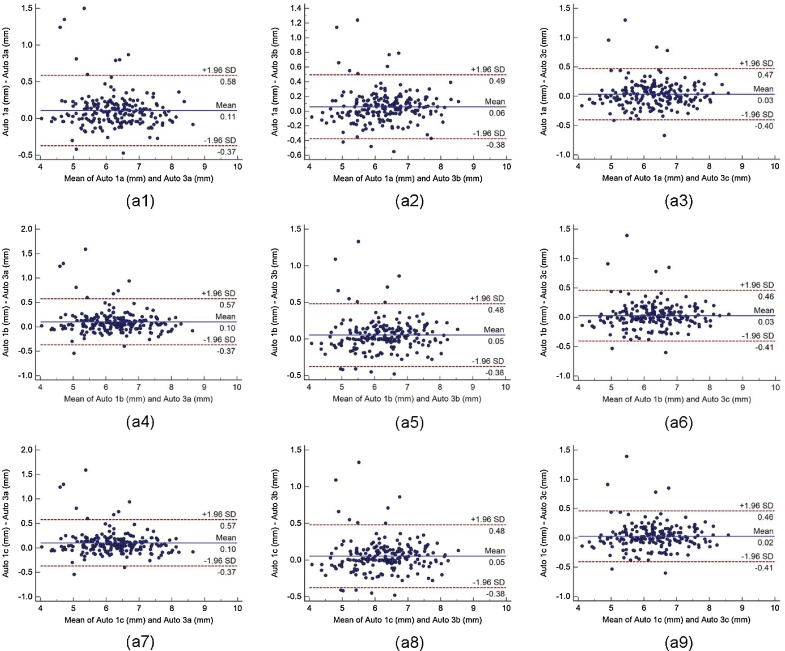
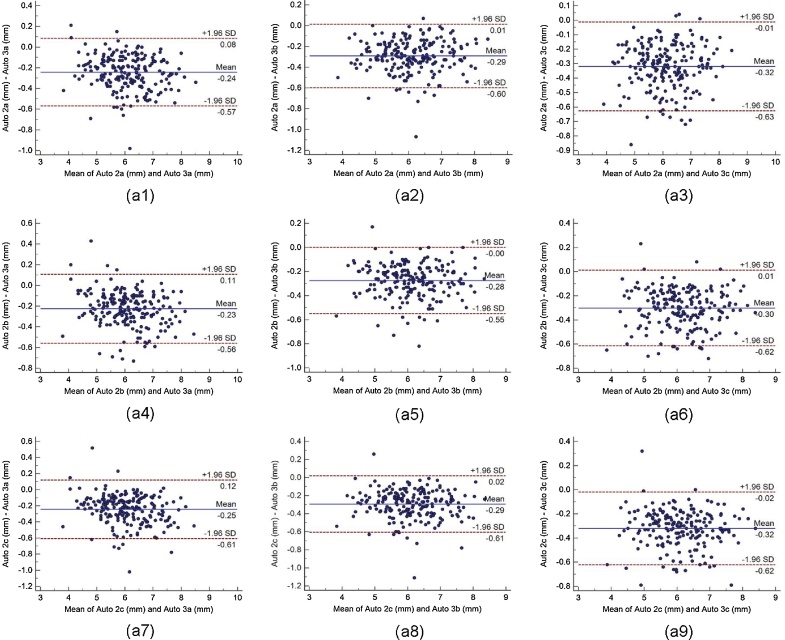
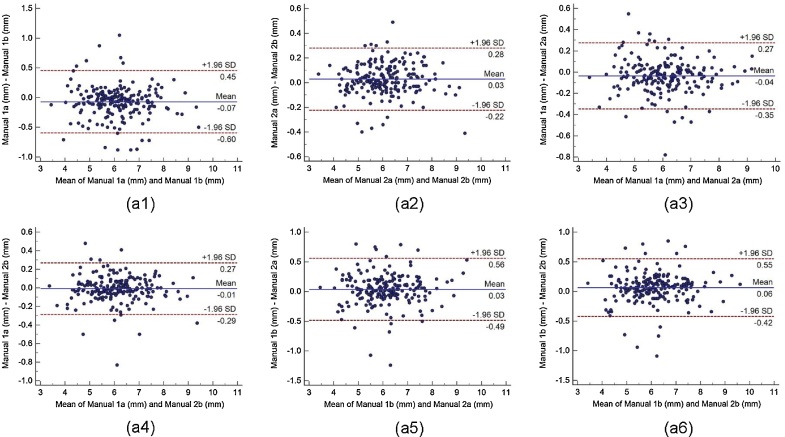
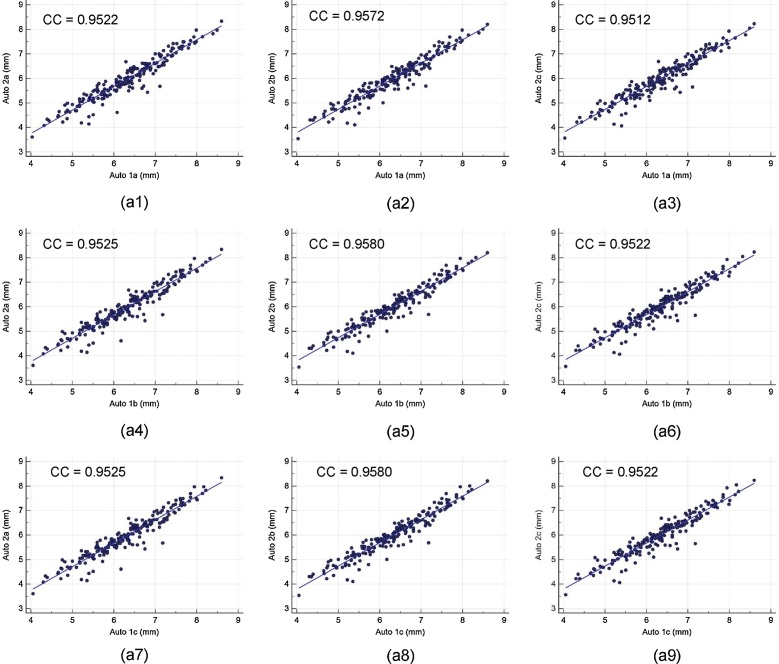
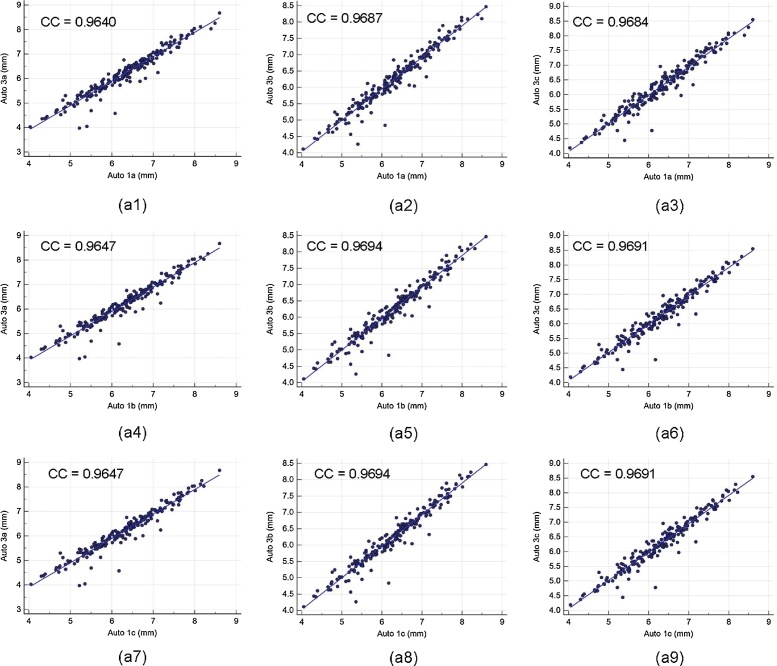
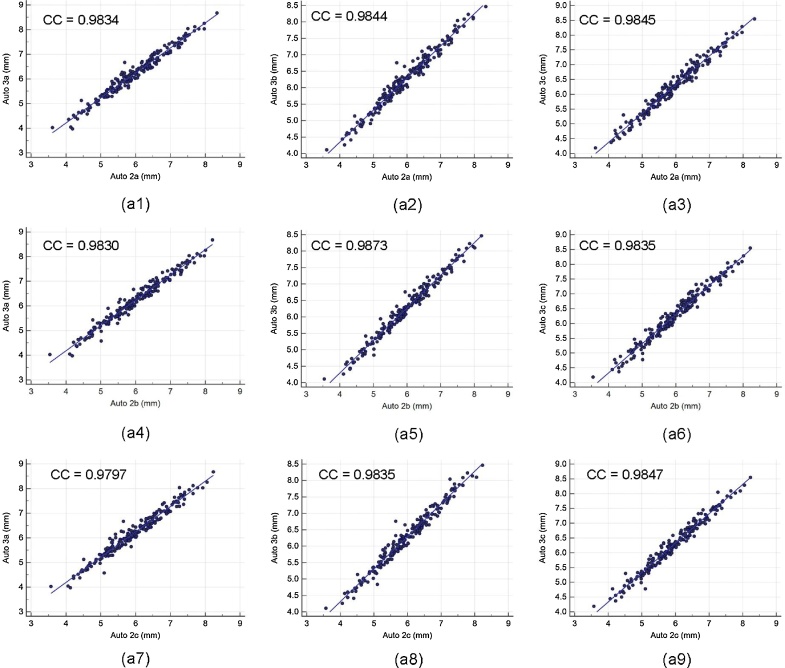
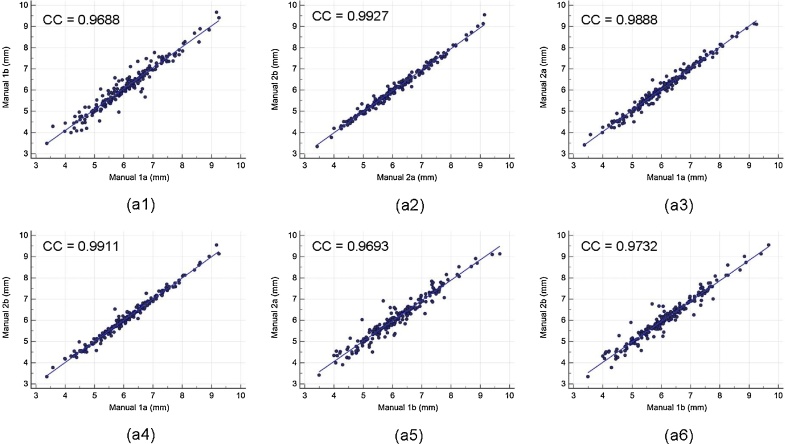
Methods: 100 patients (83M, mean age: 68±11years), IRB approved, consisted of L/R CCA artery (200 ultrasound images), acquired using a 7.5-MHz linear transducer. The intra/inter-operator reproducibility was verified using three operator's readings. Near-wall and far carotid wall borders were manually traced by two observers for intra/inter-observer variability analysis.
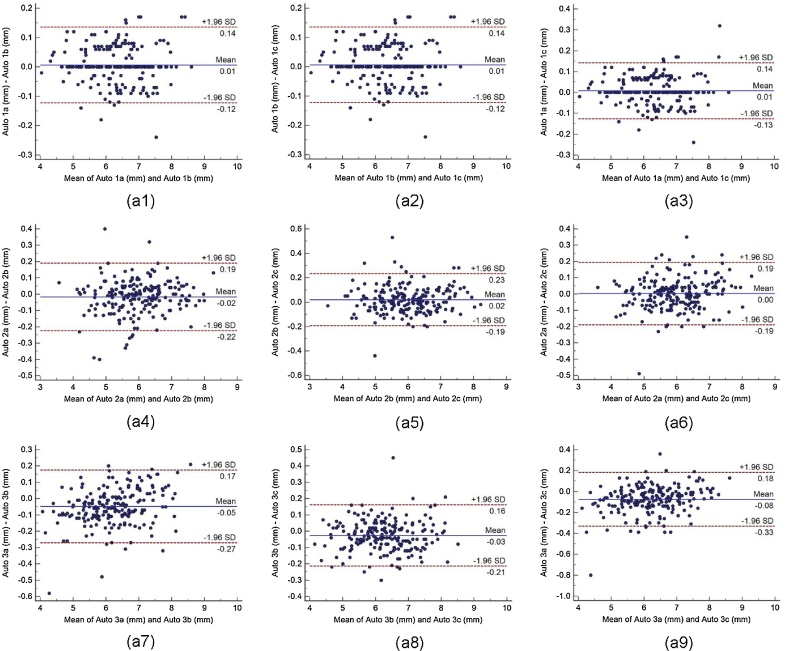
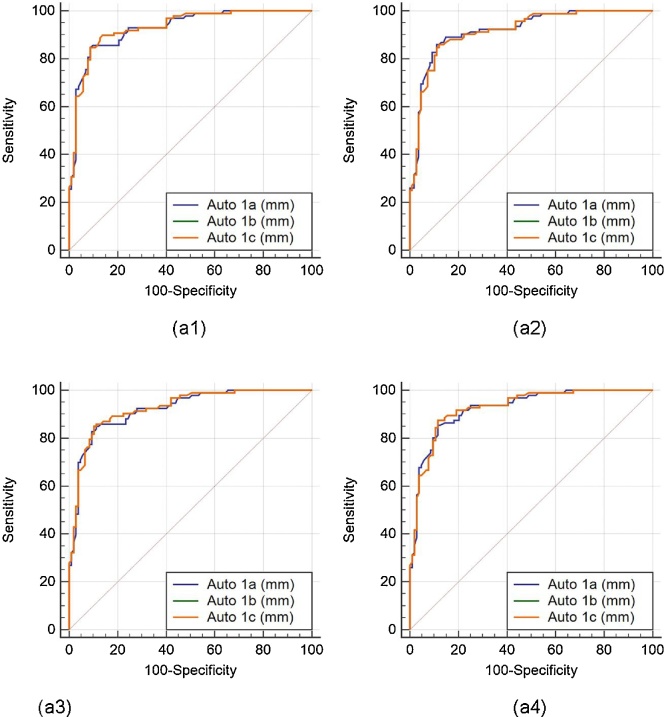
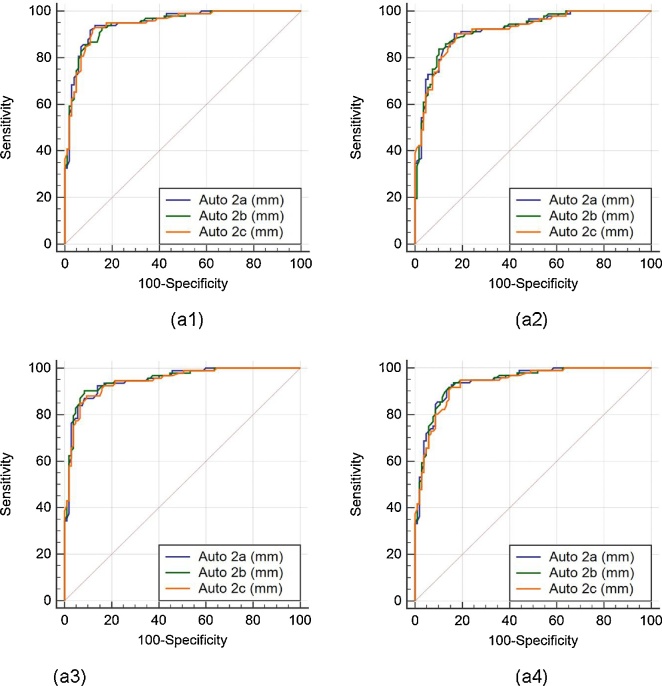
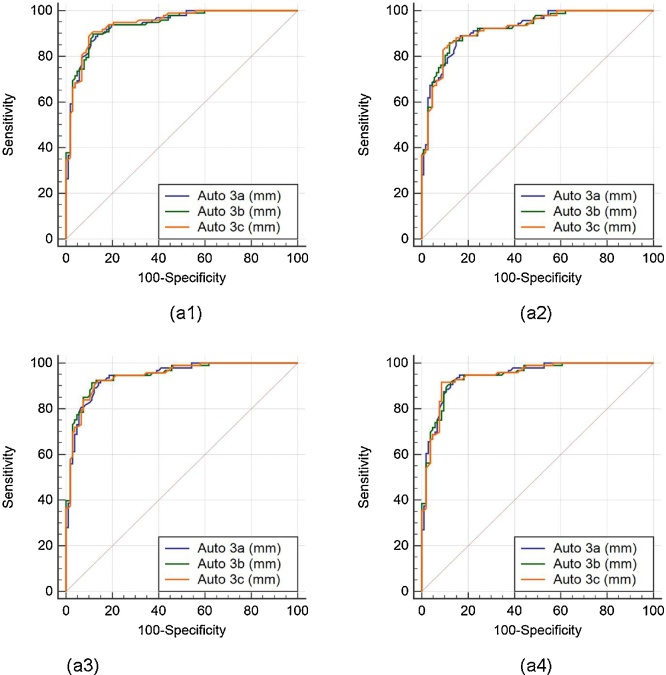
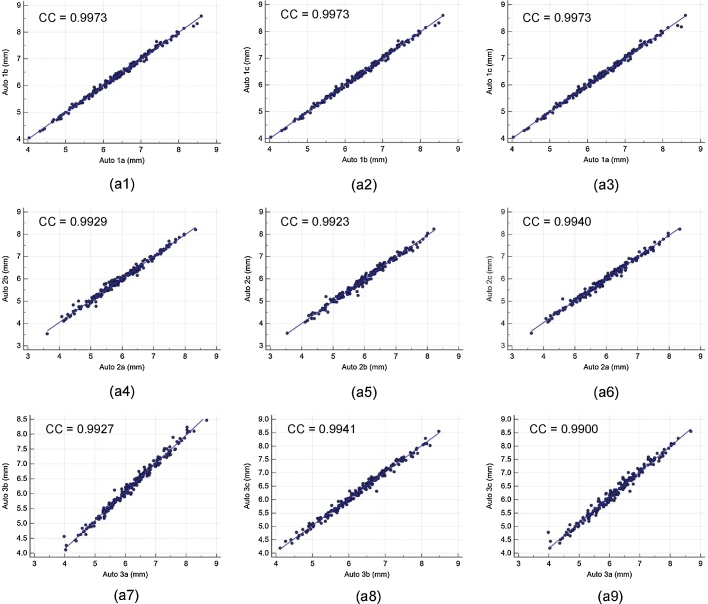
Results: The mean coefficient of correlation (CC) for intra- and inter-operator reproducibility between all the three automated reading pairs were: 0.99 (P<0.0001) and 0.97 (P<0.0001), respectively. The mean CC for intra- and inter-observer variability between both the manual reading pairs were 0.98 (P<0.0001) and 0.98 (P<0.0001), respectively. The Figure-of-Merit between the mean of the three automated readings against the four manuals were 98.32%, 99.50%, 98.94% and 98.49%, respectively.
Conclusions: The AtheroCloud LD measurement system showed high intra/inter-operator reproducibility hence can be adapted for vascular screening mode or pharmaceutical clinical trial mode.
Keywords: Atherosclerosis; Carotid; Cloud-based; Reliability; Reproducibility.
Copyright © 2018. Published by Elsevier B.V.
Figures

Similar articles
-
Inter- and intra-observer variability analysis of completely automated cIMT measurement software (AtheroEdge™) and its benchmarking against commercial ultrasound scanner and expert Readers.Comput Biol Med. 2013 Sep;43(9):1261-72. doi: 10.1016/j.compbiomed.2013.06.012. Epub 2013 Jun 26. Comput Biol Med. 2013. PMID: 23930821 Clinical Trial.
-
Accurate cloud-based smart IMT measurement, its validation and stroke risk stratification in carotid ultrasound: A web-based point-of-care tool for multicenter clinical trial.Comput Biol Med. 2016 Aug 1;75:217-34. doi: 10.1016/j.compbiomed.2016.06.010. Epub 2016 Jun 10. Comput Biol Med. 2016. PMID: 27318571 Clinical Trial.
-
Web-based accurate measurements of carotid lumen diameter and stenosis severity: An ultrasound-based clinical tool for stroke risk assessment during multicenter clinical trials.Comput Biol Med. 2017 Dec 1;91:306-317. doi: 10.1016/j.compbiomed.2017.10.022. Epub 2017 Oct 23. Comput Biol Med. 2017. PMID: 29107894
-
State-of-the-art review on automated lumen and adventitial border delineation and its measurements in carotid ultrasound.Comput Methods Programs Biomed. 2018 Sep;163:155-168. doi: 10.1016/j.cmpb.2018.05.015. Epub 2018 May 11. Comput Methods Programs Biomed. 2018. PMID: 30119850 Review.
-
[Intima media thickness of the carotid arteries: early pointer to arteriosclerosis and therapeutic endpoint].Ultraschall Med. 2003 Jun;24(3):162-74. doi: 10.1055/s-2003-40058. Ultraschall Med. 2003. PMID: 12817310 Review. German.
Cited by
-
Inter-Variability Study of COVLIAS 1.0: Hybrid Deep Learning Models for COVID-19 Lung Segmentation in Computed Tomography.Diagnostics (Basel). 2021 Nov 1;11(11):2025. doi: 10.3390/diagnostics11112025. Diagnostics (Basel). 2021. PMID: 34829372 Free PMC article.
-
GeneAI 3.0: powerful, novel, generalized hybrid and ensemble deep learning frameworks for miRNA species classification of stationary patterns from nucleotides.Sci Rep. 2024 Mar 26;14(1):7154. doi: 10.1038/s41598-024-56786-9. Sci Rep. 2024. PMID: 38531923 Free PMC article.
-
Systematic Review of Artificial Intelligence in Acute Respiratory Distress Syndrome for COVID-19 Lung Patients: A Biomedical Imaging Perspective.IEEE J Biomed Health Inform. 2021 Nov;25(11):4128-4139. doi: 10.1109/JBHI.2021.3103839. Epub 2021 Nov 5. IEEE J Biomed Health Inform. 2021. PMID: 34379599 Free PMC article.
-
COVLIAS 1.0: Lung Segmentation in COVID-19 Computed Tomography Scans Using Hybrid Deep Learning Artificial Intelligence Models.Diagnostics (Basel). 2021 Aug 4;11(8):1405. doi: 10.3390/diagnostics11081405. Diagnostics (Basel). 2021. PMID: 34441340 Free PMC article.
-
Rheumatoid Arthritis: Atherosclerosis Imaging and Cardiovascular Risk Assessment Using Machine and Deep Learning-Based Tissue Characterization.Curr Atheroscler Rep. 2019 Jan 25;21(2):7. doi: 10.1007/s11883-019-0766-x. Curr Atheroscler Rep. 2019. PMID: 30684090 Review.
References
-
- Mozaffarian D., Benjamin E.J., Go A.S. Executive Summary: Heart Disease and Stroke Statistics--2016 Update: a report from the American Heart Association. Circulation. 2016;133:447–454. - PubMed
-
- Ross R. Cell biology of atherosclerosis. Annu Rev Physiol. 1995;57:791–804. - PubMed
-
- Libby P., Ridker P.M., Hansson G.K. Progress and challenges in translating the biology of atherosclerosis. Nature. 2011;473:317. - PubMed
-
- Strandness D.E., Eikelboom B.C. Carotid artery stenosis – where do we go from here? Eur J Ultrasound. 1998;7:S17–S26. - PubMed
MeSH terms
LinkOut - more resources
Full Text Sources
Research Materials
