. 2018 Dec 5;100(5):1194-1208.e5.
doi: 10.1016/j.neuron.2018.10.012. Epub 2018 Nov 1.

h-Channels Contribute to Divergent Intrinsic Membrane Properties of Supragranular Pyramidal Neurons in Human versus Mouse Cerebral Cortex

Affiliations

h-Channels Contribute to Divergent Intrinsic Membrane Properties of Supragranular Pyramidal Neurons in Human versus Mouse Cerebral Cortex

Brian E Kalmbach et al. Neuron. .

Abstract

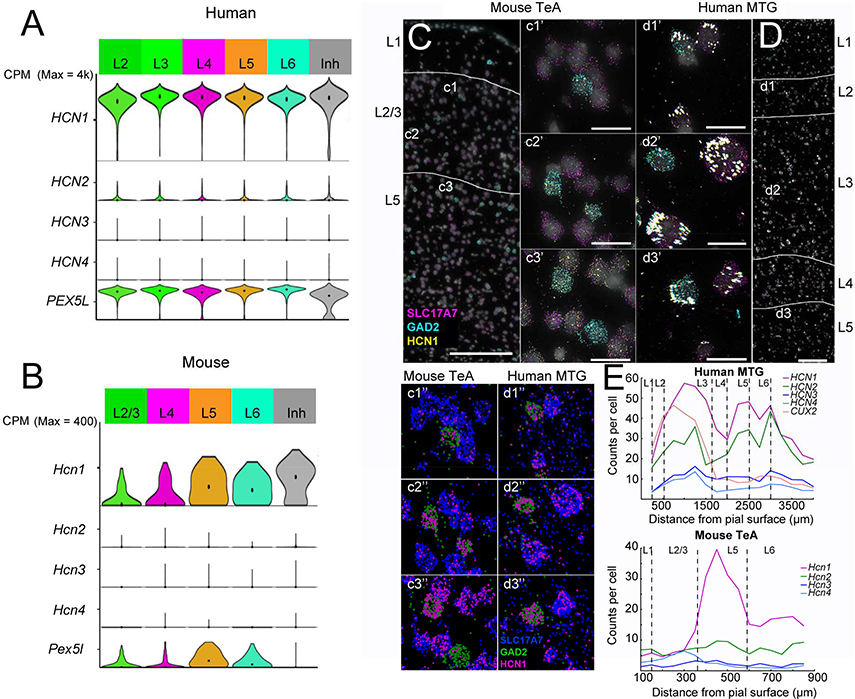
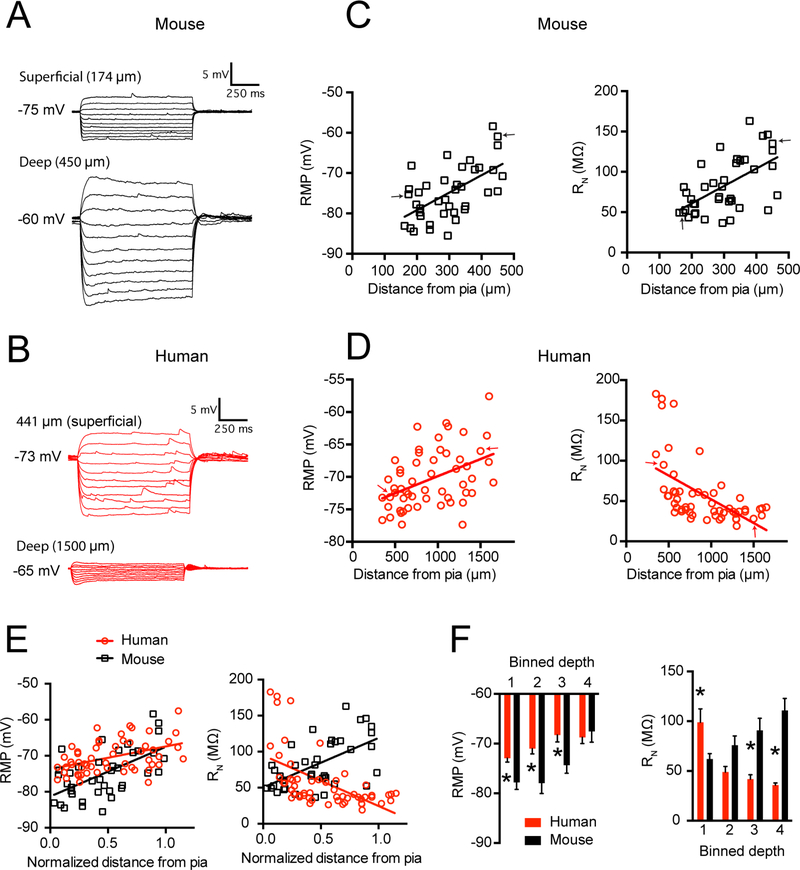
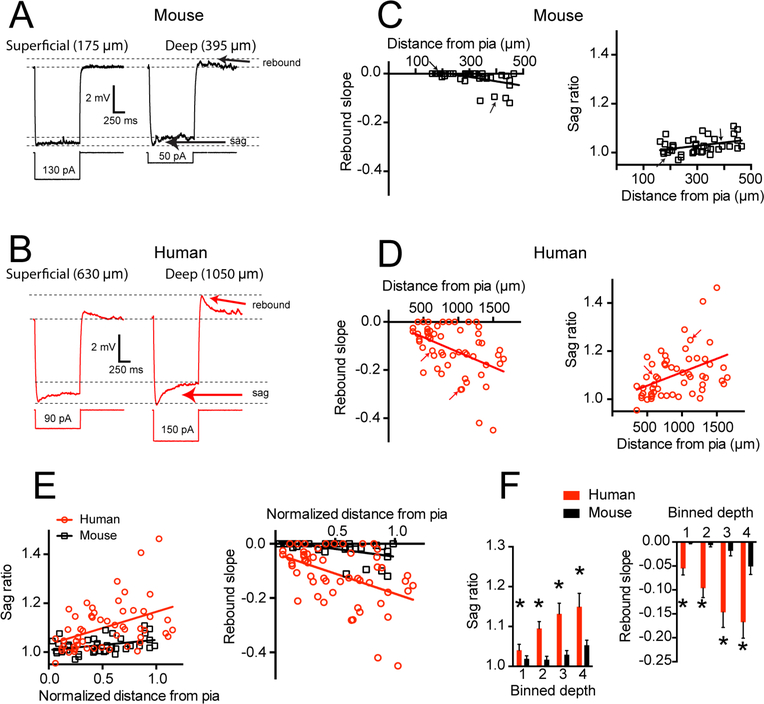
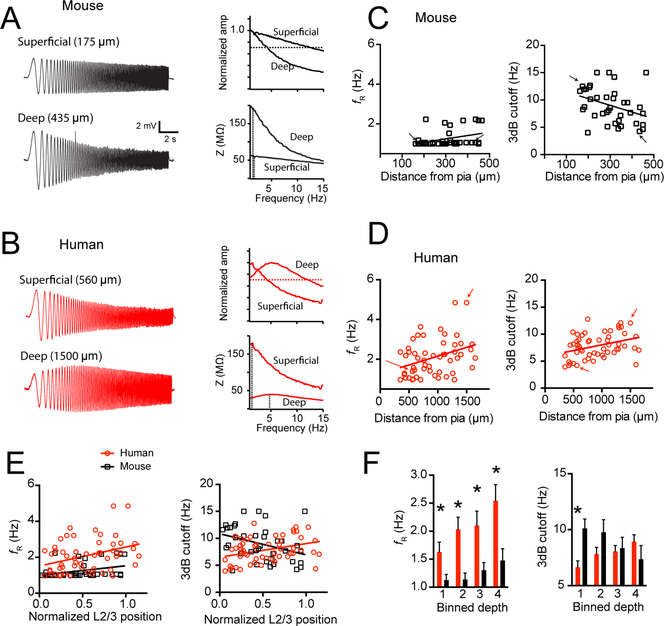
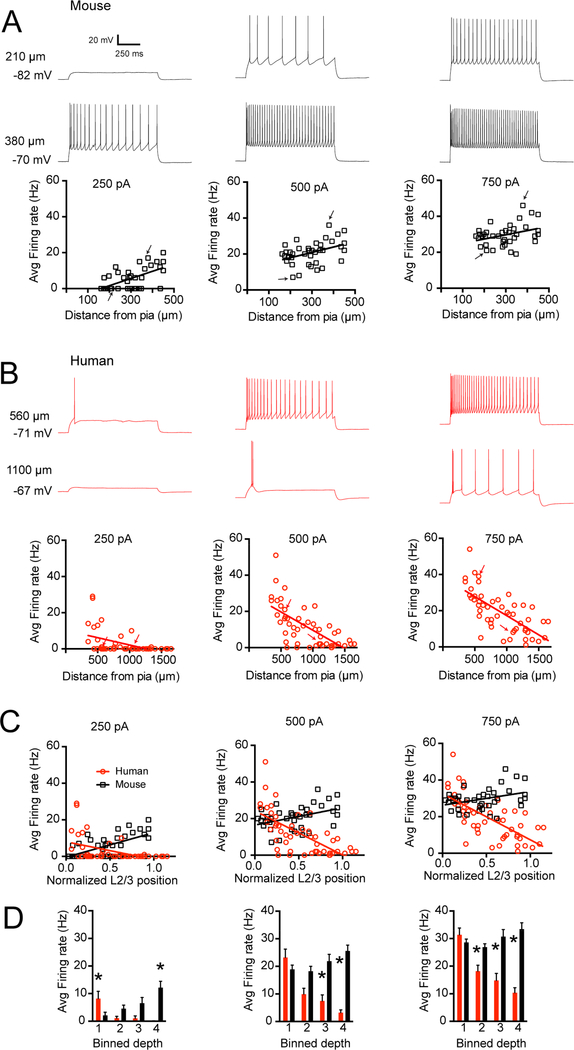
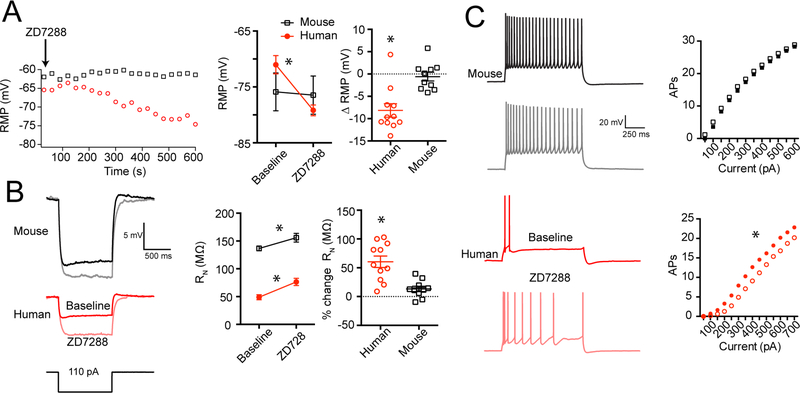
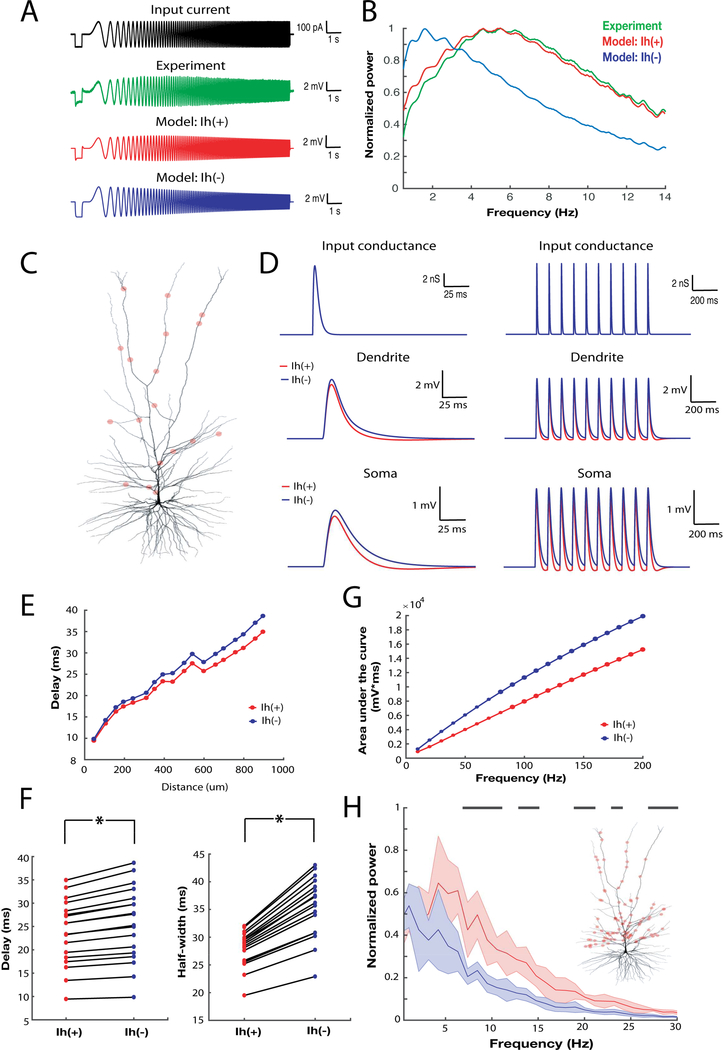
Gene expression studies suggest that differential ion channel expression contributes to differences in rodent versus human neuronal physiology. We tested whether h-channels more prominently contribute to the physiological properties of human compared to mouse supragranular pyramidal neurons. Single-cell/nucleus RNA sequencing revealed ubiquitous HCN1-subunit expression in excitatory neurons in human, but not mouse, supragranular layers. Using patch-clamp recordings, we found stronger h-channel-related membrane properties in supragranular pyramidal neurons in human temporal cortex, compared to mouse supragranular pyramidal neurons in temporal association area. The magnitude of these differences depended upon cortical depth and was largest in pyramidal neurons in deep L3. Additionally, pharmacologically blocking h-channels produced a larger change in membrane properties in human compared to mouse neurons. Finally, using biophysical modeling, we provide evidence that h-channels promote the transfer of theta frequencies from dendrite-to-soma in human L3 pyramidal neurons. Thus, h-channels contribute to between-species differences in a fundamental neuronal property.

Keywords: Human; gene expression; h-channel; intrinsic membrane properties; mouse; neuron model; oscillations; patch-clamp physiology; pyramidal neuron.


Conflict of interest statement

Declaration of Interests

The authors declare no competing interests

Figures

Figure 1 –
Figure 1 –. HCN1–4 RNA expression in human versus mouse neocortex.
A) Single nucleus HCN channel subunit mRNA expression in excitatory neurons from human temporal cortex arranged by layer. Violin plots represent distribution of mRNA expression on a log scale with a maximum counts per million (CPM) of introns + exons value of 4000. For reference, single nucleus HCN channel subunit mRNA expression in inhibitory neurons, aggregated across all layers, is also shown. B) Single cell HCN channel subunit mRNA expression in excitatory neurons from mouse visual cortex arranged by layer. The expression of SLC17A7 (magenta), GAD2 (turquoise), and HCN1 (yellow) was assessed by mFISH in C) mouse temporal association area (TeA), as well as D) human middle temporal gyrus (MTG). In layers 2 and 3 of mouse TeA (c1, c1’, c1’’, c2, c2’,c2’’,), Hcn1 expression in excitatory neurons is low compared with expression in L5 (c3, c3’,c3’’). HCN1 expression is high in Gad2-expressing inhibitory cells in all layers of mouse TeA (note, L4 is not prominent in mouse TeA). In human MTG HCN1 expression is prominent in excitatory and inhibitory neurons in the supragranular and infragranular layers (d1-d3’’). Large white dots reflect fluorescence from lipofuscin. Images with ‘’, are the same as images with ‘, but signals from each probe are color coded for clarity. E) RNA-counts per cell as a function of depth from pial surface in human and mouse. Scale bars in C,D = 200 μm. Scale bars in c1’-d3’’= 50 μm. Images in panels C and D are from composite images.
Figure 2 –
Figure 2 –. Human and mouse supragranular pyramidal neurons display different subthreshold membrane properties.
Example voltage sweeps obtained from a superficial and deep supragranular pyramidal neuron in response to hyperpolarizing and depolarizing current injections in A) mouse TeA and B) human middle temporal gyrus. C) In mouse cortex, resting membrane potential and input resistance increase as a function of somatic distance from pia. D) In the supragranular layers of human middle temporal gyrus resting potential increases, but input resistance decreases as function of somatic distance from pia. Arrows correspond to sample voltage sweeps in A & B E) Resting potential and input resistance in mouse versus human cortex as a function of normalized somatic position in supragranular cortex. F) Data were binned into quarters based on the normalized distance of the soma from pia, where 1 is the most superficial quadrant and 4 is the deepest. Data are presented as mean ± SEM. * p < 0.0125, mouse versus human post-hoc t-test with Bonferroni correction.
Figure 3 –
Figure 3 –. Ih-related membrane properties are more pronounced in human compared with mouse supragranular pyramidal neurons
A) Example voltage sweeps were obtained from current injections that yielded ~ 6 mV hyperpolarization in A) mouse and B) human supragranular pyramidal neurons. Arrows denote voltage sag and rebound potentials associated with Ih. C) Mouse neurons display little voltage sag or rebound in response to hyperpolarizing current injections. D) In contrast, rebound and sag were prominent in human supragranular cortex, especially in deep layer 3. Arrows correspond to sample voltage sweeps in A & B. E) Sag and rebound in mouse and human cortex as a function of normalized somatic position in supragranular cortex. F) Data binned into quadrants and presented as mean ± SEM. * p < 0.001 mixed factor ANOVA effect of species.
Figure 4 –
Figure 4 –. Mouse and human supragranular pyramidal neurons display different subthreshold filtering properties.
Example voltage responses to a chirp stimulus current injection in a superficial and deep supragranular pyramidal neuron in A) mouse and B) human cortex. Impedance amplitude profile (ZAP) and normalized frequency response curves are also shown for these example neurons. Dotted lines mark the resonant frequency in the ZAP and the 3dB cutoff in the normalized frequency response curves. C) Mouse neurons were largely non-resonant and became more low-pass as a function of somatic depth from pia. D) Resonant frequency correlated with somatic depth from pia in human cortex. Additionally, in human cortex, 3dB cutoff frequency was correlated with somatic depth from pia. Arrows correspond to sample voltage sweeps in A & B. E) Resonant frequency and 3dB cutoff as a function of normalized depth from pia in mouse and human supragranular cortex. F) Data binned into quadrants and presented as mean ± SEM. For binned resonant frequency data * p < 0.001 mixed factor ANOVA effect of species. For binned 3 dB cutoff data * p < 0.0125, mouse versus human post-hoc t-test with Bonferroni correction.
Figure 5 –
Figure 5 –. Excitability of mouse versus human pyramidal neurons as a function of somatic distance from pia.
A) The number of APs elicited by a given current injection increased as a function of somatic depth from pia in supragranular mouse cortex. Example sweeps obtained from a superficial and deep neuron in response to 250, 500 and 750 pA are shown. B) The number of APs elicited by a given current injection decreased as a function of somatic depth from pia in supragranular human cortex. Example sweeps obtained from a superficial and deep neuron in response to 250, 500 and 750 pA are shown. Arrows correspond to sample voltage sweeps in A & B. C) Average firing rate as a function of normalized position within supragranular cortex in mouse versus human. D) Data binned into quadrants and presented as mean ± SEM. * < 0.0125 mouse versus human post-hoc t-test with Bonferroni correction.
Figure 6 –
Figure 6 –. Pharmacological evidence for Ih in human supragranular pyramidal neurons.
A) Bath application of 10 μM ZD7288 hyperpolarized human neurons by ~8 mV (p < 0.001, Bonferroni’s post hoc comparison), but no consistent change in mouse neurons was observed (p = 0.56, Bonferroni’s post hoc comparison). The plot at the left shows RMP as a function of time for two example recordings. B) 10 μM ZD7288 produced an increase in input resistance in human and mouse supragranular pyramidal neurons (p < 0.001, MixedANOVA effect of ZD7288). The percent change in input resistance was larger in human compared with mouse (p < 0.001, t-test). Example voltage responses to hyperpolarizing current injections are shown to the left. C) 10 μM ZD7288 increased the excitability of human (p < 0.001, RM ANOVA), but not mouse pyramidal neurons (p = 0.13, RM ANOVA). Plots are averages from 11 human neurons from 4 patients and 10 mouse neurons from 6 animals. Data are presented as mean ± SEM.
Figure 7 –
Figure 7 –. Ih affects the subthreshold integrative properties of a morphologically precise human L3 pyramidal neuron model.
A) Voltage response elicited by somatic chirp stimulus of a L3 pyramidal neuron (green), biophysical model with Ih (red) and biophysical model without Ih. B) Power spectrum of somatic membrane potential response to chirp stimulus shown in A) (blue: experiment; green: Ih(+) model; red: Ih(−) model). C) Morphological reconstruction of a human L3 pyramidal neuron used for the simulations D) Single (left) or bursts (right) of AMPA-like conductances were injected at single synaptic locations (top) and the resultant local dendritic and propagated somatic voltage response were recorded in the Ih(+) (blue) and the Ih(−) model (red). The locations of 18 separate synaptic inputs are shown in panel C). E) The delay between the maximal amplitude of AMPA-like conductance and EPSPs peak recorded at the soma as a function of synaptic distance from soma in the Ih(+) (blue) and the Ih(−) model. F) Synaptic delays and half-width of the EPSPs calculated for Ih(+) and Ih(−) models. G) The integral of EPSPs recorded at the soma in response to bursts of synaptic input at various frequencies. The somatic response in the Ih(+) model was decreased relative to the Ih(−) model across several frequencies of synaptic input. H) Power spectrum of the somatic membrane potential of the Ih(+) and Ih(−) model when stimulated by 1000 synapses randomly located along the apical dendrite C). Black stripes correspond to statistically significant differences in the power spectrum (2 sample Kolmogorov-Smirnov test; p<0.01). Inset: location of a subset (100 out of 1000) synapses is shown. Data are presented as mean ± SD.

Similar articles

Cited by

References

    1. Andrasfalvy BK, and Magee JC (2001). Distance-dependent increase in AMPA receptor number in the dendrites of adult hippocampal CA1 pyramidal neurons. Journal of Neuroscience 21, 9151–9159. - PMC - PubMed
    1. Angelo K, London M, Christensen SR, and Hausser M (2007). Local and Global Effects of Ih Distribution in Dendrites of Mammalian Neurons. Journal of Neuroscience 27, 8643–8653. - PMC - PubMed
    1. Angevine JB, and Sidman RL (1961). Autoradiographic study of cell migration during histogenesis of cerebral cortex in the mouse. Nature 192, 766–768. - PubMed
    1. Bean BP (2007). The action potential in mammalian central neurons. Nat Rev Neurosci 8, 451–465. - PubMed
    1. Brennan GP, Baram TZ, and Poolos NP (2016). HyperpolarizationActivated Cyclic Nucleotide-Gated (HCN) Channels in Epilepsy. Cold Spring Harb Perspect Med 6, a022384. - PMC - PubMed

Publication types

MeSH terms

Substances

LinkOut - more resources