

Intrinsic Functional Network Connectivity Is Associated With Clinical Symptoms and Cognition in Late-Life Depression
- PMID: 30392844
- PMCID: PMC6368882
- DOI: 10.1016/j.bpsc.2018.09.003
Intrinsic Functional Network Connectivity Is Associated With Clinical Symptoms and Cognition in Late-Life Depression
Abstract
Background: Late-life depression (LLD) has been associated with alterations in intrinsic functional networks, best characterized in the default mode network (DMN), cognitive control network (CCN), and salience network. However, these findings often derive from small samples, and it is not well understood how network findings relate to clinical and cognitive symptomatology.
Methods: We studied 100 older adults (n = 79 with LLD, n = 21 nondepressed) and collected resting-state functional magnetic resonance imaging, clinical measures of depression, and performance on cognitive tests. We selected canonical network regions for each intrinsic functional network (DMN, CCN, and salience network) as seeds in seed-to-voxel analysis. We compared connectivity between the depressed and nondepressed groups and correlated connectivity with depression severity among depressed subjects. We then investigated whether the observed connectivity findings were associated with greater severity of common neuropsychiatric symptoms or poorer cognitive performance.
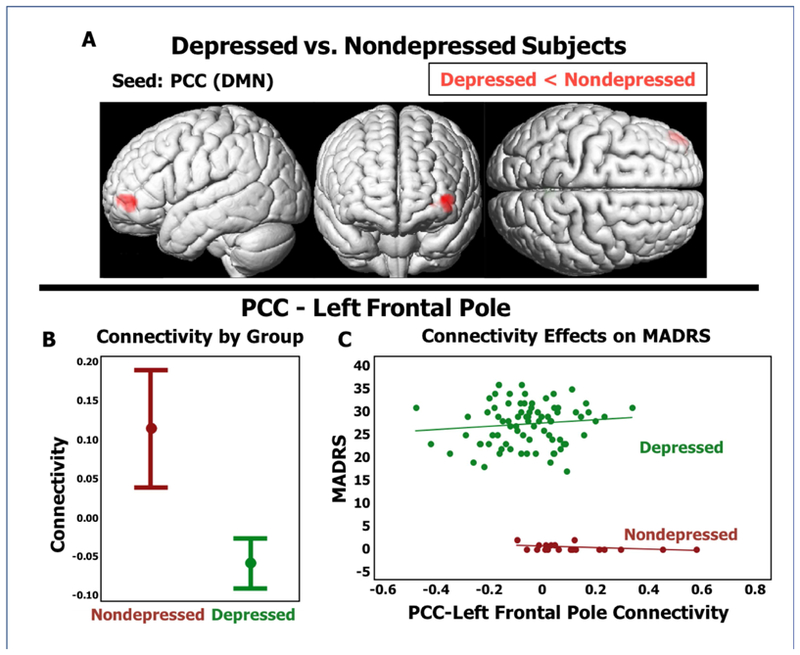
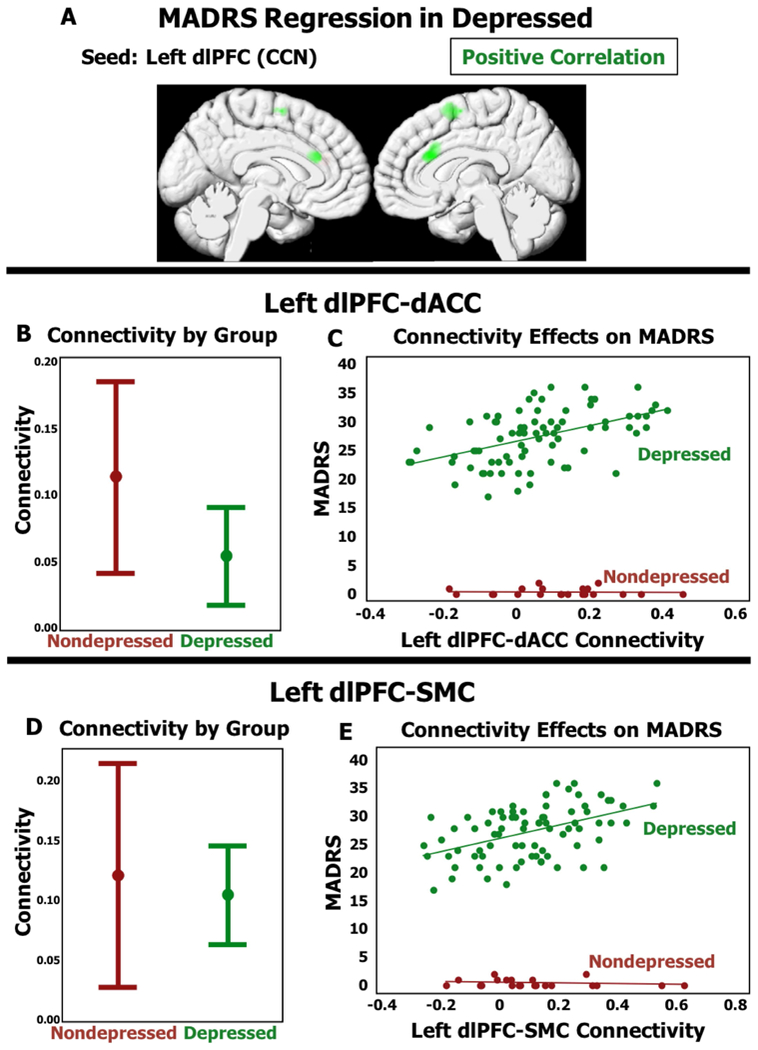
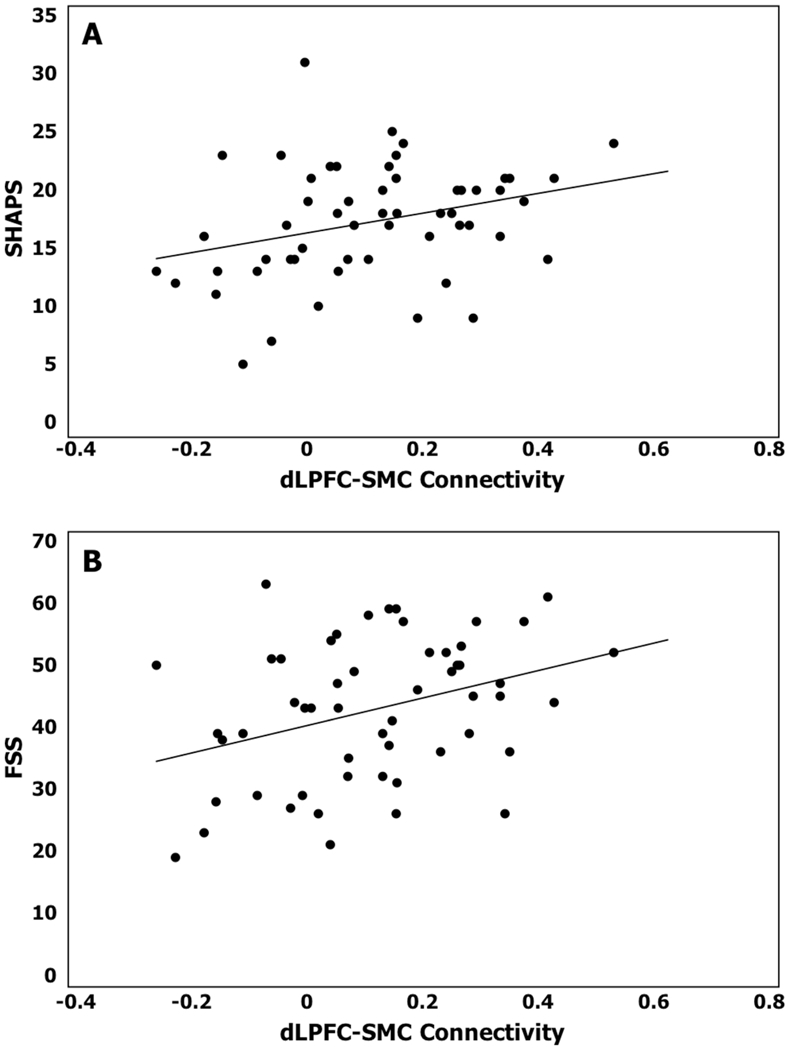
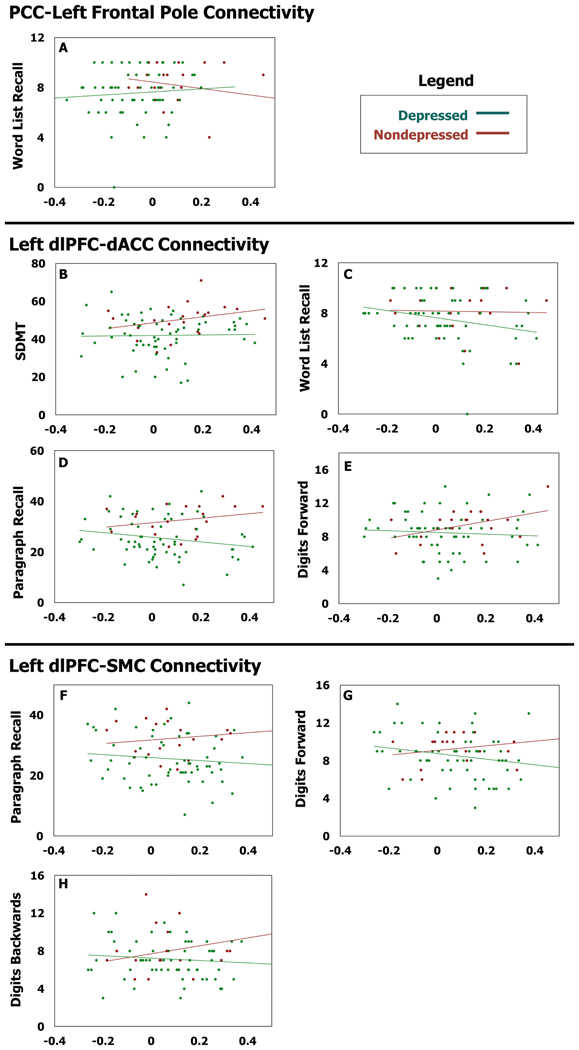
Results: LLD was characterized by decreased DMN connectivity to the frontal pole, a CCN region (Wald χ21 = 22.33, p < .001). No significant group differences in connectivity were found for the CCN or salience network. However, in the LLD group, increased CCN connectivity was associated with increased depression severity (Wald χ21 > 20.14, p < .001), greater anhedonia (Wald χ21 = 7.02, p = .008) and fatigue (Wald χ21 = 6.31, p = .012), and poorer performance on tests of episodic memory (Wald χ21 > 4.65, p < .031), executive function (Wald χ21 = 7.18, p = .007), and working memory (Wald χ21 > 4.29, p < .038).
Conclusions: LLD is characterized by differences in DMN connectivity, while CCN connectivity is associated with LLD symptomology, including poorer performance in several cognitive domains.
Keywords: Aging; Cognition; Cognitive control network; Default mode network; Functional connectivity; Geriatric.
Published by Elsevier Inc.
Conflict of interest statement
The authors report no biomedical financial interests or potential conflicts of interest.
Figures
References
-
- Taylor WD (2014): Depression in the Elderly. N Engl J Med 371: 1228–1236. - PubMed
-
- Tadayonnejad R, Ajilore O (2014): Brain network dysfunction in late-life depression: a literature review. J Geriatr Psychiatry Neurol 27: 5–12. - PubMed
-
- Mulders PC, van Eijndhoven PF, Schene AH, Beckmann CF, Tendolkar I (2015): Resting-state functional connectivity in major depressive disorder: A review. Neurosci Biobehav Rev 56: 330–344. - PubMed
Publication types
MeSH terms
Grants and funding
LinkOut - more resources
Full Text Sources
Other Literature Sources
