. 2018 Nov 15;175(5):1307-1320.e22.
doi: 10.1016/j.cell.2018.10.008. Epub 2018 Nov 1.

T Helper Cell Cytokines Modulate Intestinal Stem Cell Renewal and Differentiation

Affiliations

T Helper Cell Cytokines Modulate Intestinal Stem Cell Renewal and Differentiation

Moshe Biton et al. Cell. .

Abstract

In the small intestine, a niche of accessory cell types supports the generation of mature epithelial cell types from intestinal stem cells (ISCs). It is unclear, however, if and how immune cells in the niche affect ISC fate or the balance between self-renewal and differentiation. Here, we use single-cell RNA sequencing (scRNA-seq) to identify MHC class II (MHCII) machinery enrichment in two subsets of Lgr5+ ISCs. We show that MHCII+ Lgr5+ ISCs are non-conventional antigen-presenting cells in co-cultures with CD4+ T helper (Th) cells. Stimulation of intestinal organoids with key Th cytokines affects Lgr5+ ISC renewal and differentiation in opposing ways: pro-inflammatory signals promote differentiation, while regulatory cells and cytokines reduce it. In vivo genetic perturbation of Th cells or MHCII expression on Lgr5+ ISCs impacts epithelial cell differentiation and IEC fate during infection. These interactions between Th cells and Lgr5+ ISCs, thus, orchestrate tissue-wide responses to external signals.

Keywords: ISCs; MHC class II; MHCII; T helper; T regulatory; T(reg); Th; epithelial differentiation; gut biology; intestinal stem cells; mucosal immunity; scRNA-seq; single cell RNA-seq; stem cell renewal; tuft cells.


Figures

Figure 1.
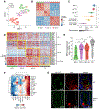
Figure 1.. ScRNA-seq reveals MHCII expression in subsets of Lgr5+ ISCs.
A,B. Three subsets of Lgr5+ ISCs. A t-distributed stochastic neighbor embedding (tSNE) (A) and correlation matrix (B) of 637 ISCs identified by clustering of 1,522 cells by scRNA-seq. Color code: kNN-graph clusters and post-hoc annotation. Heatmap (B) shows the Pearson correlation coefficient (r, color bar) between cell scores along the first 10 principal components. C. Differentiation pseudotime of ISC subsets. Distribution of DC-1 scores (“differentiation”, x-axis) for each cell cluster (y-axis). Black bar: mean. *** p<0.0001, Mann-Whitney U-test. D. Gene signatures of ISC subsets. Relative expression level (row-wise Z-score of log2(TPM+1) values, color bar) in 637 ISCs and 201 TA (columns, color code as in (A)) of 10 representative genes of ISCs or ISC subsets (rows). E. MUCII expression in ISCs. Distributions of mean expression levels (log2(TPM+1), y-axis) of MHCII genes (STAR Methods) in each ISC subset and dendritic cells (DC) (Shalek et al., 2014). F. Enriched MHCII gene expression in ISCs. Relative mean expression (row-wise Z-score of log2(TPM+1) values, color bar) of MHCII-related genes (rows) in each IEC type (columns). EP: Enterocyte progenitor, EEC: enteroendocrine cell. G. MHCII expression in situ. IFA co-stain of MHCII (I-A/I-E; green) and the Paneth cell marker Lyzl (red) in intestinal crypts of WT (top) and MHCII KO (bottom) mice. Yellow arrows: MHCII-expressing cells. Scale bar, 20μm.
Figure 2.
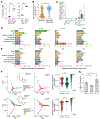
Figure 2.. Antigen presentation by ISCs and the impact of Th cytokines on IEC differentiation.
A. IECs process ovalbumin antigen. Proportion of cells positive for DQ-ovalbumin (DQ-Ova) (y-axis) among EpCAM+ cells (left) and DCs (right) incubated with 10μg of DQ-Ova (x-axis). n=3 mice, ***p<0.01, t-test, error bars: SEM. B. DQ-Ova+ IECs are enriched for ISCs. Distribution of ISC signature scores in scRNA-seq of EpCAM+ or EpCAM+ DQ-Ova+ cells (***p<0.001, Wilcoxon test). C. Lgr5+ ISCs interact with and activate naïve Th cells. Relative quantification (RQ) of IL-2 secreted in the media (y-axis) of naïve OTII cells cultured alone or with EpCAM+GFP, EpCAM+GFP+ (Lgr5+ ISC) or DCs with or without 15μg/mL Ova peptide (n=9 mice, * p<0.05, t-test, error bars: SEM). All groups were compared to EpCAM+GFP +Ova group. D,E. Changes in IEC composition in organoids treated with cytokines (D) or co-cultured with polarized Th cells (E). Relative abundance (odds-ratio, y-axis) of each IEC-type (by clustering, STAR Methods) under each condition vs. their proportions in control organoids (dashed line). * p <0.01, ** p <10−4 (hypergeometric test, error bars: 95% confidence interval for the odds ratio). F. IL-10 reduces and IL-13 increases ISC differentiation in organoids. Left and Middle: Diffusion maps for control and IL-10 (top) or IL-13 (bottom) treated organoids. Cells (points) colored by type (left; inset: stem cells) or condition (middle). Right: Distribution of cells (points) along the differentiation pseudotime (STAR Methods). *** p << 10−5, Mann-Whitney U-test. G. Cytokine pre-treatment alters clonogenicity. Relative clonogenicity of organoid cultures (y-axis) of equal organoids number re-seeded post-IL-10 or IL-13 treatment (x-axis). Dots: technical replicates. Error bars: SD, * p<0.05, *** p<0.0005, t-test.
Figure 3.
Figure 3.. Lgr5+ ISC pool expands following epithelial specific ablation of MHCII.
A. MHCII expression in IECs of MHCIIΔgut mouse. IFA of Lyzl (red) and MHCII (I-A/I-E, green). Inset, x5 magnification. Yellow arrows: MHCII+ cells in LP. Scale bar, 50μm. B. Increased Lgr5 expression in crypts of MHCIIΔgut mice. Representative single molecule FISH (smFISH, left) and quantification (right) of Lgr5 expression (red) within intestinal crypts of MHCIIfl/fl and MHCIIΔgut mice. Scale bar, 20μM. n=2 mice, 8 fields per mouse. Error bars: SEM (* p<0.05, t-test). C. Increased ISC pool in MHCIIΔgut mice. Fraction of ISCs out of EpCAM+ cells (y-axis, from scRNA-seq clustering) in MHCIIfl/fl and MHCIIΔgut mice (points, x-axis). Error bars: SEM. (* FDR<0.05, likelihood-ratio test). D. Decreased ISC-II and -III scores in MHCIIΔgut mice. Fraction of ISCs expressing a signature (circle size) and the signature’s mean score in those expressing cells (color bar) for each ISC subset signature (rows) in each genotype (columns). * p<0.05, Mann-Whitney U-test. E. Th cell number reduction in crypt LP of MHCIIΔgut mice. Combined smFISH and IFA of small intestine from MHCIIfl/fl and MHCIIΔgut mice. Left: representative images; yellow arrow: CD4+ cell adjacent to Lgr5+ ISCs; scale bar, 50μm; Inset, x3 magnification. Right: relative quantification (RQ, y-axis) of the number of CD4+ cells per crypt LP/total LP. n=3 mice, 8 fields per mouse (*** p<0.0001, t-test, error bars: SEM). F. H2-Ab1 is deleted in GFP+Lgr5+ ISCs and their progeny. Combined smFISH and IFA in IECs emerging from GFP labeled crypts (dashed line) vs. non-labeled crypts. High expression of H2-Ab1 is found in both the non-labeled crypts and in the LP. Scale bar: 50μm. G,H. Increased Lgr5+ ISC fraction in MHCIIΔISC. G. Bar plot of the percentage (y-axis, by FACS, see also Figure S4H) of GFPhigh cells in MHCIIΔISC or matching non-tamoxifen induced controls (MHCIIΔISC (no Tam)). n=5 mice, * p<0.015. H. Combined smFISH and IFA of 10 days tamoxifen (MHCIIΔISC) and non-tamoxifen (MHCIIΔISC (no Tam)) -induced mice. Left: representative images; scale bar, 50μm. Right: Number of Lgr5+ ISCs (GFPhigh) per crypt (y-axis). n=3 mice, 8 fields per mouse (*** p<0.0001, t-test, error bars: SEM). I. Lgr5+ ISCs of MHCIIΔISC mice do not activate naïve Th cells in co-culture. IL-2 secreted in the media (RQ, y-axis) of naïve OTII cells cultured with Lgr5+ ISCs from MHCIIΔISC or non-tamoxifen MHCIIΔISC controls (no Tam) in presence of 15μg/mL Ova peptide (n=3 mice, * p<0.05, t-test, error bars: SEM). Each group was compared to the EpCAM+GFP group (as in Figure 2C).
Figure 4.
Figure 4.. IEC remodeling under pathogenic infection driven by shifts in ISCs.
A,B. Reduced stemness and increased MHCII expression scores in ISCs during pathogenic infection. Distribution of stemness signature (A) and MHCII expression (B) scores (y-axis) in 1,857 ISCs from scRNA-seq (Haber et al., 2017). ** p<0.01, *** p <10−5 (Mann-Whitney U-test). C,D. Shifts in ISC subsets under infection. C. Fraction of ISCs expressing a signature (circle size) and the signature’s mean score in those expressing cells (color bar) for each ISC subset signature (rows) in each condition (columns). *p<0.001, **p<10−5, ***p<10−10, Mann-Whitney U-test. D. Combined smFISH and IFA of crypts at homeostasis (left) and two days post-infection (right). Green arrow: Cyp2e1+ cell, red arrow: PSRC1+ cell; scale bar: 50μm. Cyp2e1: ISC-I marker (green), Psrc1: ISC-III marker (red). E. α-MHCII leads to changes in cell proportions. Right: Frequencies (y-axis, unsupervised clustering) of each cell subtype (x-axis) in mice infected with H. polygyrus and treated with either α-MHCII (white bars) or with α-IgG (grey bars). *** p<10−10 (likelihood-ratio test). Left: schematic summary of changes in cell proportions in each cell type (node) (red: increase, blue: decrease; scale bar, bottom). Bold outline: statistically significant; * proliferating cells. F. Reduction in tuft cell and increase in Lgr5+ ISC proportions following α-MHCII during H. polygyrus infection. Frequency of cells expressing Chgb, Delh1 or Lgr5 by scRNA-seq (y-axis) 3 days post-infection and treated with either α-IgG or α-MHCII (x-axis). * FDR<0.1, ** FDR<0.01 (likelihood-ratio test). Error bars: SEM.
Figure 5.
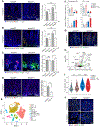
Figure 5.. Deletion of epithelial MHCII disrupts mucosal immune responses.
A,B. H. polygyrus-induced tuft cell hyperplasia is abolished in IEC-MHCII KO mice. Left: Representative images of combined smFISH and IFA of proximal SI from MHCIIfl/fl and MHCIIgut−/− (A) or MHCIIfl/fl and MHCIIΔISC (B) at 4 days (A) or 10 days (B) post-infection. A. Scale bar, 50μm; Yellow arrows: Dclk1+ cells emerging from the crypt. B. scale bar, 50μm. Yellow arrows; mature Trpm5+ villus tuft cells. Dashed line: a crypt in which GFP is absent and ISCfl/fl reside due to the mosaic knockout in MHCIIΔISC This crypt-villus axis is associated with higher tuft cell numbers. Right: Number of Dclk1+ (A) or Trpm5+ (B) tuft cells per crypt-villus axis (y-axis). n=3 (A) or 4 (B) mice per group, 10 fields per mouse (NS: not significant, * p<0.05, *** p<0.0001, t-test, error bars: SEM). C. H. polygyrus infection increases Lgr5 expression in MHCIIσISC mice. Left: Representative images of combined smFISH and IFA of proximal SI from MHCIIfl/fl and MHCIIΔISC mice 10 days post-infection. Scale bar, 50μm. Right: Number of Lgr5 mRNA molecules per crypt (y-axis). n=4 mice, 10 fields per mouse (NS: not significant, * p<0.05, t-test, error bars: SEM). D. Reduced number of crypt Th cells in MHCIIgut−/− mice 4 days post-infection. Left: representative images from combined smFISH and IFA of SI from MHCIIfl/fl and MHCIIgut−/− mice. Scale bar, 50μm. Yellow arrows: CD4+ cells in close proximity to Lgr5+ cells. Right: Relative quantification (RQ) of CD4+ cells per crypt LP/total LP (y-axis). n=3 mice per genotype, 10 fields per mouse (***p<0.0001, t-test, error bars: SEM). E. LP immune cell types by scRNA-seq. tSNE of 24,649 CD45+ LP cells at homeostasis and 4 days post-infection (n=12 mice), colored by clustering and annotated post-hoc (STAR Methods). F,G. Increased APC proportions in MHCIIgut−/− mice 4 days post-infection. F. Fraction of immune subsets by clustering (from E, y-axis) of MHCIIfl/fl and MHCIIgut−/− mice (points) at homeostasis and 4 days post-infection (x-axis, color code). Error bars: SEM. (* FDR<0.05, ** FDR<0.005, likelihood-ratio test). G. Representative IFA images of SI from MHCIIfl/fl and MHCgut−/− 4 days post-infection. Scale bar, 50μm; yellow arrows: double positive cells, red arrows: CD11cMHCII+ cells. H-J. Increased Th cell activation in MHCgut−/− at homeostasis. H. Mean log2 fold-change (x-axis) and significance (−log10(FDR)) of DE genes between Th cells of MHCIIgut−/− mice (765 cells, n=3 mice) and MHCIIfl/fl controls (385 cells, n=3 mice) at homeostasis. Green/red dots: up/down-regulated Th cell activation genes (FDR<0.05, likelihood-ratio test). I. Distribution of Th cell activation signature scores (y-axis) in 1,319 cells from MHCIIgut−/− (846 cells, n=3 mice) and MHCIIfl/fl controls (473 cells, n=3 mice) at homeostasis and 4 days post-infection (color legend). White bars: mean. *** p<10−5, NS: not significant, Mann-Whitney U-test. J. Representative images of IFA of SI villi of MHCIIfl/fl and MHCIIgut−/− mice at homeostasis (top) and 4 days post-infection (bottom). Scale bar, 50μm, arrow: CD25+ CD4+ cell.
Figure 6.
Figure 6.. Treg ablation decreases the Lgr5+ ISC pool.
A. Increase in CD4+ cells in Treg ablated crypts. Combined smFISH and IFA of SI from wild-type (WT) or Foxp3-DTR mice treated with diphtheria toxin (DT) for 4 or 7 days. Left: representative images. Arrows: CD4+ cells adjacent to Lgr5+ ISCs; scale bar, 50μm. Right: Relative quantification (RQ) of CD4+ cells per crypt LP/total LP (y-axis). n=2 mice, 8 fields per mouse per time point (*p<0.02, ** p<0.0003, t-test, error bars: SEM). B. Depletion of mature enterocytes post-Tregs ablation. Combined IFA and smFISH of SI in WT and Foxp3-DTR mice treated with DT. Lct: mature enterocyte marker, Creb3l3 and Cenpf: early enterocyte markers (Haber et al., 2017). Green, red, white arrows: Lct+, Cenpf+, and Creb313+ cells, respectively. Scale bar, 50μm. C. Reduction in ISC numbers following Treg ablation. Fraction of ISCs among EpCAM+ cells (y-axis, by clustering) in WT and Foxp3-DTR mice 7 days post-DT treatment. Error bars: SEM. (** FDR<0.005, likelihood-ratio test, STAR Methods). D. Reduced Lgr5 expression and increased cell proliferation following Treg ablation. Combined smFISH and IFA of SI from WT and Foxp3-DTR mice treated with DT for 4 or 7 days. Left: representative images. Yellow arrows: Mki67Lgr5+ ISCs, orange arrows: Mki67+Lgr5+ ISCs, scale bar, 50μm. Right: Number of Lgr5 (mid-right) and Mki67 (right) molecules per crypt (y-axes). n=2 mice, 8 fields per mouse per time point (*p<0.05, ** p<0.001, *** p< 0.0001 t-test, error bars: SEM). E-F. Increased MHCII expression in ISCs of Treg-depleted mice. E. IHC of MHCII (I-A/I-E; brown) co-stained with hematoxylin (blue) within the intestinal crypt of WT and Foxp3-DTR mice treated for 7 days with DT. Arrows: MHCII+Lgr5+ ISC. F. Distribution of the scores for cell cycle (left) and MHCII (right) genes in ISCs from WT (n=5; 464 cells) and Foxp3-DTR (n=4; 62 cells) mice 7 days post-DT. Squares: mean score per mouse; thick bar: overall mean; error bars: SEM. (* p<0.05, ** p<0.005, *** p<5×10⁻⁴, likelihood-ratio test). G. Changes in ISC subsets in Treg-depleted mice. Fraction of ISCs expressing a signature (circle size) and the signature’s mean score in those expressing cells (color bar) for each ISC subset signature (rows) in each genotype (columns). ** p<10−5, *** p<10−10, Mann-Whitney U-test.
Figure 7.
Figure 7.. A model of the cross-talk between Th cells and ISCs.
Th subsets (blue nodes) modulate (solid arrows) the fate (dashed arrows) of Lgr5+ ISCs (green). Tregs and their key cytokine IL-10 promote stem cell renewal, while Th17 cells and their cytokine IL-17a reduce stem cell renewal and promote differentiation. Both Th1 and Th2 (and their cytokines) suppress stem cell renewal and promote specific differentiation towards Paneth cells (tan) and tuft cells (orange), respectively.

Comment in

  • T cell help to stem cells.
    Bird L. Bird L. Nat Rev Immunol. 2018 Dec;18(12):730-731. doi: 10.1038/s41577-018-0089-0. Nat Rev Immunol. 2018. PMID: 30420703 No abstract available.
  • TH cells tune intestinal stem cell fate.
    Thoma C. Thoma C. Nat Rev Gastroenterol Hepatol. 2019 Jan;16(1):3. doi: 10.1038/s41575-018-0096-4. Nat Rev Gastroenterol Hepatol. 2019. PMID: 30523280 No abstract available.

References

    1. Agudo J, Park ES, Rose SA, Alibo E, Sweeney R, Dhainaut M, Kobayashi KS, Sachidanandam R, Baccarini A, Merad M, et al. (2018). Quiescent Tissue Stem Cells Evade Immune Surveillance. Immunity 48, 271–285 e275. - PMC - PubMed
    1. Ali N, Zirak B, Rodriguez RS, Pauli ML, Truong HA, Lai K, Ahn R, Corbin K, Lowe MM, Scharschmidt TC, et al. (2017). Regulatory T Cells in Skin Facilitate Epithelial Stem Cell Differentiation. Cell 169, 1119–1129 e1111. - PMC - PubMed
    1. Anthony RM, Rutitzky LI, Urban JF Jr., Stadecker MJ, and Gause WC (2007). Protective immune mechanisms in helminth infection. Nature reviews Immunology 7, 975–987. - PMC - PubMed
    1. Arpaia N, Green JA, Moltedo B, Arvey A, Hemmers S, Yuan S, Treuting PM, and Rudensky AY (2015). A Distinct Function of Regulatory T Cells in Tissue Protection. Cell 162, 1078–1089. - PMC - PubMed
    1. Aurora AB, and Olson EN (2014). Immune modulation of stem cells and regeneration. Cell Stem Cell 15, 14–25. - PMC - PubMed

Publication types

MeSH terms