. 2018 Dec 13;175(7):1769-1779.e13.
doi: 10.1016/j.cell.2018.09.054. Epub 2018 Nov 1.

Cell Membranes Resist Flow

Affiliations

Cell Membranes Resist Flow

Zheng Shi et al. Cell. .

Abstract

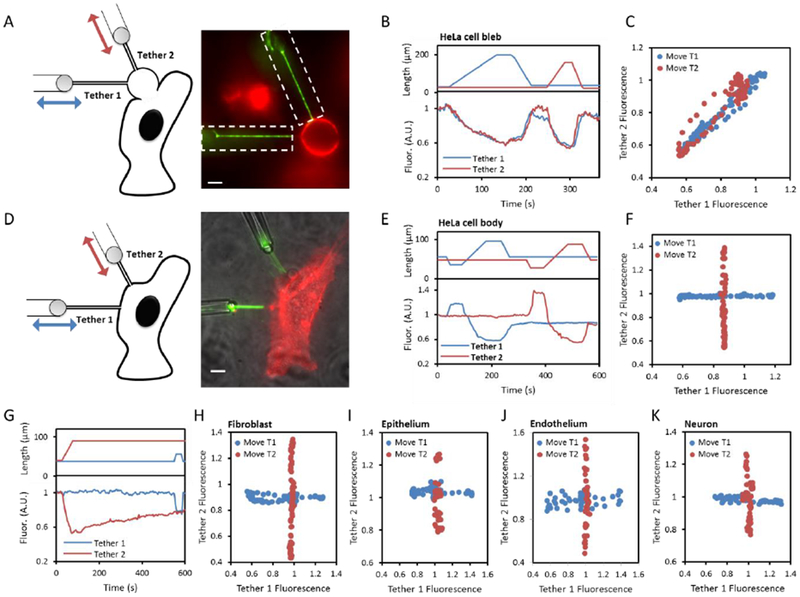
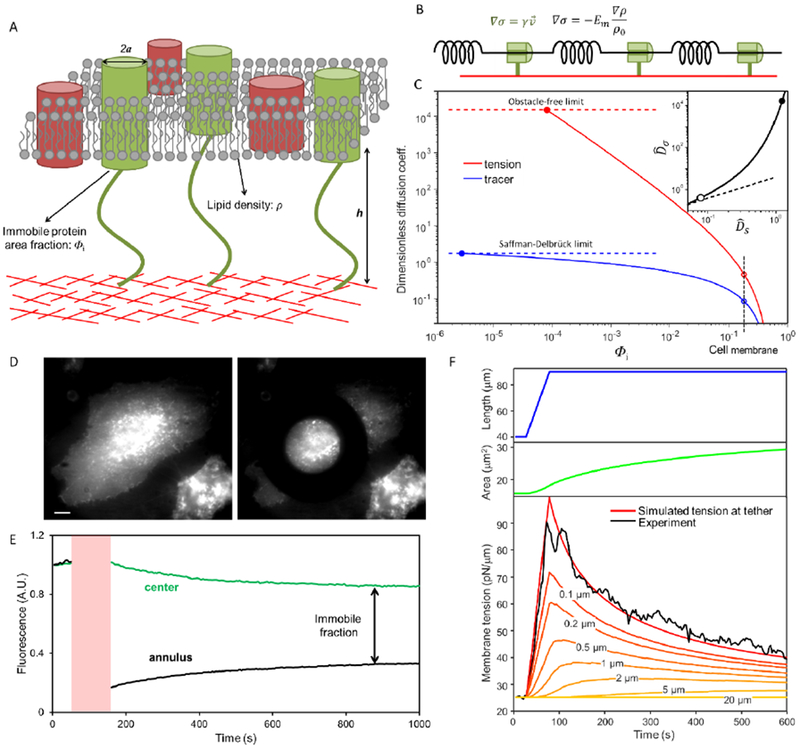
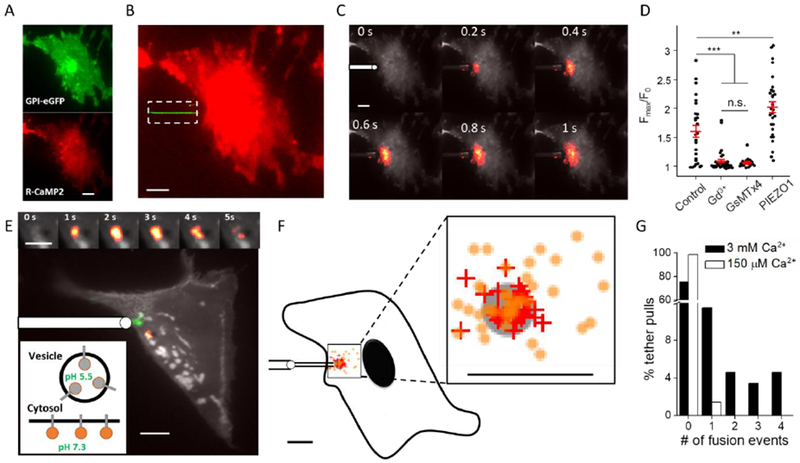
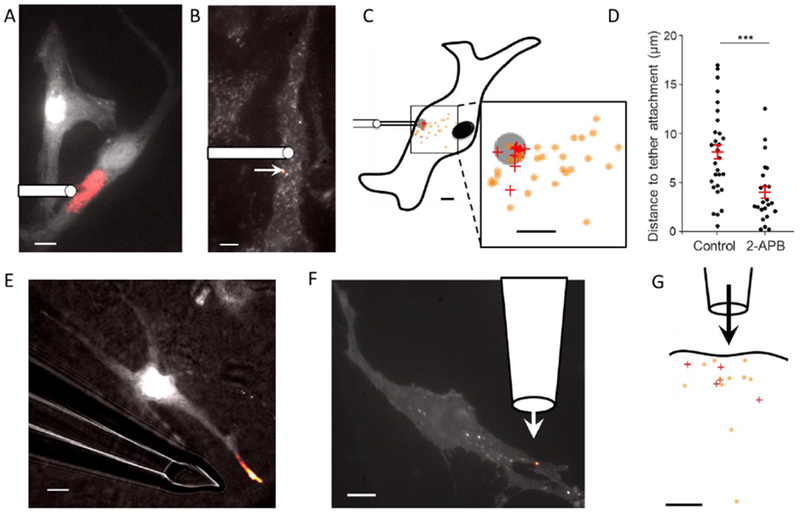
The fluid-mosaic model posits a liquid-like plasma membrane, which can flow in response to tension gradients. It is widely assumed that membrane flow transmits local changes in membrane tension across the cell in milliseconds, mediating long-range signaling. Here, we show that propagation of membrane tension occurs quickly in cell-attached blebs but is largely suppressed in intact cells. The failure of tension to propagate in cells is explained by a fluid dynamical model that incorporates the flow resistance from cytoskeleton-bound transmembrane proteins. Perturbations to tension propagate diffusively, with a diffusion coefficient Dσ ∼0.024 μm2/s in HeLa cells. In primary endothelial cells, local increases in membrane tension lead only to local activation of mechanosensitive ion channels and to local vesicle fusion. Thus, membrane tension is not a mediator of long-range intracellular signaling, but local variations in tension mediate distinct processes in sub-cellular domains.

Keywords: cell mechanics; membrane signaling; membrane tension; porous media; rheology.


Conflict of interest statement

DECLARITION OF INTERESTS

The authors declare no competing financial interests.

Figures

Fig. 1.
Fig. 1.. Propagation of membrane tension in cells.
A,D) Schematic (left) and fluorescence image (right) showing a pair of tethers pulled from (A) a cell-attached bleb or (D) the cell body of a HeLa cell expressing GPI-eGFP. Green: fluorescence under patterned illumination (restricted to dashed boxes). Red: fluorescence under wide-field illumination. In (D) a transmitted light image (grey) is combined with the fluorescence images. Scale bars 5 μm. B,E) The two tethers were stretched sequentially (top) and the fluorescence of each tether was monitored (bottom). C,F) Relation between the intensities of the two tethers when either the first or second tether was stretched. G) Test for slow coupling between tethers in a HeLa cell. A change in length of tether 2 did not affect fluorescence of tether 1 within a 500 s measurement window. H-K) Repetition of the experiment in (D-F) in H) NIH 3T3 fibroblasts, I) MDCK epithelial cells, J) mouse brain endothelial cells, and K) rat hippocampal neurons. T1: Tether 1, T2: Tether 2.
Fig. 2.
Fig. 2.. Hydrodynamic model of membrane flow past immobile obstacles.
A) Illustration of the cell plasma membrane with some transmembrane proteins bound to the underlying cortex. B) Simple viscoelastic model of the cell membrane. Springs represent the elastic response of the membrane to stretch, and dampers represent the viscous drag from immobile transmembrane proteins. C) Dependence of diffusion coefficients for membrane tension (red) and molecular tracers (blue) on the area fraction Φi of immobile proteins. This plot shows the model’s predictions for the dimensionless diffusion coefficients, D^σ=ηDσEma2 for tension and D^s=πηDskBT for tracers. The upper limit on tension diffusion is set by the hydrodynamic drag between plasma membrane and cytoskeleton cortex in the absence of obstacles. The upper limit on tracer diffusion is set by the Saffman–Delbrück model (Supplementary Discussion). Open circles: diffusion coefficients in intact cell membranes. Inset: Relation between dimensionless diffusion coefficients of membrane tension and molecular tracers (solid line). The dashed line shows a linear relation. Closed circles: obstacle-free membrane. Open circles: Φi = 0.18. D) Fluorescence image showing a HeLa cell in which transmembrane proteins have been labeled non-specifically with Alexa488-NHS before (left) and after (right) bleaching with a donut shape laser spot. Scale bar, 10 μm. E) Fluorescence intensity profile of the bleached ring (black) and non-bleached central (green) regions. The photobleaching epoch is shaded red. F) Comparison of simulation and experiment for time-dependent membrane tension in a stretched membrane tether and surrounding cell membrane (Em = 40 pN/μm; Dσ = 0.024 μm2/s). Top: tether stretch protocol with initial tension σ0 = 25 pN/μm, ramp increase in tether length from 40 μm to 90 μm at a pulling speed vpull = 1 μm/s. Middle: simulated surface area of the tether. Bottom: membrane tension in the tether inferred from measurements of tether radius (black) and simulated membrane tension in the tether and in the cell at distances of 0.1 μm to 20 μm from the tether. See Materials and Methods for details of the simulation.
Fig. 3.
Fig. 3.. Membrane tension mediates local activation of mechanosensitive ion channels and local vesicle fusion in MDCK cells.
A) MDCK cell co-expressing GPI-eGFP (green) and R-CaMP2 (red). B) Composite fluorescence image of tether (green) and R-CaMP2 (red). Fluorescence excitation of eGFP was confined to the tether (dashed box). C) Localized Ca2+ influx triggered by tether stretch. Images are composites of mean fluorescence (grey) and changes in fluorescence (heat map). Tether pulling pipette shown schematically at 0 s. D) Blockers of MSCs, GdCl3 (500 μM) or GsMTx4 (8 μM), suppressed Ca2+ influx during tether pulling. Over-expression of PIEZO1-mCherry increased Ca2+ influx during tether pulling (n = 27 cells in control extracellular buffer, n = 36 with GdCl3, n = 18 with GsMTx4, n = 31 with PIEZO1 over-expression, ** p<0.01, *** p < 10−3, n.s.: p > 0.5, Student’s t-test). Data points represent maximal fractional increase in fluorescence of Ca2+ reporter. Red lines: mean. Error bars: s.e.m. E) Composite fluorescence image of mean fluorescence (grey), changes in fluorescence after tether pull (heat map) and tether location (green). Tether pulling pipette shown schematically. Upper inset: close-up view of the vesicle fusion events triggered by tether stretch. Lower inset: membrane-tethered mOrange2-TM reported vesicle fusion via pH-mediated changes in fluorescence. F) Distribution of Ca2+ influx initiation points (+) and vesicle fusion (o) sites relative to the tether attachment point (grey circle). Each mark represents one event (33 Ca2+ influx events from 25 cells; 43 vesicle fusion events from 21 cells). Average distance between Ca2+ initiation and tether attachment was 1.7 ± 0.2 μm (mean ± s.e.m), smaller than the localization uncertainty (3 μm). Average distance between vesicle fusion site and tether attachment was 3.5 ± 0.4 μm (mean ± s.e.m), much smaller than the the null hypothesis of uniform fusion throughout the cell (27 ± 2 μm). The outline of the cell is a schematic to illustrate size. G) In control extracellular medium (3 mM Ca2+) tether pulling triggered fusion of one or more vesicles in 21 out of 87 trials (black). In low [Ca2+] buffer (150 μM Ca2+ buffered by EGTA) tether pulling triggered fusion of only one vesicle in 71 trials (white), establishing that elevated intracellular Ca2+ mediated vesicle fusion. Scale bars in all panels 10 μm, except 5 μm for the upper inset in (E).
Fig. 4.
Fig. 4.. Tension mediates local activation of mechanosensitive ion channels and local vesicle fusion in primary mouse brain endothelial cells.
A) Tether stretch triggered localized Ca2+ influx and B) vesicle fusion events. Images are composites of mean fluorescence (grey) and changes in fluorescence (heat map). Tether pulling pipette shown schematically. C) Distribution of Ca2+ influx (+) and vesicle fusion (o) sites relative to the tether attachment point (grey circle). Each mark represents one event (9 Ca2+ influx events from 7 cells; 29 vesicle fusion events from 6 cells). Average distance between Ca2+ initiation and tether attachment was 2.2 ± 0.5 μm (mean ± s.e.m), within the localization uncertainty (3 μm). Average distance between vesicle fusion and tether attachment was 8.0 ± 0.8 μm (mean ± s.e.m, vs. 28 ± 3 μm for null hypothesis). D) 2-APB (100 μM) significantly reduced the spread of vesicle fusion events relative to the tether attachment (3.9 ± 0.6 μm, n = 23 with 2-APB, *** p < 0.001. E-F) Local flow of extracellular buffer at 12 cm/s led to localized Ca2+ influx (E) and localized vesicle fusion (F). Images are composites of mean fluorescence (grey) and changes in fluorescence (heat map). In E, transmitted light shows the location of the pipette for flow delivery. G) Distribution of Ca2+ influx (+) and vesicle fusion (o) sites relative to the local flow. Each mark represents one flow-induced event (5 cells for Ca2+ influx; 11 fusion events from 4 cells for vesicle fusion). Scale bars in all panels 10 μm.

Comment in

References

    1. Bae C, Sachs F, and Gottlieb PA (2011). The mechanosensitive ion channel Piezo1 is inhibited by the peptide GsMTx4. Biochemistry (N. Y. ) 50, 6295–6300. - PMC - PubMed
    1. Basu R, Whitlock BM, Husson J, Le Floc’h A, Jin W, Oyler-Yaniv A, Dotiwala F, Giannone G, Hivroz C, Biais N, et al. (2016). Cytotoxic T cells use mechanical force to potentiate target cell killing. Cell 165, 100–110. - PMC - PubMed
    1. Bausch AR, Ziemann F, Boulbitch AA, Jacobson K, and Sackmann E (1998). Local measurements of viscoelastic pParameters of adherent cell surfaces by magnetic bead bicrorheometry. Biophys. J 75, 2038–2049. - PMC - PubMed
    1. Boulant S, Kural C, Zeeh J, Ubelmann F, and Kirchhausen T (2011). Actin dynamics counteract membrane tension during clathrin-mediated endocytosis. Nature Cell Biology 13, 1124. - PMC - PubMed
    1. Bussell SJ, Koch DL, and Hammer DA (1995). Effect of hydrodynamic interactions on the diffusion of integral membrane proteins: diffusion in plasma membranes. Biophys. J 68, 1836–1849. - PMC - PubMed

Publication types