

An mTOR Signaling Modulator Suppressed Heterotopic Ossification of Fibrodysplasia Ossificans Progressiva
- PMID: 30392977
- PMCID: PMC6235670
- DOI: 10.1016/j.stemcr.2018.10.007
An mTOR Signaling Modulator Suppressed Heterotopic Ossification of Fibrodysplasia Ossificans Progressiva
Abstract
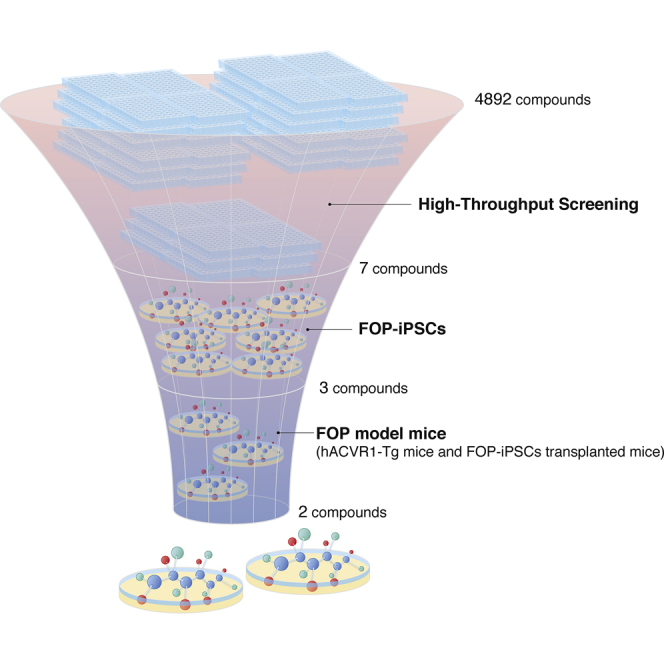
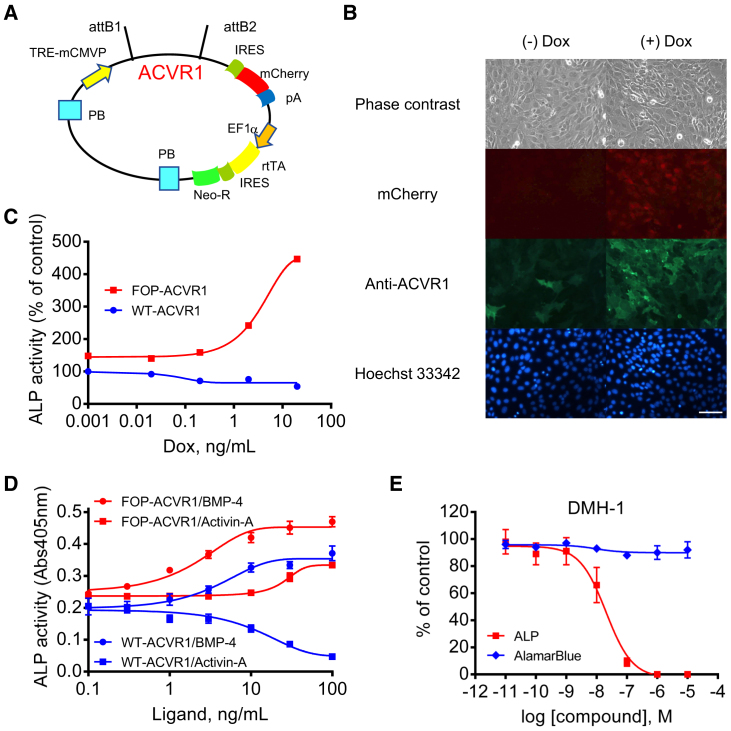
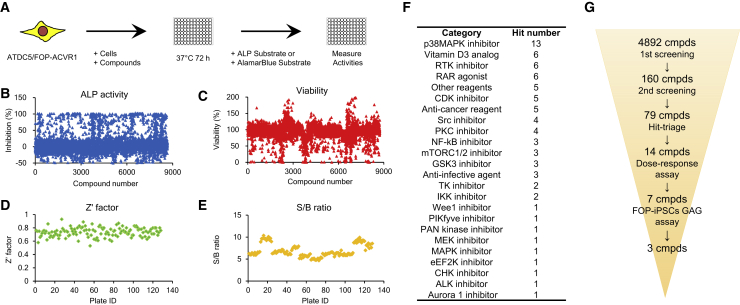
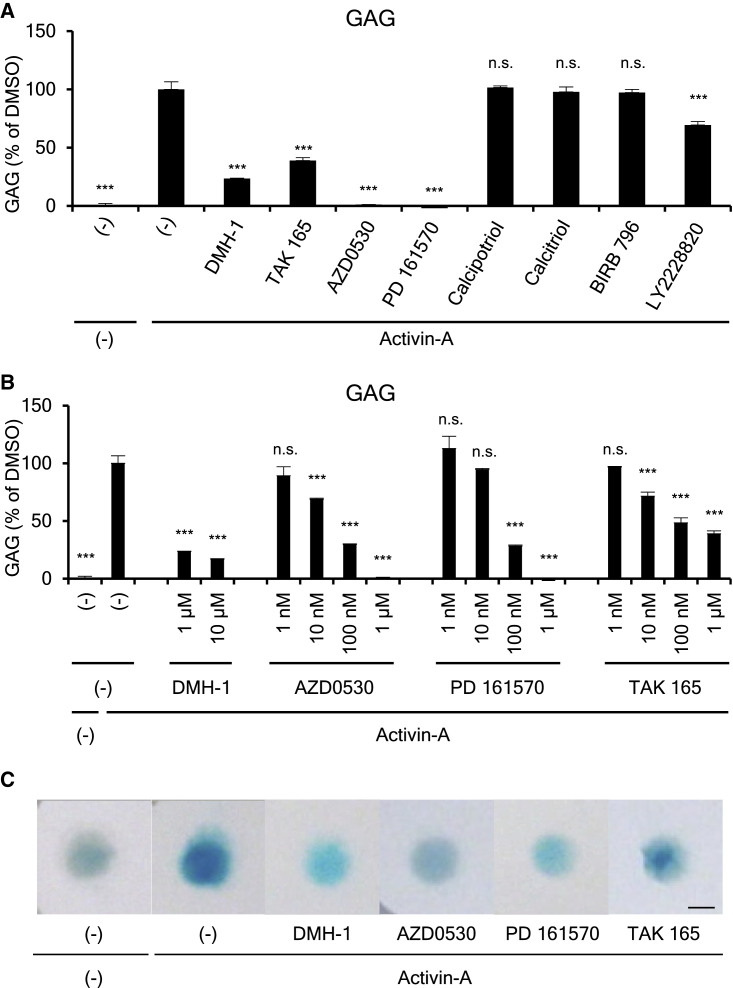
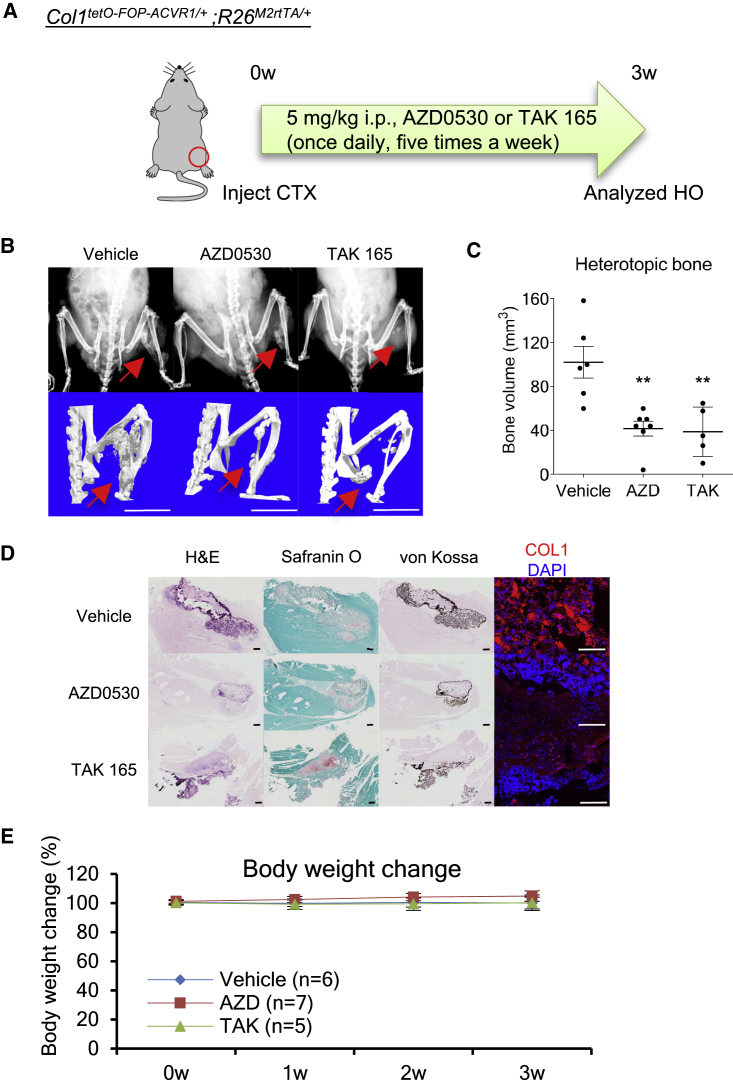
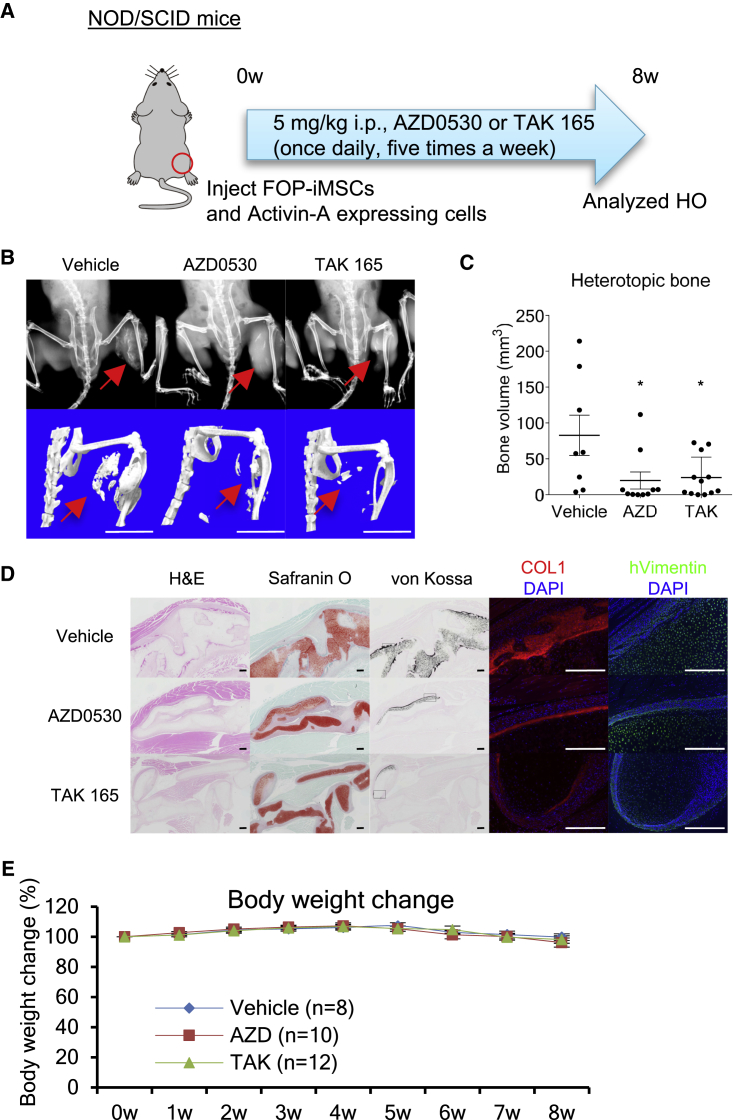
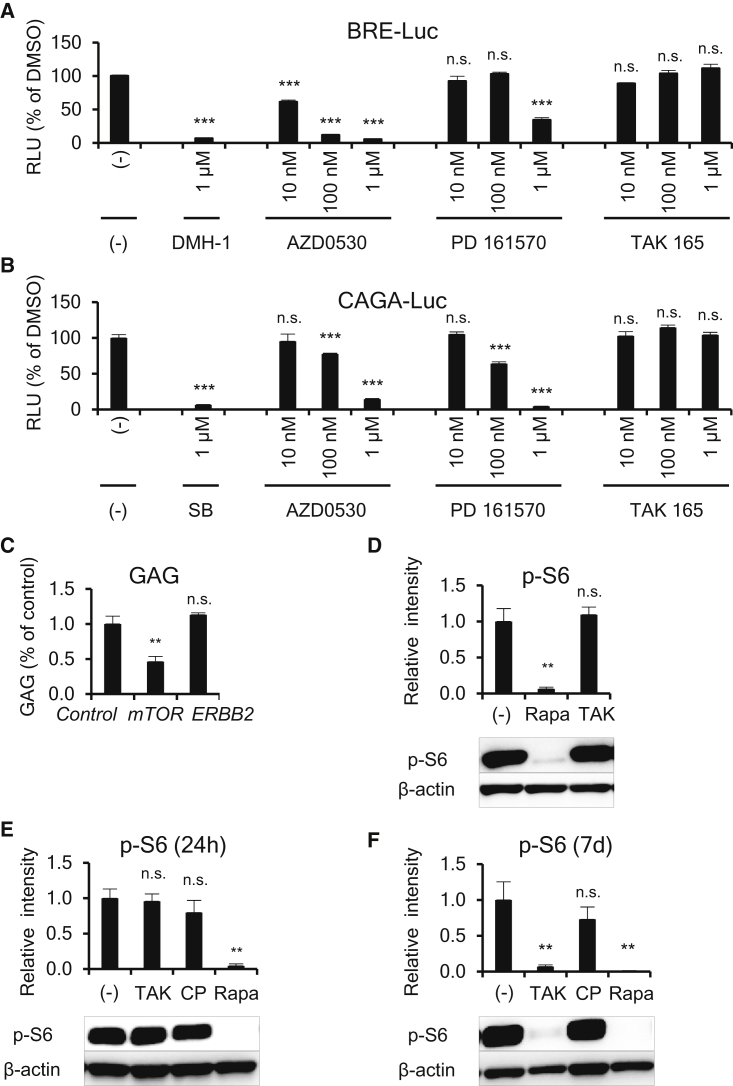
Fibrodysplasia ossificans progressiva (FOP) is a rare and intractable disorder characterized by extraskeletal bone formation through endochondral ossification. FOP patients harbor gain-of-function mutations in ACVR1 (FOP-ACVR1), a type I receptor for bone morphogenetic proteins. Despite numerous studies, no drugs have been approved for FOP. Here, we developed a high-throughput screening (HTS) system focused on the constitutive activation of FOP-ACVR1 by utilizing a chondrogenic ATDC5 cell line that stably expresses FOP-ACVR1. After HTS of 5,000 small-molecule compounds, we identified two hit compounds that are effective at suppressing the enhanced chondrogenesis of FOP patient-derived induced pluripotent stem cells (FOP-iPSCs) and suppressed the heterotopic ossification (HO) of multiple model mice, including FOP-ACVR1 transgenic mice and HO model mice utilizing FOP-iPSCs. Furthermore, we revealed that one of the hit compounds is an mTOR signaling modulator that indirectly inhibits mTOR signaling. Our results demonstrate that these hit compounds could contribute to future drug repositioning and the mechanistic analysis of mTOR signaling.
Keywords: ACVR1; activin A; bone morphogenetic protein (BMP); endochondral ossification; fibrodysplasia ossificans progressiva (FOP); heterotopic ossification; high-throughput screening (HTS); induced pluripotent stem cell (iPSC); mammalian target of rapamycin (mTOR); transforming growth factor β (TGF-β).
Copyright © 2018 The Authors. Published by Elsevier Inc. All rights reserved.
Figures

Similar articles
-
Activin-A enhances mTOR signaling to promote aberrant chondrogenesis in fibrodysplasia ossificans progressiva.J Clin Invest. 2017 Sep 1;127(9):3339-3352. doi: 10.1172/JCI93521. Epub 2017 Jul 31. J Clin Invest. 2017. PMID: 28758906 Free PMC article.
-
Neofunction of ACVR1 in fibrodysplasia ossificans progressiva.Proc Natl Acad Sci U S A. 2015 Dec 15;112(50):15438-43. doi: 10.1073/pnas.1510540112. Epub 2015 Nov 30. Proc Natl Acad Sci U S A. 2015. PMID: 26621707 Free PMC article.
-
The ACVR1 R206H mutation found in fibrodysplasia ossificans progressiva increases human induced pluripotent stem cell-derived endothelial cell formation and collagen production through BMP-mediated SMAD1/5/8 signaling.Stem Cell Res Ther. 2016 Aug 17;7(1):115. doi: 10.1186/s13287-016-0372-6. Stem Cell Res Ther. 2016. PMID: 27530160 Free PMC article.
-
The obligatory role of Activin A in the formation of heterotopic bone in Fibrodysplasia Ossificans Progressiva.Bone. 2018 Apr;109:210-217. doi: 10.1016/j.bone.2017.06.011. Epub 2017 Jun 16. Bone. 2018. PMID: 28629737 Free PMC article. Review.
-
Fibrodysplasia ossificans progressiva (FOP): A disorder of osteochondrogenesis.Bone. 2020 Nov;140:115539. doi: 10.1016/j.bone.2020.115539. Epub 2020 Jul 27. Bone. 2020. PMID: 32730934 Free PMC article. Review.
Cited by
-
Molecular Developmental Biology of Fibrodysplasia Ossificans Progressiva: Measuring the Giant by Its Toe.Biomolecules. 2024 Aug 15;14(8):1009. doi: 10.3390/biom14081009. Biomolecules. 2024. PMID: 39199396 Free PMC article. Review.
-
ACVR1 Function in Health and Disease.Cells. 2019 Oct 31;8(11):1366. doi: 10.3390/cells8111366. Cells. 2019. PMID: 31683698 Free PMC article. Review.
-
The Survey of Cells Responsible for Heterotopic Ossification Development in Skeletal Muscles-Human and Mouse Models.Cells. 2020 May 26;9(6):1324. doi: 10.3390/cells9061324. Cells. 2020. PMID: 32466405 Free PMC article. Review.
-
ActivinA Induced SMAD1/5 Signaling in an iPSC Derived EC Model of Fibrodysplasia Ossificans Progressiva (FOP) Can Be Rescued by the Drug Candidate Saracatinib.Stem Cell Rev Rep. 2021 Jun;17(3):1039-1052. doi: 10.1007/s12015-020-10103-9. Epub 2021 Jan 7. Stem Cell Rev Rep. 2021. PMID: 33410098 Free PMC article.
-
BMP-9 mediates fibroproliferation in fibrodysplasia ossificans progressiva through TGF-β signaling.EMBO Mol Med. 2025 Jan;17(1):112-128. doi: 10.1038/s44321-024-00174-3. Epub 2024 Dec 3. EMBO Mol Med. 2025. PMID: 39627568 Free PMC article.
References
-
- Akiyama H., Shukunami C., Nakamura T., Hiraki Y. Differential expressions of BMP family genes during chondrogenic differentiation of mouse ATDC5 cells. Cell Struct. Funct. 2000;25:195–204. - PubMed
-
- Beard C., Hochedlinger K., Plath K., Wutz A., Jaenisch R. Efficient method to generate single-copy transgenic mice by site-specific integration in embryonic stem cells. Genesis. 2006;44:23–28. - PubMed
Publication types
MeSH terms
Substances
LinkOut - more resources
Full Text Sources
Molecular Biology Databases
Miscellaneous
