

Postoperative Electrocochleography from Hybrid Cochlear Implant users: An Alternative Analysis Procedure
- PMID: 30393003
- PMCID: PMC6309996
- DOI: 10.1016/j.heares.2018.10.016
Postoperative Electrocochleography from Hybrid Cochlear Implant users: An Alternative Analysis Procedure
Abstract
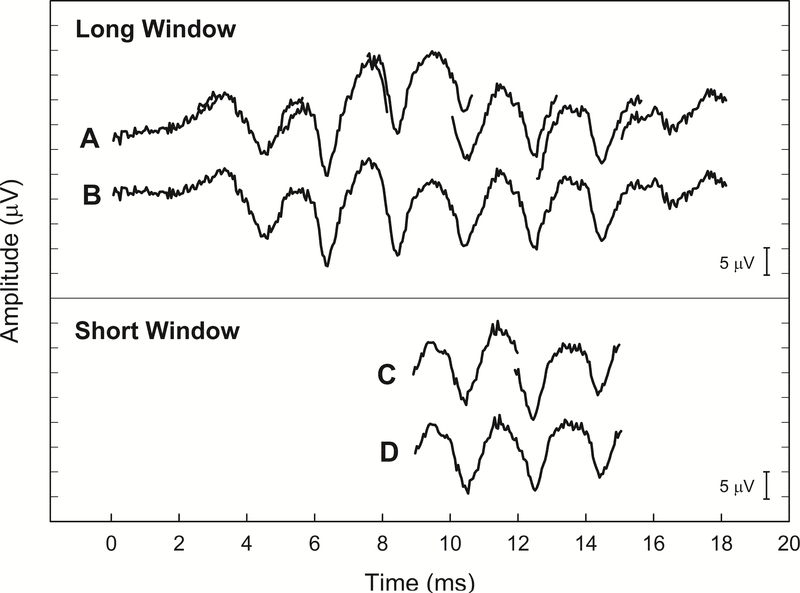
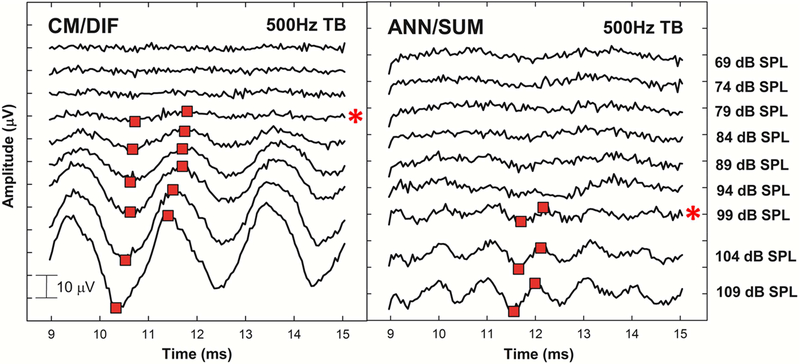
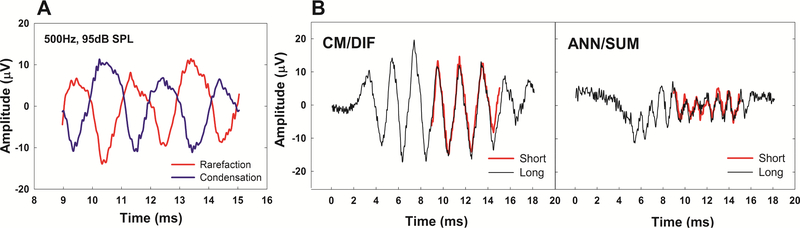
Objective: Shorter electrode arrays and soft surgical techniques allow for preservation of acoustic hearing in many cochlear implant (CI) users. Recently, we developed a method of using the Neural Response Telemetry (NRT) system built in Custom Sound EP clinical software to record acoustically evoked electrocochleography (ECoG) responses from an intracochlear electrode in Nucleus Hybrid CI users (Abbas et al., 2017). We recorded responses dominated by the hair cells (cochlear microphonic, CM/DIF) and the auditory nerve (auditory nerve neurophonic, ANN/SUM). Unfortunately, the recording procedure was time consuming, limiting potential clinical applications. This report describes a modified method to record the ECoG response more efficiently. We refer to this modified technique as the "short window" method, while our previous technique (Abbas et al., 2017) is referred as the "long window" method. In this report, our goal was to 1) evaluate the feasibility of the short window method to record the CM/DIF and ANN/SUM responses, 2) characterize the reliability and sensitivity of the measures recorded using the short window method, and 3) evaluate the relationship between the CM/DIF and ANN/SUM measures recorded using the modified method and audiometric thresholds.
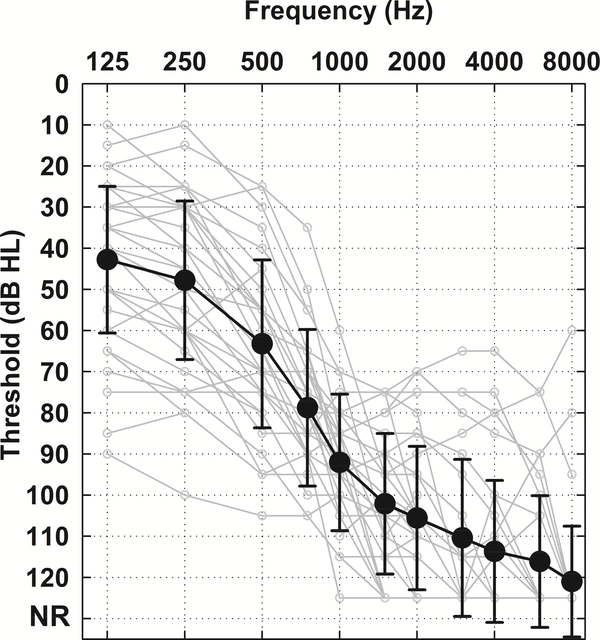
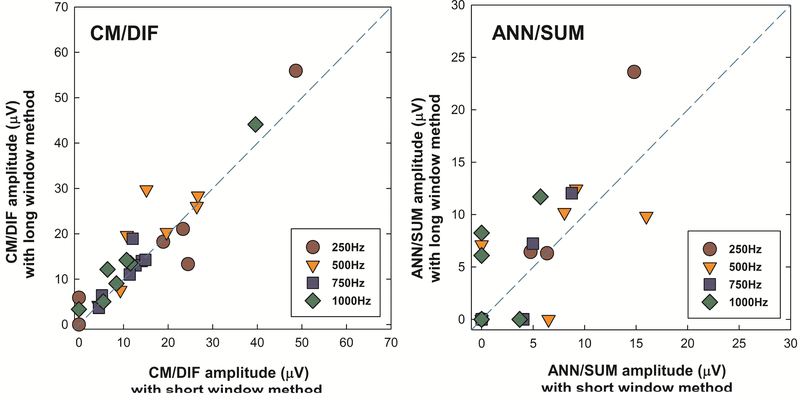
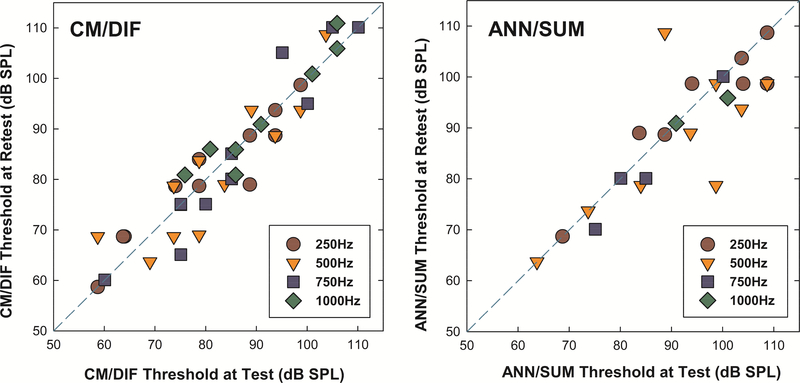
Method: Thirty-four postlingually deafened adult Hybrid CI users participated in this study. Acoustic tone bursts were presented at four frequencies (250, 500, 750, and 1000 Hz) at various stimulation levels via an insert earphone in both condensation and rarefaction polarities. Acoustically evoked ECoG responses were recorded from the most apical electrode in the intracochlear array. These two responses were subtracted to emphasize the CM/DIF responses and added to emphasize the ANN/SUM responses. Response thresholds were determined based on visual inspection of time waveforms, and trough-to-peak analysis technique was used to quantify response amplitudes. Within-subject comparison of responses measured using both short and long window methods were obtained from seven subjects. We also assessed the reliability and sensitivity of the short window method by comparing repeated measures from 19 subjects at different times. Correlations between CM/DIF and ANN/SUM measures using the short window recording method and audiometric thresholds were also assessed.
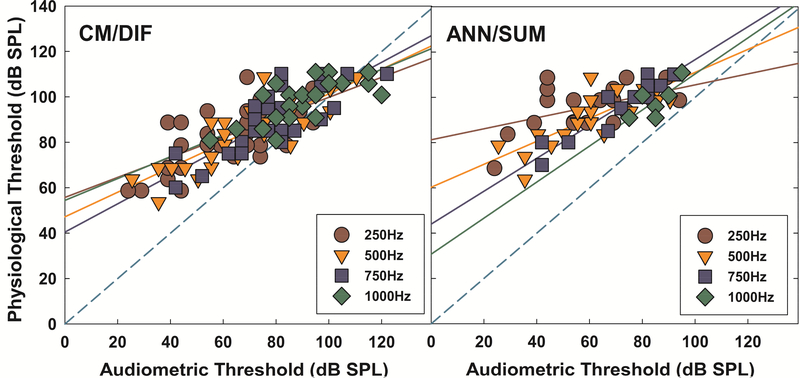
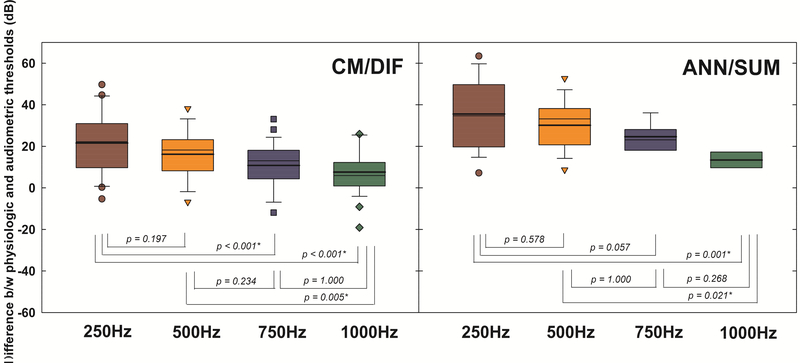
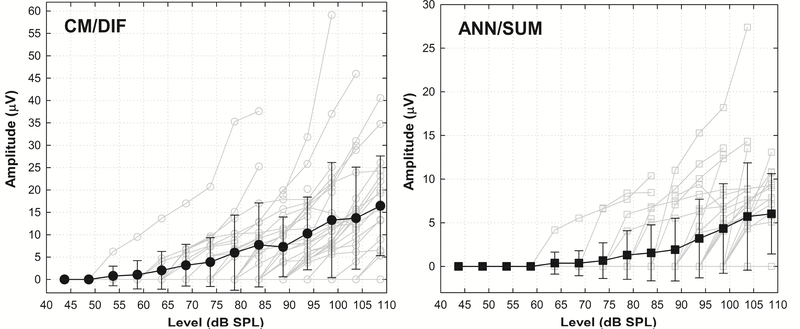
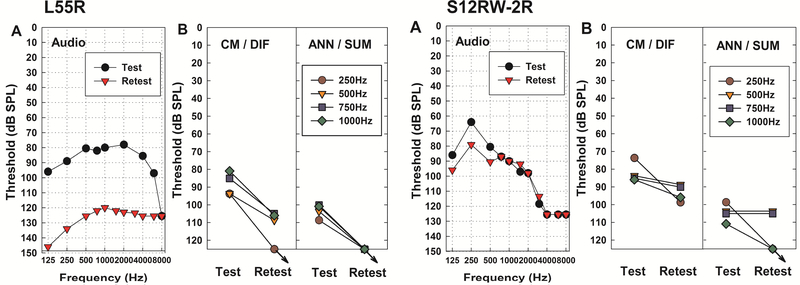
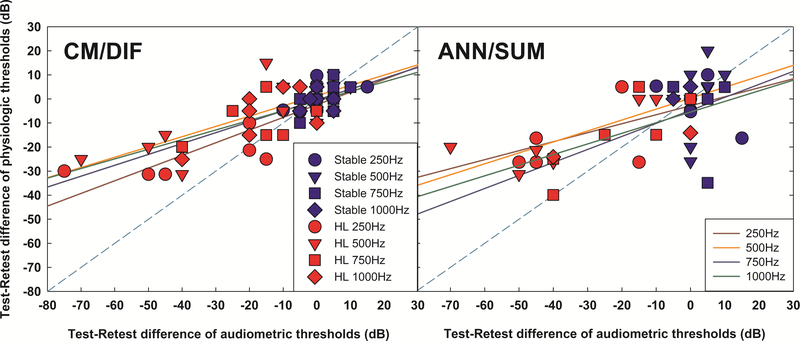
Results: Regardless of the recording method, CM/DIF responses were larger than ANN/SUM responses. Responses obtained using the short window method were positively correlated to those obtained using the conventional long window method. Subjects who had stable acoustic hearing at two different time points had similar ECoG responses at those points, confirming high test-retest reliability of the short window method. Subjects who lost hearing between two different time points showed increases in ECoG thresholds, suggesting that physiologic ECoG responses are sensitive to audiometric changes. Correlations between CM/DIF and ANN/SUM thresholds and audiometric thresholds at all tested frequencies were significant.
Conclusion: This study compares two different recording methods. Intracochlear ECoG measures recorded using the short window technique were efficient, reliable, and repeatable. We were able to collect more frequency specific data with the short window method, and observed similar results between the long window and short window methods. Correlations between physiological thresholds and audiometric thresholds were similar to those reported previously using the long window method (Abbas et al., 2017). This is an important finding because it demonstrates that clinically-available software can be used to measure frequency-specific ECoG responses with enhanced efficiency, increasing the odds that this technique might move from the laboratory into clinical practice.
Keywords: Auditory nerve neurophonic; Cochlear implant; Cochlear microphonic; Electrocochleography; Hearing preservation; Hybrid; Neural response telemetry.
Copyright © 2018 Elsevier B.V. All rights reserved.
Conflict of interest statement
Conflict of Interest
The authors declare that they have no conflicts of interest.
Figures
Similar articles
-
Electrocochleography in Cochlear Implant Users with Residual Acoustic Hearing: A Systematic Review.Int J Environ Res Public Health. 2020 Sep 26;17(19):7043. doi: 10.3390/ijerph17197043. Int J Environ Res Public Health. 2020. PMID: 32993065 Free PMC article.
-
Using Neural Response Telemetry to Monitor Physiological Responses to Acoustic Stimulation in Hybrid Cochlear Implant Users.Ear Hear. 2017 Jul/Aug;38(4):409-425. doi: 10.1097/AUD.0000000000000400. Ear Hear. 2017. PMID: 28085738 Free PMC article.
-
An improved method of obtaining electrocochleography recordings from Nucleus Hybrid cochlear implant users.Hear Res. 2019 Mar 1;373:113-120. doi: 10.1016/j.heares.2019.01.002. Epub 2019 Jan 9. Hear Res. 2019. PMID: 30665078 Free PMC article.
-
Predicting Postoperative Speech Perception and Audiometric Thresholds Using Intracochlear Electrocochleography in Cochlear Implant Recipients.Ear Hear. 2024 Sep-Oct 01;45(5):1173-1190. doi: 10.1097/AUD.0000000000001506. Epub 2024 May 31. Ear Hear. 2024. PMID: 38816899
-
Audibility, speech perception and processing of temporal cues in ribbon synaptic disorders due to OTOF mutations.Hear Res. 2015 Dec;330(Pt B):200-12. doi: 10.1016/j.heares.2015.07.007. Epub 2015 Jul 15. Hear Res. 2015. PMID: 26188103 Review.
Cited by
-
An intracochlear electrocochleography dataset - from raw data to objective analysis using deep learning.Sci Data. 2023 Mar 22;10(1):157. doi: 10.1038/s41597-023-02055-9. Sci Data. 2023. PMID: 36949075 Free PMC article.
-
Residual Hair Cell Responses in Electric-Acoustic Stimulation Cochlear Implant Users with Complete Loss of Acoustic Hearing After Implantation.J Assoc Res Otolaryngol. 2021 Apr;22(2):161-176. doi: 10.1007/s10162-021-00785-4. Epub 2021 Feb 4. J Assoc Res Otolaryngol. 2021. PMID: 33538936 Free PMC article.
-
Clinical Applications of Intracochlear Electrocochleography in Cochlear Implant Users With Residual Acoustic Hearing.J Audiol Otol. 2024 Apr;28(2):100-106. doi: 10.7874/jao.2024.00129. Epub 2024 Apr 10. J Audiol Otol. 2024. PMID: 38695055 Free PMC article.
-
Clinical experiences with intraoperative electrocochleography in cochlear implant recipients and its potential to reduce insertion trauma and improve postoperative hearing preservation.PLoS One. 2022 Apr 22;17(4):e0266077. doi: 10.1371/journal.pone.0266077. eCollection 2022. PLoS One. 2022. PMID: 35452461 Free PMC article.
-
Electrocochleography in Cochlear Implant Users with Residual Acoustic Hearing: A Systematic Review.Int J Environ Res Public Health. 2020 Sep 26;17(19):7043. doi: 10.3390/ijerph17197043. Int J Environ Res Public Health. 2020. PMID: 32993065 Free PMC article.
References
-
- Campbell L, Kaicer A, Briggs R, et al. (2014). Cochlear response telemetry: intracochlear electrocochleography via cochlear implant neural response telemetry pilot study results. Otol Neurotol, 36, 399–405. - PubMed
-
- Campbell L, Kaicer A, Sly D, Iseli C, Wei B, Briggs R, O’Leary S (2016). Intraoperative realtime cochlear response telemetry predicts hearing preservation in cochlear implantation. Otol Neurotol, 37, 332–338. - PubMed
-
- Centers for Disease Control and Prevention (CDC), National Center for Health Statistics (NCHS). National Health and Nutrition Examination Survey: NHANES 2011–2012 overview. https://wwwn.cdc.gov/nchs/nhanes/continuousnhanes/Overview.aspx?BeginYea.... Updated December 5, 2014. Accessed January 15, 2018.
Publication types
MeSH terms
Grants and funding
LinkOut - more resources
Full Text Sources
Medical
