. 2018 Nov 19;28(22):3578-3588.e6.
doi: 10.1016/j.cub.2018.09.037. Epub 2018 Nov 1.

Hippocampal Place Fields Maintain a Coherent and Flexible Map across Long Timescales

Affiliations

Hippocampal Place Fields Maintain a Coherent and Flexible Map across Long Timescales

Nathaniel R Kinsky et al. Curr Biol. .

Abstract

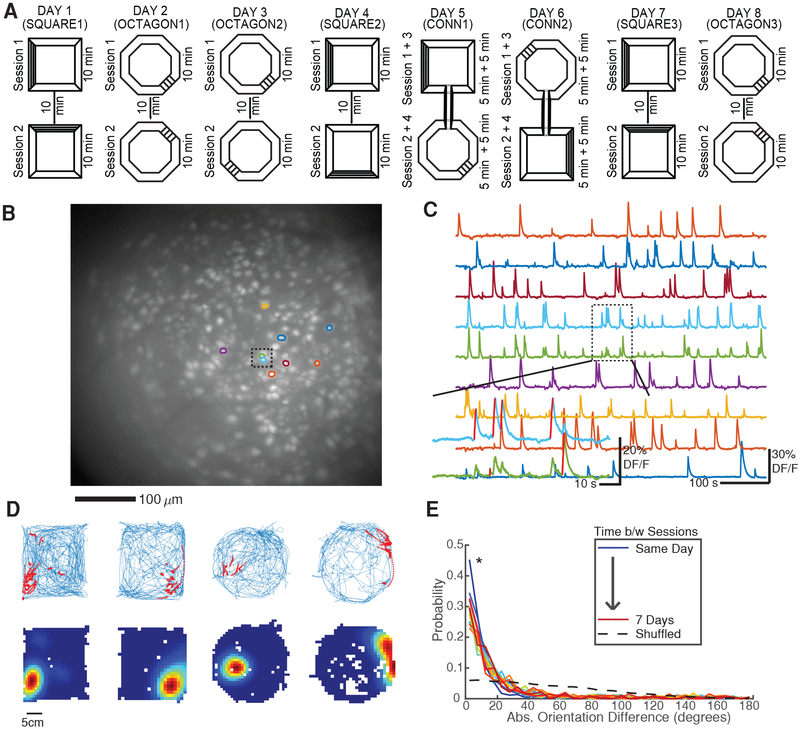
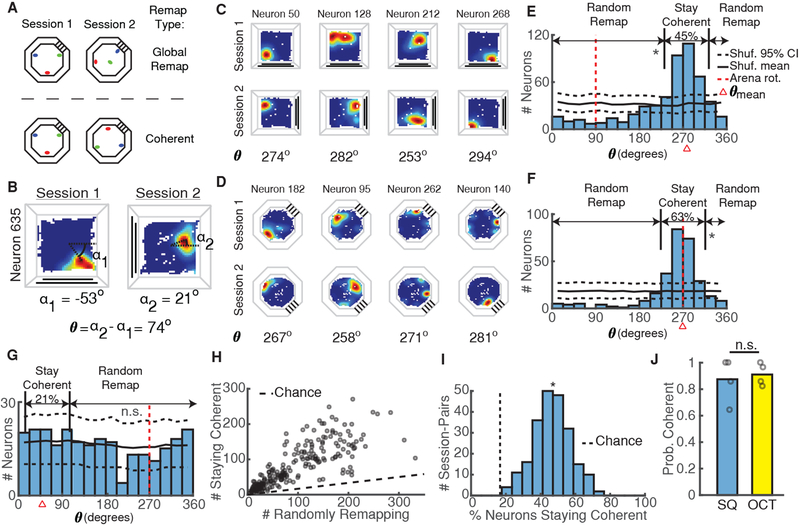
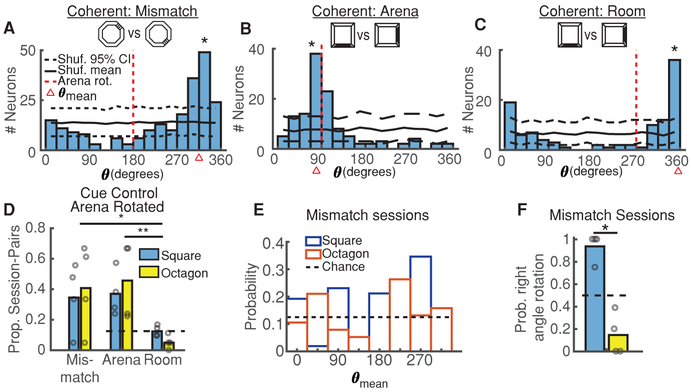
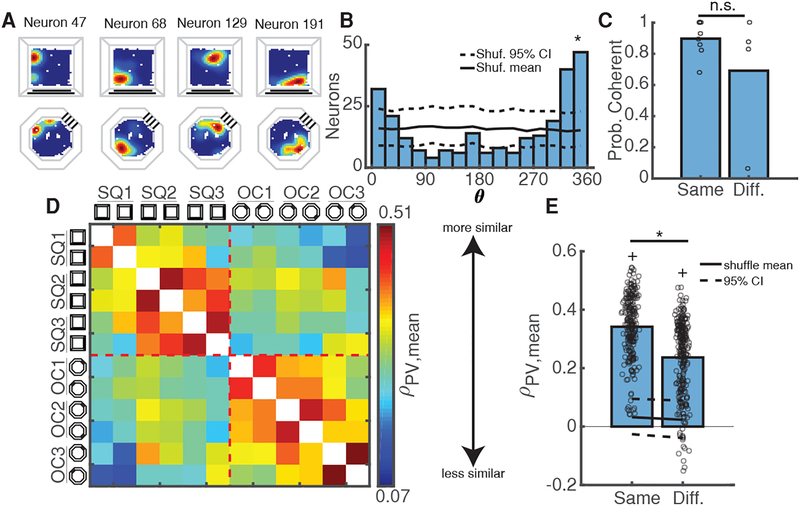
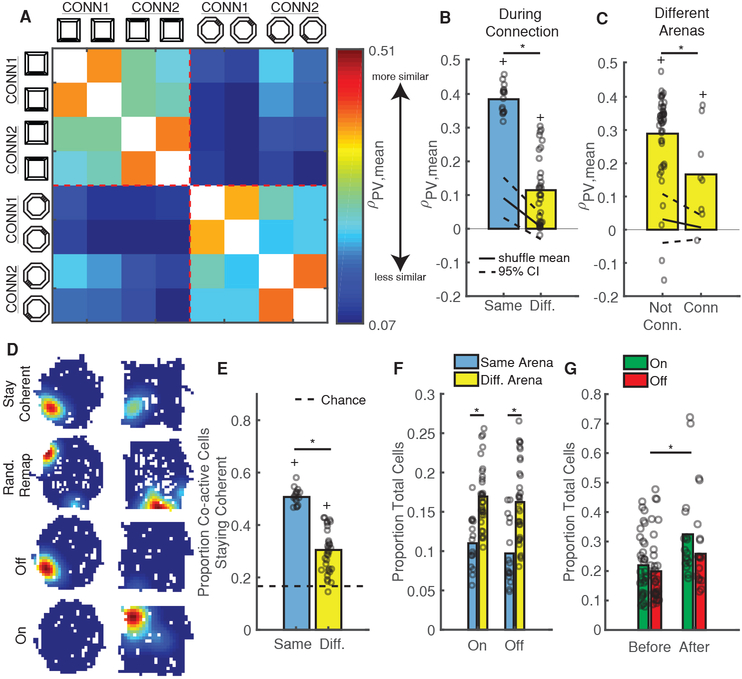
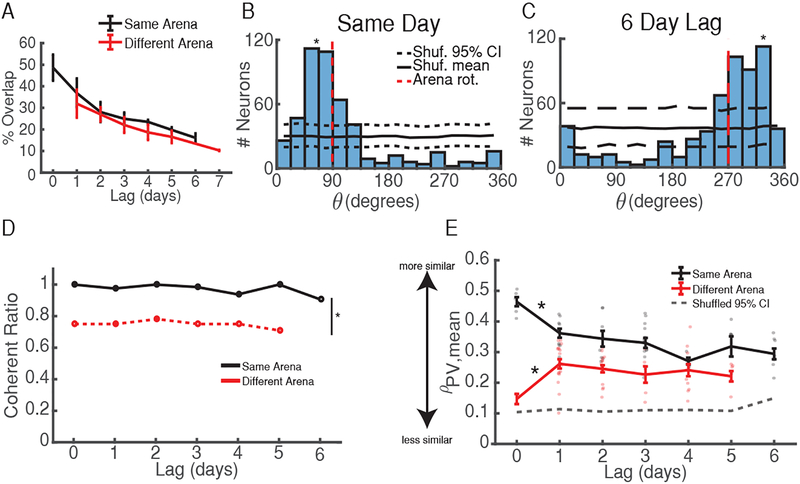
To provide a substrate for remembering where in space events have occurred, place cells must reliably encode the same positions across long timescales. However, in many cases, place cells exhibit instability by randomly reorganizing their place fields between experiences, challenging this premise. Recent evidence suggests that, in some cases, instability could also arise from coherent rotations of place fields, as well as from random reorganization. To investigate this possibility, we performed in vivo calcium imaging in dorsal hippocampal region CA1 of freely moving mice while they explored two arenas with different geometry and visual cues across 8 days. The two arenas were rotated randomly between sessions and then connected, allowing us to probe how cue rotations, the integration of new information about the environment, and the passage of time concurrently influenced the spatial coherence of place fields. We found that spatially coherent rotations of place-field maps in the same arena predominated, persisting up to 6 days later, and that they frequently rotated in a manner that did not match that of the arena rotation. Furthermore, place-field maps were flexible, as mice frequently employed a similar, coherent configuration of place fields to represent each arena despite their differing geometry and eventual connection. These results highlight the ability of the hippocampus to retain consistent relationships between cells across long timescales and suggest that, in many cases, apparent instability might result from a coherent rotation of place fields.

Keywords: calcium imaging; hippocampus; memory; miniscope; place cells; remapping; stability.


Conflict of interest statement

Declaration of Interests

The authors declare no competing interests.

Figures

Figure 1:
Figure 1:. Experimental setup
A) Mice explored two different arenas across 8 days. SQUARE1–3 and OCTAGON1–3: Two 10 minute sessions with arena pseudorandomly rotated between sessions. CONN1 and CONN2: Arenas were connected with a hallway and mice were given two 5 min blocks in each in alternating fashion. B) Maximum projection from a recording session with nine neuron ROIs overlaid. Dashed box indicates two closely spaced ROIs. See also Figure S1. C) Example calcium traces for ROIs highlighted in A. Dashed box demonstrates the ability of the cell/transient detection method to disambiguate crosstalk between neighboring neurons by assigning putative spiking epochs (red lines) to the appropriate neuron. D) Example place fields. Top: Blue = mouse’s trajectory, red = calcium event activity. Bottom: Occupancy normalized calcium event rate maps. Red = peak calcium event rate, Blue = no calcium activity. E) Distribution of ROI orientation (major axis angle) differences between sessions for one mouse. Since the majority of ROIs are elliptical, the small changes in ROI orientation shown here indicate that neurons are properly registered between sessions. *p < 1e-28 all session-pairs, one-sided Kolmogorov-Smirnov test vs shuffled.
Figure 2:
Figure 2:. Coherent Maps Predominate in the Hippocampus
A) Schematic of null hypothesis of global remapping between sessions (top) and alternate hypothesis of coherent mapping between sessions (bottom) using three example place fields (red, green, blue). In global remapping, all place fields randomly reorganize. In coherent mapping, place fields retain the same configuration but may or may not rotate. B) The place field rotation between sessions (θ) was calculated as the difference between α1 and α2, the angle from the arena center to the occupancy bin with the peak calcium event rate in session 1 and session 2, respectively. See also Figure S2. C) Calcium event rate maps from 4 simultaneously recorded neurons between two square arena sessions demonstrating coherent mapping. The rotation of each neuron’s place field is indicated at the bottom. Note that all rotations are close to 270 degrees. D) Same as C, but for two octagon sessions from a different mouse. E) Distribution of place field rotations for the coherent session-pair shown in C demonstrates clear clustering of rotations. Percentages of neurons staying coherent (|θ − θmean| < 30) or randomly remapping (|θ − θmean| >= 30) are indicated above the distribution. Black solid/dashed lines = shuffled mean and 95% CI. Red dashed line = arena rotation. Red triangle = θmean. *p < 0.001, shuffle test. F) Same as E, but for the coherent session-pair shown in D. *p < 0.001. G) Same as E-F but for an infrequent session-pair exhibiting global remapping. p = 0.15. H) Number of neurons staying coherent versus randomly remapping for all session-pairs. Dashed line indicates numbers expected by chance. I) Percentage of neurons whose place fields stay coherent for all mice/session pairs. *p = 1.8e-108 (t-test vs chance). J) Probability of using a coherent map in each arena. Open circles indicate proportions for each mouse. p = 1, Wilcoxon rank-sum test.
Figure 3:
Figure 3:. Coherent Maps Do Not Consistently Utilize Arena Cues For Orientation
A) Session-pair in the octagon arena demonstrating a mismatch between arena and place field rotations (|θmean − θarena| > 30). Black solid/dashed lines = shuffled distribution mean and 95% CI. Red dashed line = arena rotation. Red triangle = θmean. *p < 1/1000, shuffle test. See also Figure 2C,E. B) Session-pair in the square arena demonstrating control of place field rotations by arena rotations (θmean ≈ θarena). Same conventions as A. *p < 1/1000. See also Figure 2D,F. C) Session-pair in the square arena demonstrating a lack of place field rotations (θmean ≈ 0), consistent with orientation in the larger room. Same conventions as A. *p < 1/1000. D) Probability mice orient their place field maps per A-C indicates a high prevalence of mismatch session-pairs. Open circles indicate individual mouse probabilities. Dashed line indicates chance. p = 0.0042, Kruskal-Wallis ANOVA, *p = 0.028, **p = 0.0057 post-hoc Tukey test. All comparisons between square and octagon are not-significant (p > 0.05, Wilcoxon rank-sum test). E) Distribution of mean place field rotation angles for all square (blue) and octagon (orange) mismatch session-pairs. See also Figure S3. F) Proportion of mismatch session-pairs with place field rotations at right angles. Same conventions as D. Dashed line indicates chance. *p = 0.014, Wilcoxon rank-sum.
Figure 4:
Figure 4:. Coherent Maps Generalize Across Different Environments
A) Calcium event maps from 4 simultaneously recorded neurons indicate place fields stay in the same location between arenas. B) Distribution of place field rotations for coherent session-pair shown in A. Black solid/dashed lines = shuffled mean and 95% CI. *p < 0.001, shuffle test. C) Probability of using a coherent map remains high within and between arenas. Open circles = mean for each mouse/comparison-type. *p = 0.48, Wilcoxon rank-sum test. D) Mean population vector (PV) similarity between all non-connected sessions in each arena, grouped by arena and averaged across mice. Warmer/cooler colors indicate higher/lower PV similarity between sessions. See also Figure S4A. E) PVs are more similar within arenas than between arenas. Open circles indicate mean PV correlations for all mice/session-pairs. Black solid/dashed lines = shuffled distribution mean and 95% CI. *p = 1.3e-28 Wilcoxon rank-sum test. +p < 1e-37, sign-rank test vs upper 95% CI.
Figure 5:
Figure 5:. Connecting Arenas Temporarily Sharpens Discrimination
A) Mean PV similarity on connected days, grouped by arena and averaged across mice. Same color scale as Figure 4D. See also Figure S4B. B) PVs are more similar within arenas (blue) than between arenas (yellow) during connection. Open circles are for all mice/session-pairs. Black solid/dashed lines = shuffled distribution mean and 95% CI. *p = 2.3e-8, Wilcoxon rank-sum test. +p < 0.001, sign-rank test vs upper 95% CI. C) PV similarity between arenas on un-connected days are higher than on connected days. Same conventions as B. All session-pairs considered were 1 day apart. *p = 0.041, Wilcoxon rank-sum test. +p < 0.04, sign-rank test vs upper 95% CI. D) Example event rate maps for neurons that either stay coherent, randomly remap, turn “off” (active in 1st arena, inactive in 2nd), or turn “on” (inactive in 1st arena, active in 2nd) between arenas. E) The size of the population staying coherent decreases between arenas. Open circles indicate proportions for all mice/session-pairs during connection. Black Dashed black line = chance. *p=2.3e-8, Wilcoxon rank-sum test. +p = 2.3e-8 sign-rank test vs chance. F) More neurons turn on/off between different arenas than within the same arena. Same conventions as E. *p < 2e-4, Wilcoxon rank-sum test. G) Arena connection induces a lasting increase in the number of on/off neurons. Same as F but for session-pairs before and after connection. *p = 0.026, Wilcoxon rank-sum test.
Figure 6:
Figure 6:. Properties of Activity Across Long Time Scales
A) % Cell overlap vs. time lag between sessions demonstrates that fewer neurons are reactivated with time. Data are shown as mean ± s.e.m. Black = same arena, red = different arena. B) θ distribution for session-pair occurring the same day. Black solid/dashed lines = shuffled mean and 95% CI. Red dashed line = arena rotation. *p < 0.001, shuffle test. C) θ distribution for session-pair occurring 6 days apart. Same conventions as B. *p < 0.001. D) Time does not influence the probability of maintaining a coherent map between sessions. p > 0.5 Kruskal-Wallis ANOVA for same (black) and different (red) arena session-pairs across time. *p = 6.5e-5 Wilcoxon rank-sum test. E) High PV correlations at ~θmean supports the use of coherent maps at all time lags between sessions. Grey dashed = upper 95% CI from shuffled distribution. Colored dots indicate mean for each session-pair across mice. Error bars = s.e.m. *p < 0.001, Wilcoxon rank-sum test vs upper 95% CI at all time lags. See also Figure S5.

Comment in

Similar articles

Cited by

References

    1. O’Keefe J (1976). Place Units in the Hippocampus of the Freely Moving Rat. Exp. Neurol 51, 78–109. - PubMed
    1. O’Keefe John O, and Dostrovsky JO (1971). The hippocampus as a spatial map. Preliminary evidence from unit activity in the freely-moving rat. Brain Res. 34, 171–175. - PubMed
    1. O’Keefe J, and Nadel L (1978). The Hippocampus as a Cognitive Map (Oxford University Press; ).
    1. Thompson LT, and Best PJ (1990). Long-term stability of the place-field activity of single units recorded from the dorsal hippocampus of freely behaving rats. Brain Res. 509, 299–308. - PubMed
    1. Muller RU, Kubie JL, and Ranck JB (1987). Spatial firing patterns of hippocampal complex-spike cells in a fixed environment. J. Neurosci 7, 1935–1950. - PMC - PubMed

Publication types

LinkOut - more resources