. 2018 Nov 19;28(22):3533-3546.e6.
doi: 10.1016/j.cub.2018.09.020. Epub 2018 Nov 1.

Multisensory Control of Orientation in Tethered Flying Drosophila

Affiliations

Multisensory Control of Orientation in Tethered Flying Drosophila

Timothy A Currier et al. Curr Biol. .

Abstract

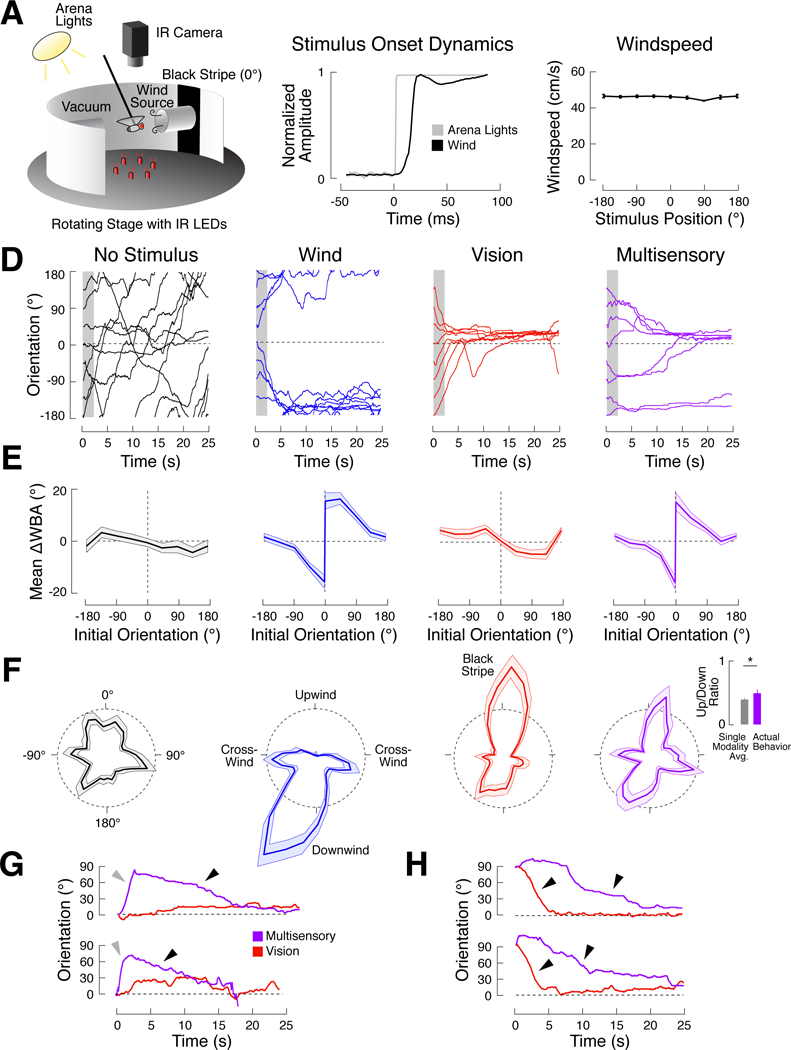
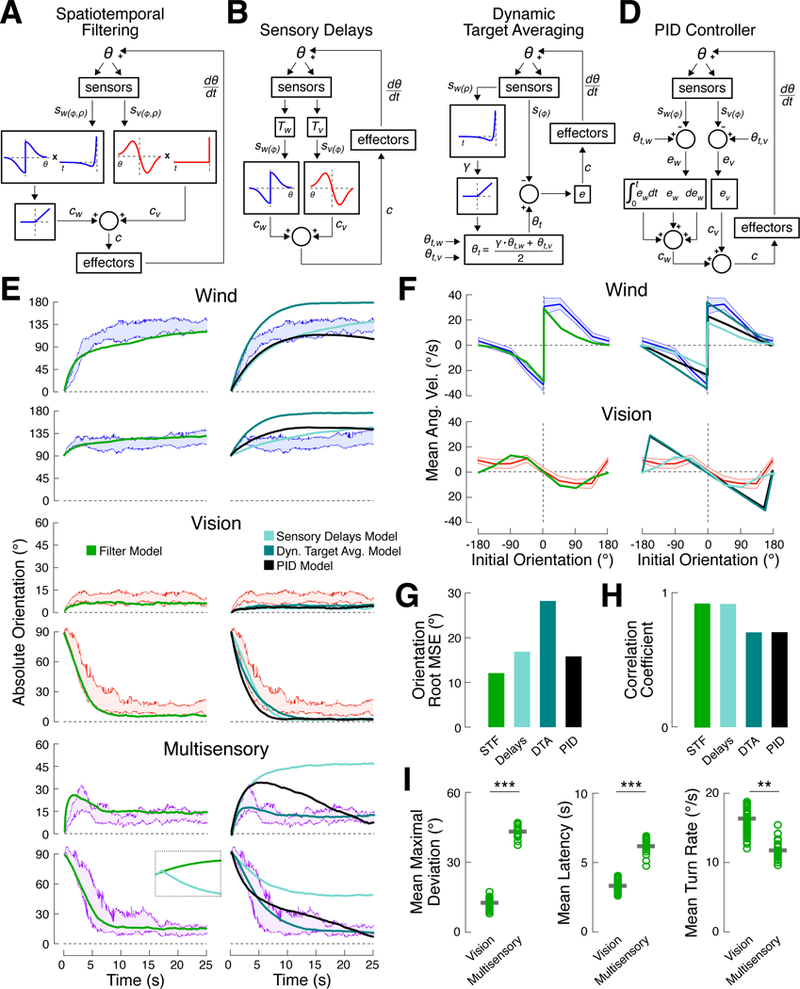
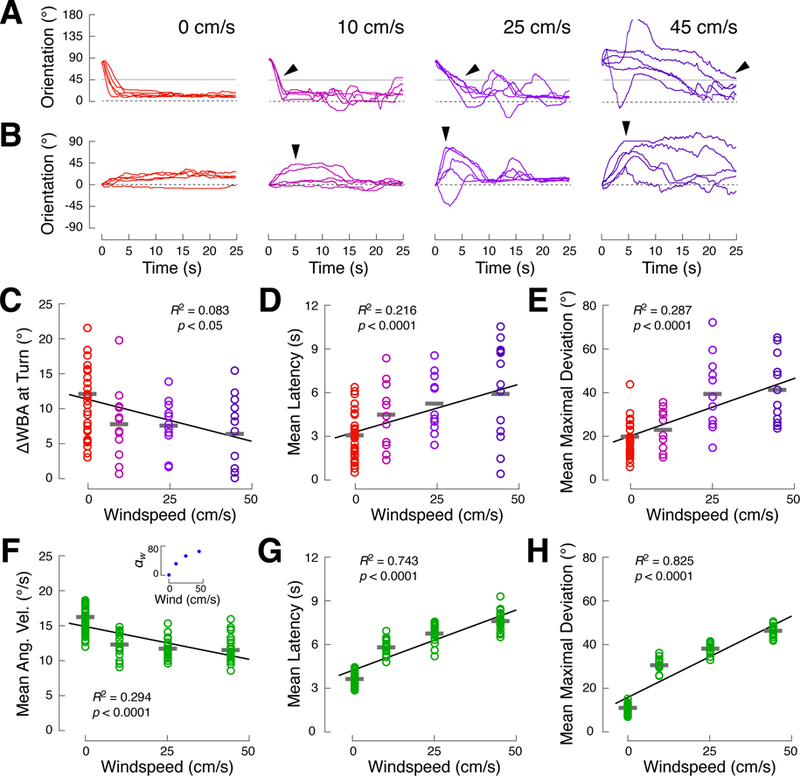
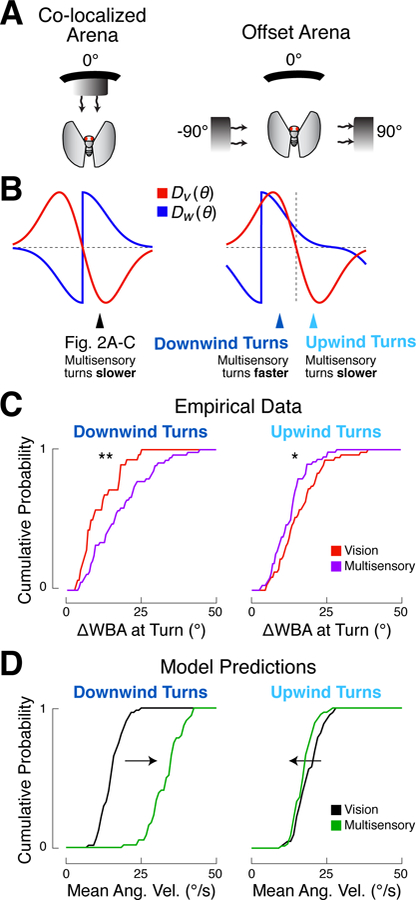
A longstanding goal of systems neuroscience is to quantitatively describe how the brain integrates sensory cues over time. Here, we develop a closed-loop orienting paradigm in Drosophila to study the algorithms by which cues from two modalities are integrated during ongoing behavior. We find that flies exhibit two behaviors when presented simultaneously with an attractive visual stripe and aversive wind cue. First, flies perform a turn sequence where they initially turn away from the wind but later turn back toward the stripe, suggesting dynamic sensory processing. Second, turns toward the stripe are slowed by the presence of competing wind, suggesting summation of turning drives. We develop a model in which signals from each modality are filtered in space and time to generate turn commands and then summed to produce ongoing orienting behavior. This computational framework correctly predicts behavioral dynamics for a range of stimulus intensities and spatial arrangements.

Keywords: Drosophila; behavior; integration; mechanosensation; multisensory; navigation; orientation; vision.


Figures

Figure 1.
Figure 1.. An orienting paradigm that elicits opposing responses to visual and mechanosensory stimuli.
(A) Schematic of our behavioral apparatus (not to scale). A rigidly tethered fly was held between wind and vacuum tubes. A vertical stripe was centered on the upwind tube. Attempted turning behavior was captured as the difference in wing angles (∆WBA) with a camera and IR illumination, and was used to drive a stepper motor that rotated the arena about the fly. Photographs of the actual arena are shown in Figure S2A. (B) Onset kinetics for arena lights (gray) and wind (black). Stimuli were switched on at time 0. (C) Mean windspeed +/− SEM for 8 different arena positions. Windspeed is consistent across orientations (one-way ANOVA; p = 0.11). (D-F) Turning and orienting behavior in this paradigm. Flies turn and orient downwind on wind trials (blue), but turn and orient toward the stripe on vision trials (red). Multisensory behavior (purple) is a combination of these responses. No orientation biases exist when no stimulus is present (black). See also Figures S1 and S2. (D) Example behavior of a single fly for all stimulus conditions. Each line represents a single trial. Stimulus onset at time 0. Visual stripe and wind source at 0° (dashed black lines). Data from the first 2 seconds of each trial (gray boxes) were used to calculate turn rate as a function of orientation in (E). (E) Early trial turning behavior for each condition. Mean turn rate (∆WBA) +/− 95% CI over the first two seconds of each trial across all flies (N = 120), as a function of initial orientation. Note that data for the wind and multisensory conditions is split by turn direction at 0° to emphasize that flies’ largest turns were generated near 0° in these conditions (Figure S2D). Visual data was not split. (F) Late trial orientation for each condition. Polar histograms (bin width = 10° ) showing mean normalized orientation occupancy +/− 95% CI across starting orientations for the final 15 seconds of all trials. Black dashed circles represent a probability density of 0.005 per degree. Orienting behavior is slightly skewed because the wind vector was not perfectly perpendicular to the edge of the arena. In the multisensory condition, the ratio of upwind to downwind orienting (inset) is higher than expected from the mean of single modality histograms (paired t-test, p < 0.05). (G) Single trial evidence of “turn sequences.” Each panel shows a multisensory trial (purple) overlaid on a vision trial (red) from the same fly starting at the same initial orientation. On multisensory trials, flies first turn away from 0° (gray arrows) before turning back to 0° (black arrows) later in the trial. (H) Single trial evidence for “turn slowing.” Multi sensory trials are overlaid on vision trials for single flies. Turns toward 0° are slower in the mul tisensory condition than in the vision condition (compare slopes at black arrows).
Figure 2.
Figure 2.. Turn sequences and turn slowing arise from neural integration of dynamic multimodal signals.
(A-C) Stimuli starting at 90° elicited multisensory turn slowing only when the antennae are free to transduce wind. Eleven control flies and 12 antenna-stabilized flies each received 5 presentations of wind, vision, or both. (A) Schematic of stimulus presentation (not to scale) and antenna stabilization, which was accomplished via a drop of UV-cured glue at the junction of the second and third antennal segments. See also Figures S1 and S3. (B) Example behavior of a control fly (left) and an antenna-stabilized fly (right). Orientation axis is truncated for clarity. Turns toward 0° in the mu ltisensory condition are slower than those in the vision condition (black arrows). Thin gray lines indicate the midpoints of vision-guided turns (45°) used to calculate turn latency and speed in ( C). Colored arrows on the time axis show the mean latency to cross 45° for vision (red) and mult isensory (purple) trials in the control fly. (C) Left: mean latency to cross 45° across 5 stimul us presentations for control (black) and antenna-stabilized (gray) flies in the vision and multisensory conditions. Horizontal bars: means across flies. In control flies, multisensory turns occurred later than vision turns (paired t-test, p < 0.01), while multisensory turns occurred earlier than vision turns in antenna-stabilized flies (p < 0.05). Right: mean turn rate, as ∆WBA, over a 1 s window centered on 45° crossings fo r each fly. Multisensory turns are slower than vision turns in control flies (p < 0.05), but not in antenna-stabilized flies (p = 0.93). See also Figures S4 and S5. (D-F) Stimuli starting at 0° to the fly elicited ev idence of sequential turning only when the antennae are free to transduce wind. (E) Example behavior of a control fly (left), showing larger deviations from 0° in the multisensory condition than in the vision condition (black arrows), and an antenna-stabilized fly (right), which does not display a turn sequence. (F) Mean maximal deviation from 0° for all flies in the vision and multisensory conditions (colors as in (C)). Maximal deviations are the largest absolute orientation attained over the first 10 s of each trial. Control flies turned farther from 0° in the multisensory condition than in the vision condition (p < 0.001), while no such difference was observed in antenna-stabilized flies. See also Figures S4 and S5. (G) The mean turn rates of 120 flies (from Figure 1), conditioned on orientation, is plotted as a function of time (thin gray lines) for the wind and vision conditions. The orientation conditions are at 30°, 45°, 60°, 75°, 90°, 105°, 120°, 135°, a nd 150°. For wind, turn rate through each orientation decreases as the trial progresses. For vision, some orientations show decreasing turn rate over time, while others show increasing turn rate. Thick colored lines represent the median across orientations.
Figure 3.
Figure 3.. Summation of spatiotemporally filtered sensory inputs can account for turn slowing and turn sequences.
(A) Schematic of the spatiotemporal filtering model. Sensory signals for wind and vision, sw(φ,ρ) and sv(φ,ρ), are passed through spatial and temporal filters to generate turn commands, c, for each modality. Turn commands are summed and applied to heading, θ, generating new sensory signals on the next time step. (B) Sensory delay model. Temporal filters are replaced by fixed processing delays (T) for each modality. (C) Dynamic target averaging model. The turn command reflects the error, e, between current heading, θ, and target heading, θt. Target heading is a weighted average of target headings for vision (0°) and wind (180°). The time course of win d stimulation (sw(ρ)) is temporally filtered to determine wind target weight. (D) PID controller model. Sensory signals for each modality are compared to their respective target headings (0° for vision, 180° for wind) to g enerate an error for each modality. Turn commands are computed by summing proportional, integral, and derivative terms for this error. The overall turn command is a sum across modalities. (E) Best fit simulations for each model compared to empirical data. Colored bands represent 95% confidence intervals for absolute orientation in response to wind (blue), vision (red), and multisensory (purple) conditions for flies starting at 0º and 90º. Left: spatiotemporal model (green, (A)). Right: delay model (light teal, (B)), dynamic target averaging model (dark teal, (C)), PID model (black, (D)). Note the differing y-axis scales. Best-fit parameters for each model are shown in Table 1. Inset shows the first 1 s of a simulation beginning at 60º for the spatiotemporal filtering and sensory delays models, highlighting the rapidity of the turning sequence generated by the latter. Inset vertical axis is 30º. (F) Simulated turn rate as a function of orientation for each model compared to empirical data. Data (colored bands) is reproduced from Figure 1. Model colors as in (E). (G) Root mean squared error between the best-fit simulation results, as shown in (E), and the empirical median absolute orientation time course. STF: spatiotemporal filtering model; Delays: sensory delays model; DTA: dynamic target averaging model; PID: PID controller model. Values shown in Table 1. The spatiotemporal filtering model fits the data best. See also Figure S6. (H) Correlation coefficient between the empirical turn rate functions from (F) and the simulation results is plotted for each model. Correlation coefficient is used in place of RMSE to discount the effect of stimulus intensity. The models that do not include an explicit spatial filter do not fully capture the influence of orientation on turn rate. (I) Measures of multisensory integration, computed for simulated behavior from the spatiotemporal filtering model. Each plot shows the simulated behavior of 20 “flies” (open circles). Each “fly” is the mean of 5 trials, mimicking the plots in Figure 2. Thick gray bars: mean across “flies.” All metrics are calculated as in Figure 2. Left: simulated flies turn farther from 0º in the multisensory condition compared to the vision condition (rank-sum test, p < 0.0001). Middle and right: simulated turns toward 0º in the multisensory condition occur later (p < 0.0001) and are slower (p < 0.01) than those in the vision condition.
Figure 4.
Figure 4.. Turn kinetics vary continuously with stimulus intensity.
(A) Slowing of visually-guided turns in the presence of a competing wind stimulus increases with windspeed. Each plot shows 5 trials from single flies beginning at 90°. The leftmost plot represents the vision condition (red), while the right hand plots show the multisensory condition at low (10 cm/s, magenta), medium (25 cm/s, purple, reproduced from Figure 2B), and high (45 cm/s, indigo) wind speeds. Arrows highlight the timing of turns through 45° (gray line). (B) Transient deviations from 0° (arrows) grow with windspeed. Each plot shows 5 trials from single flies beginning at 0°. Third panel is reprod uced from Figure 2B. (C-E) Behavioral measures evaluated as a function of windspeed. Each fly was presented with the vision stimulus and one of 3 multisensory condition wind speeds yielding (N = 34, 11, 11, and 12 flies for wind at 0, 10, 25, and 45 cm/s, respectively). Circles: single flies; gray bars: mean across flies. Black lines indicate best linear fits, but behavioral parameters generally change nonlinearly with windspeed. (C) Mean turn rate through 45° on 90° trials (as in Figure 2C) is negatively correlated with windspeed (R2 = 0.08, p < 0.05), as shown in (A). (D) Latency to turn through 45° (as in Figure 2C) i s positively correlated with windspeed (R2 = 0.22, p < 0.0001), as shown in (A). (E) Mean maximal deviation from 0° (as in Figure 2F ) is positively correlated with windspeed (R2 = 0.29, p < 0.0001), as shown in (B). (F-H) Measures of simulated behavior using the spatiotemporal filtering model (Figure 3A). Each stimulus condition contains data from 20 simulated “flies” (the mean of a 5-trial block, as in Figure 3I). The wind intensity parameter (αw) values corresponding to different wind speeds were found by fitting only this parameter to the wind condition data from the high and low windspeed experiments, above. All other model parameters are unchanged. The inset in panel illustrates the nonlinear relationship between windspeed and the best-fitting αw. See also Figure S7. (F) Turn rate (as in (C)) is negatively correlated with wind strength in model simulations (R2 = 0.29, p < 0.0001). (G) Latency to turn (as in (D)) is positively correlated with wind strength in model simulations (R2 = 0.74, p < 0.0001). (H) Mean maximal deviation from 0° (as in (E)) is p ositively correlated with wind strength in model simulations (R2 = 0.83, p < 0.0001).
Figure 5.
Figure 5.. Turn kinetics depend on the relative spatial orientation of stimuli.
(A) Schematics of co-localized and offset arena configurations (not to scale). (B) Spatial filters (turn rate as a function of orientation) for each modality in each arena configuration. In the co-localized arena, presentation of both stimuli always produces conflicting (oppositely signed) turn commands. In the offset arena, presentation of both stimuli can be synergistic (same sign) or conflicting (opposite sign), depending on the orientation of the fly. (C) Distributions of experimentally measured turn rates in the offset arena for vision (red) and multisensory (purple) trials, sorted by turn direction. Flies were started at either −90° or 90° relative to the stripe to produce downwind or upwind turns, respectively. Rates of individual turns toward the stripe were calculated over a 1 s period centered on the time when the fly crossed + or −45°. Downwind turns (left) are faster in the multisensory condition (n = 53) than in the vision condition (n = 28), as seen in the right-shifted multisensory CDF (rank-sum test, p < 0.01). Upwind turns (right) are slower in the multisensory condition (n = 59) compared to the vision condition (n = 54), resulting in a left-shifted multisensory CDF (rank-sum test, p < 0.05). (D) Predictions of the spatiotemporal filtering model for the offset arena configuration. The wind spatial filter was circularly shifted by −90° to ma tch the arena configuration, as shown in (B). The distribution of turn rates for simulated flies are plotted as CDFs for the vision (black) and multisensory (green) conditions. Rates of individual turns (n = 60 for each direction-condition pair) calculated as in (C). The distribution of multisensory turn rates is right-shifted compared to vision for the downwind direction (left panel), but left-shifted for the upwind direction (right panel).
Figure 6.
Figure 6.. A dynamic wind stimulus provides direct evidence for spatial and temporal filtering of turn commands.
(A) Example behavior of 2 flies orienting in closed-loop to a constant visual stimulus and a pulsing wind stimulus. Each 50 s trial consisted of 10 repetitions of 2.5 s of wind followed by 2.5 s of no wind (bottom panel). Between trials, closed-loop orienting continued without any wind for 30 sec. Flies turned toward 0º when no wind was present, and away from 0º when the wind was on. (B) Mean behavior as a function of pulse number. Absolute orientation +/− 95% CI and mean toward-0º turn rate (Methods) are plotted as a function of time for each pulse’s onset (top) and offset (bottom). To minimize spatial influences, we only included data from flies that were oriented between 20º and 120º at the time of wind o nset or offset. Data for the first onset is excluded, as all flies began at 0°. The shape and m agnitude of flies’ turning responses are distinct for onset and offset but do not vary systematically with pulse number. (C) Mean toward-0º turn rate (black) +/− 95% CI as a function of wind pulse timing for wind onsets (top) and offsets (bottom). Data is for flies oriented between 20º and 120º at the time of onset or offset (black). The onset y-axis is inverted for clarity. Thin gray lines represent the mean toward-0º turn rate for smaller orientation ranges: 40º-120º, 30º-100º, 30º-80º, and 20º-60º for onsets; 20º-70º, 40º-70º, 20º-50º, and 10º-40º for offsets. (D) Mean toward-0º turn rate +/− 95% CI as a function of time within a pulse, averaged across pulses, for wind onsets (purple) and offsets (orange). Data is for flies oriented between 20º and 120º at the time of onset or offset. Both responses decay, but at different rates. (E) Mean behavior as a function of orientation. Mean absolute orientation +/− 95% CI and mean toward-0º turn rate are plotted as a function of time for all wind onsets (top) and offsets (bottom). Data were binned based on the flies’ orientations at the time of onset or offset (overlapping 30º bins, every 10º). The magnitude of flies’ turning responses to wind onsets or offsets vary with orientation. Spatial tuning is distinct for onsets and offsets. (F) Mean toward-0º turn rate +/− 95% CI as a function of the absolute orientation at wind onset (purple) or offset (orange). Data was split into 15 equally-sampled spatial bins (each turn is counted only once). The spatial filter on wind onset is broad and peaks near 60º, while the spatial filter on wind offset is narrower and peaks near 45º.

References

    1. Seilheimer RL, Rosenberg A, and Angelaki DE (2014). Models and processes of multisensory cue combination. Curr. Opin. Neurobiol 25, 38–46. - PMC - PubMed
    1. Alais D, and Burr D (2004). Ventriloquist effect results from near-optimal bimodal integration. Curr. Biol 14, 257–262. - PubMed
    1. Shams L, Kamitani Y, and Shimojo S (2000). What you see is what you hear. Nature 408, 788. - PubMed
    1. Fetsch CR, Pouget A, Deangelis GC, and Angelaki DE (2012). Neural correlates of reliability-based cue weighting during multisensory integration. Nat. Neurosci 15, 146–154. - PMC - PubMed
    1. Drugowitsch J, Deangelis GC, Klier EM, Angelaki DE, and Pouget A (2014). Optimal multisensory decision-making in a reaction-time task. eLife 3, e03005. - PMC - PubMed

Publication types

LinkOut - more resources