. 2018 Nov 19;28(22):3599-3609.e4.
doi: 10.1016/j.cub.2018.09.054. Epub 2018 Nov 1.

Abnormal Locus Coeruleus Sleep Activity Alters Sleep Signatures of Memory Consolidation and Impairs Place Cell Stability and Spatial Memory

Affiliations

Abnormal Locus Coeruleus Sleep Activity Alters Sleep Signatures of Memory Consolidation and Impairs Place Cell Stability and Spatial Memory

Kevin M Swift et al. Curr Biol. .

Abstract

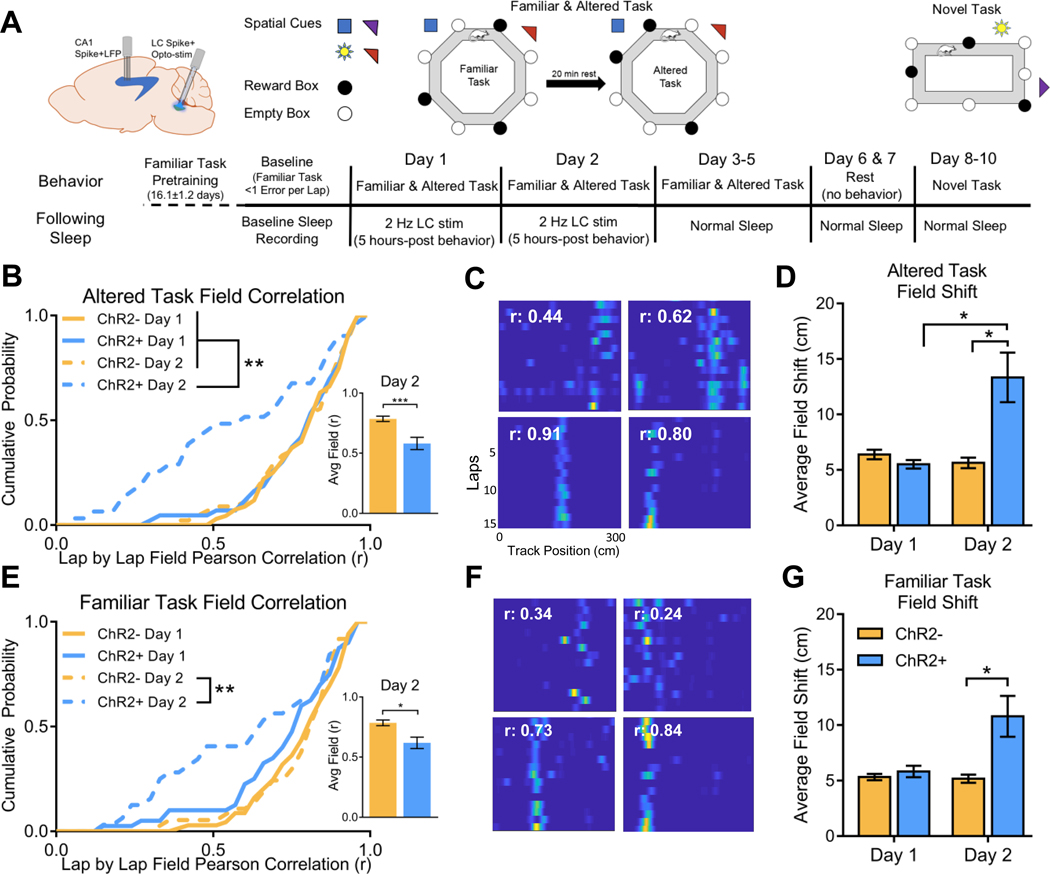
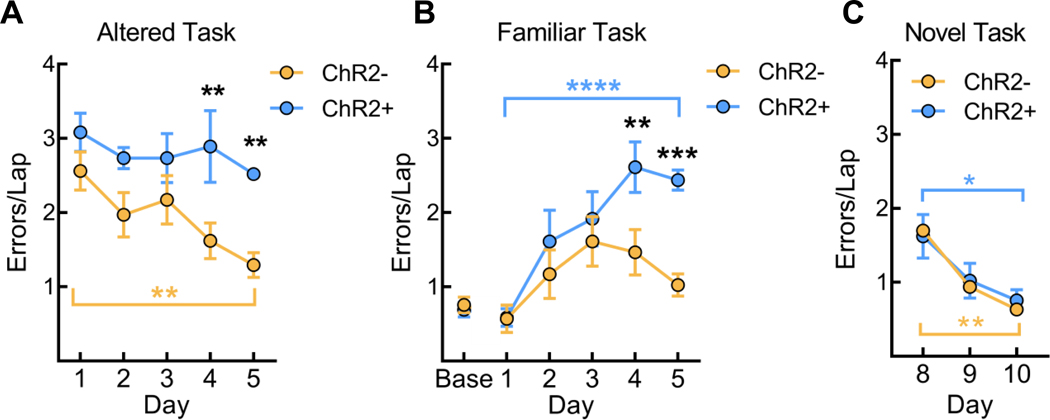
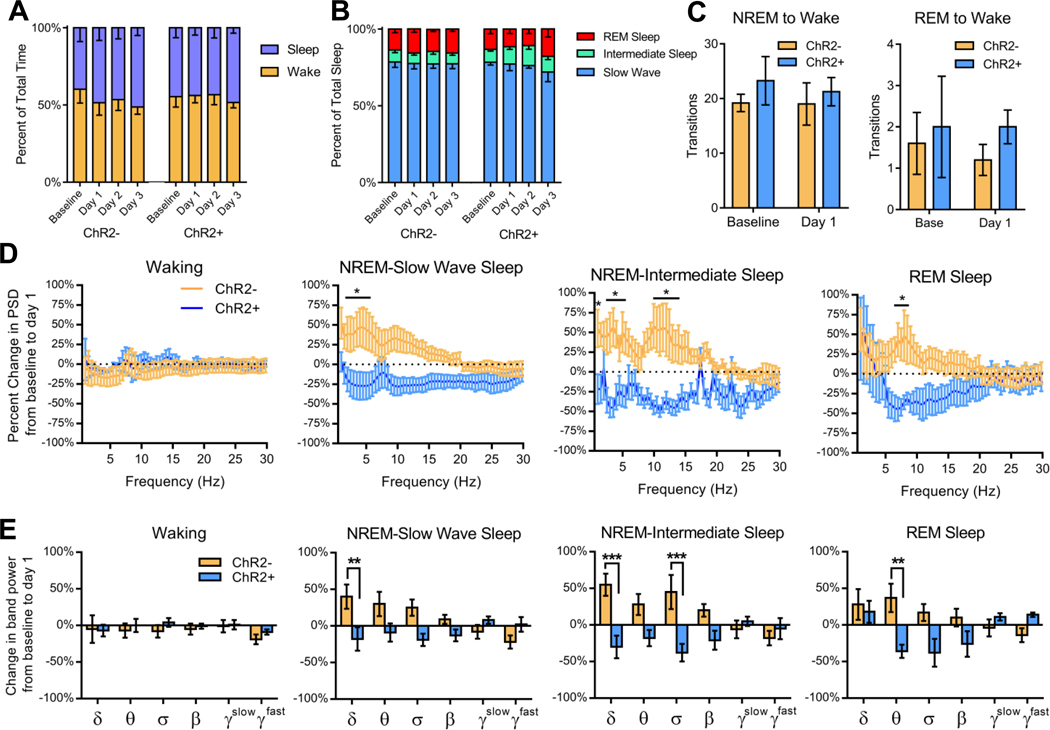
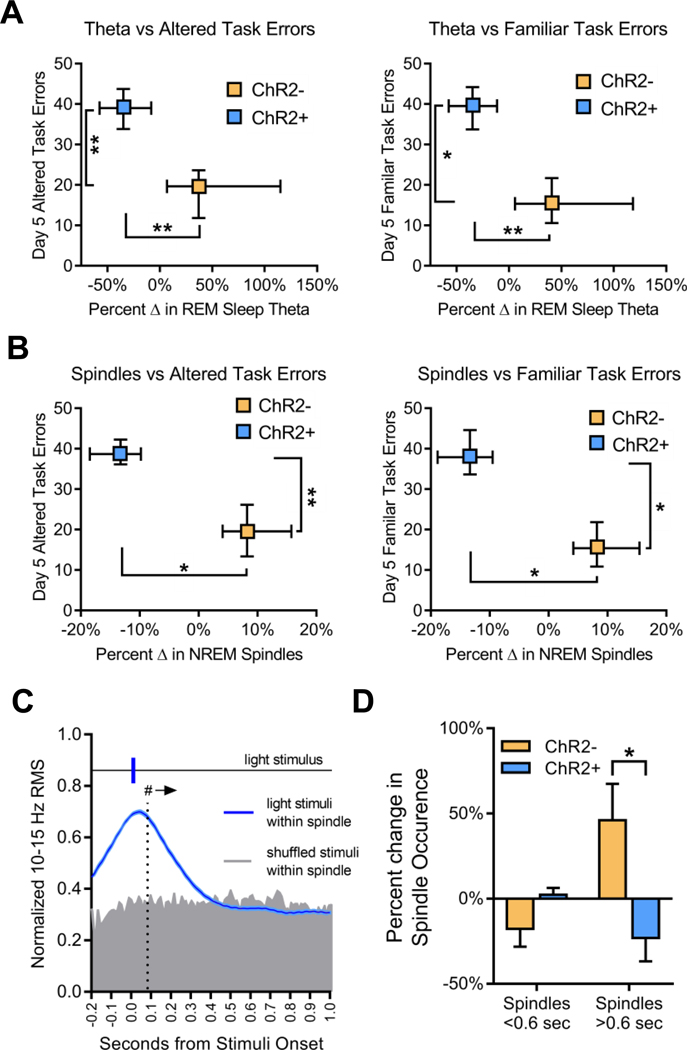
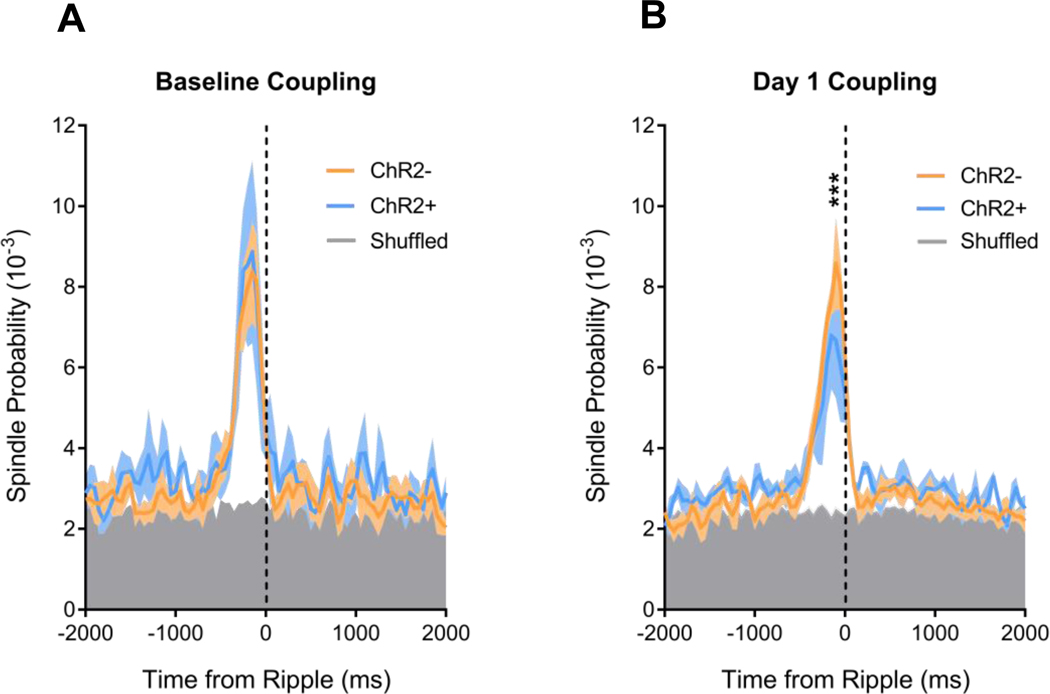
Sleep is critical for proper memory consolidation. The locus coeruleus (LC) releases norepinephrine throughout the brain except when the LC falls silent throughout rapid eye movement (REM) sleep and prior to each non-REM (NREM) sleep spindle. We hypothesize that these transient LC silences allow the synaptic plasticity that is necessary to incorporate new information into pre-existing memory circuits. We found that spontaneous LC activity within sleep spindles triggers a decrease in spindle power. By optogenetically stimulating norepinephrine-containing LC neurons at 2 Hz during sleep, we reduced sleep spindle occurrence, as well as NREM delta power and REM theta power, without causing arousals or changing sleep amounts. Stimulating the LC during sleep following a hippocampus-dependent food location learning task interfered with consolidation of newly learned locations and reconsolidation of previous locations, disrupting next-day place cell activity. The LC stimulation-induced reduction in NREM sleep spindles, delta, and REM theta and reduced ripple-spindle coupling all correlated with decreased hippocampus-dependent performance on the task. Thus, periods of LC silence during sleep following learning are essential for normal spindle generation, delta and theta power, and consolidation of spatial memories.

Keywords: NREM; REM; hippocampus; locus coeruleus; optogenetic; reconsolidation; ripples; sleep; spindle; theta.


Figures

Figure 1.
Figure 1.. LC spikes sync to peak spindle power and LC optogenetic stimulation decreases spindle occurrence.
(A) Example of LC timing in relation to spindles. LC activity ceases prior to spindle onset, and during the spindle (in blue), LC activity returns leading to a decrease in spindle power. (B) Normalized root mean square of spindle power (10–15 Hz) during sleep spindles centered on LC spikes. The blue line represents the effect of LC spikes on spindle power when spikes occur within identified spindles, whereas the dark grey line represents the effect of LC spikes on spindle power outside of identified spindle (n=3 rats). The light grey area represents significant different between the two with significance from p<0.05 to P<0.0001 from t=−0.67 to t=0.54 seconds; displayed as mean ± sem. (C) Example heat map displaying rise and fall of spindle power centered on LC spikes occurring within the spindles (n=561 spindles, from three animals). (D)Two Hz LC stimulation during sleep decreases CA1 spindle occurrence rate in ChR2+ rats, n=4. Paired t-test p=0.0003 ***p<0.0005. Displayed as mean ± sem. See also Figures S1 and S2.
Figure 2.
Figure 2.. LC stimulation during sleep impairs next day place field encoding.
(A) Schematic of recording layout and experimental timeline. (B) The cumulative probability of the lap to lap place field Pearson correlation on altered task. Fields with high spatial stability have a higher correlation. Day 2 ChR2+ rats show a shift towards more fields having lower correlation values. Kolmogorov-Smirnov Test **p<0.01. Subplot bar graph displaying the overall average day 2 field correlation. Mann-Whitney p=0.003; ***p<0.005. (C) Representative heat maps of place field spatial encoding with lighter colors displaying where CA1 pyramidal spikes were located along the track (horizontally), and where firing occurred across multiple laps (vertically). Top two represent lower correlation fields from ChR2+ Day 2. Bottom two represent higher correlation fields from ChR2− day 2. (D) Average place field shift per lap on the altered task on Day 1 and Day 2. As shifts can be in positive or negative direction, the absolute value of the shifts are used to calculate the averages in part B and D. Part A and C: ChR2− Day 1 n=61, ChR2+ Day 1 n=43, ChR2− Day 2 n=45, ChR2+ Day 2 n=31 (outlier removed from Control Day 1 and Control Day 2). Kruskal-Wallis, Dunn post hoc: ChR2+ day 1 vs ChR2+ day 2 p=0.040, ChR2− day 2 vs ChR2+ day 2 p=0.013; *p<0.05. (E) The average lap to lap place field correlation on familiar task with ChR2 Day 2 rats showing decreased field correlation. Kolmogorov-Smirnov Test **p<0.01. Subplot bar graph displaying the overall average day 2 field correlation. Mann-Whitney p=0.023; *p<0.05. (F) Representative heat maps of place field spatial encoding on the familiar task. Top two represent lower correlation fields from ChR2 Day 2. Bottom two represent higher correlation fields from Control Day 2. (G) Average place field shift per lap on the familiar task on Day 1 and Day 2. Part D and G: Control Day 1 n=66, ChR2 Day 1 n=40, Control Day 2 n=37, ChR2 n=32 (one outlier removed from Control Day 2). Kruskal-Wallis, Dunn post hoc: ChR2− day 2 vs ChR2+ day 2 p=0.046; *p<0.05. Bar graphs displayed as mean ± sem. See also Figure S3
Figure 3.
Figure 3.. LC stimulation during sleep impairs learning and memory.
(A) The average errors per lap by day for the ChR2− and the ChR2+ groups on the altered task. Two-way ANOVA, Sidak post hoc (in black): ChR2− vs ChR2+ day 4 p=0.0012, day 5 p=0.0017. Two-way ANOVA, Tukey post hoc (in yellow): ChR2− day 1 vs day 5 p=0.002. **p<0.005. (B) The average errors per lap for ChR2− and stimulated ChR2+ group on the familiar task. Two-way ANOVA, Sidak post hoc (in black): ChR2− vs ChR2+ day 4 p=0.0032, day 5 p=0.0004. Two-way ANOVA, Tukey post hoc (in blue): ChR2+ day 1 vs day 5 p<0.0001. (C) The average errors per lap for ChR2− and ChR2+ groups on the novel task with both groups meeting criteria of less than one error per lap after three days of maze running. Two-way ANOVA, Tukey post hoc: ChR2− day 8 vs day 10 (in yellow) p=0.0019, ChR2+ day 8 vs ChR2+ day 10 (in blue) p=0.0084. Five rats for each group for part A and B; three rats for each group in part C. Data displayed as mean ± sem. *p<0.05 **p<0.005, ***p<0.0005, ****p<0.0001.
Figure 4.
Figure 4.. LC stimulation during sleep alters maze solving strategies
(A) Schematic showing difference between procedural errors and map errors. Red dots would be map errors on the familiar task as they are only baited during the altered task, and blue dots represent map errors on the altered task as those boxes are only baited on the familiar task. Purple dots are boxes that are consistent whether baited or non-baited between the familiar and the altered task. (B) ChR2− group altered task performance broken down by error type. Two-way ANOVA, Sidak post hoc: map vs procedural errors day 1 p<0.0001, day 2 p=0.0012, day 3 p=0.0012, day 4 p=0.0001, day 5 p=0.0009. *p<0.005. (C) ChR2+ group performance on the altered task broken down by error type. Two-way ANOVA, Sidak post hoc: map vs procedural errors: day 1 p=0.0016. *p<0.005. (D) ChR2− group performance on the familiar task broken down by error type. Two-way ANOVA, Sidak post hoc: map vs procedural errors day 3 p=0.01, day 4 p=0.0047. *p<0.05 (E) ChR2+ performance on the familiar task broken down by error type. Five rats in each group for part B-E. Dots and error bars represent day mean± sem.
Figure 5.
Figure 5.. LC stimulation does not produce changes in sleep architecture but does alter spectral power.
(A) The percent time spent awake and sleeping compared to total time (B) The percent of total sleep spent in slow wave sleep, in intermediate sleep, and in REM sleep. (C) The number of transitions from NREM sleep to wake and REM sleep to wake within the first hour of sleep. (D) Percent change from baseline to Day 1 in CA1 LFP spectral power during waking, slow wave sleep, intermediate sleep, REM sleep. Five control rats, four ChR2 rats for part A-D. Two-way ANOVA, Sidak post hoc. Bars represent mean ± sem. (E) Percent change in band power from baseline to day 1 sleep. 1–4 Hz, θ 5–9 Hz, σ 10–15 Hz, β 16–20 Hz, γslow 30–50, γfast 61–100 Hz for all figures. Two-way ANOVA, Sidak post hoc: SWS delta p=0.0067; IS delta p=0.0007 sigma p=0.0009; REM theta p=0.005. *p<0.05, **p<0.01, ***p<0.005.
Figure 6.
Figure 6.. Changes in REM sleep theta power and NREM spindle occurrence from baseline sleep to day 1 sleep with LC stimulation.
(A) The percent change from baseline to day 1 in REM sleep theta power vs day 5 altered task total errors (left) and day 5 familiar task total errors. ChR2+ vs ChR2− change in REM theta (x axis comparison) Mann-Whitney p=0.0079. ChR2+ vs ChR2− altered task errors (y axis comparison) Mann-Whitney p=0.008. ChR2+ vs ChR2− familiar task errors (y axis comparison) Mann-Whitney p=0.016. (B) The percent change from baseline to day 1 in CA1 spindle occurrence during NREM sleep vs day 5 altered task total errors (left) and day 5 familiar task total errors. ChR2+ vs ChR2− change in spindle rate (x axis comparison) Mann-Whitney p=0.016. ChR2+ vs ChR2− altered task errors (y axis comparison) Mann-Whitney p=0.008. ChR2+ vs ChR2− familiar task errors (y axis comparison) Mann-Whitney p=0.016. Error bars represent the minimum and maximum within a data set; vertical and horizontal lines cross at the mean from each group, marked with symbols for both A and B. (C) The effect of LC stimulation on CA1 sigma power within spindles. Normalized CA1 sigma power is shown in relation to light stimulation events within spindles (n=700). Events were then shuffled within spindles to preserve spindle specificity for ten shuffled data sets of 700 shuffled events each. A two-way ANOVA, Sidak post hoc was calculated for the real data (n=700 events) vs. each shuffled set individually (n=700 per set), and then against the average of all ten shuffles. The effect of light stimuli was nonrandom (p<0.05 from shuffled) for t= −0.04 to 0.18 for all individual and the combined two-way ANOVAs. Light stimulation significantly reduced sigma RMS; two-way ANOVA, Dunnett post hoc light onset t=0 vs t>0. #p<0.05 at t=0.088 seconds and onward. (D) The percent change in occurrence of spindles greater or less than 0.6 seconds in length. Two-way ANOVA, Sidak post hoc ChR2− vs ChR2+ p=0.013 Data displayed as mean ± sem. *p<0.05, **p<0.01. See also Figure S4 and Table S1.
Figure 7.
Figure 7.. LC stimulation during sleep interferes with ripple-spindle coupling.
(A) Spindle onset probability displayed in respect to ripple onset at t=0 during baseline sleep. Ripple onset timestamps were shuffled within NREM sleep periods with no repeating timestamps within trials, and were shuffled for a total of 15 trials to ensure coupling was non-random. Two-way ANOVA, Sidak post hoc; ChR2+ vs ChR2+ shuffled p<0.0001; ChR2− vs ChR2− shuffled p<0.0001. There was no difference between the shuffled values for ChR2+ and ChR2− groups (p=0.997), therefore only ChR2+ shuffled values are displayed for visual purposes. Any probability within the gray region represents random for both ChR2+ and ChR2−. As there was no difference between either groups shuffled data in part B as well (p=0.958), within part B the gray region represents both ChR2+ and ChR2− shuffled data. (B) Spindle onset probability displayed in respect to ripple onset at t=0 during Day 1 sleep with 2 Hz LC stimulation. Two-way ANOVA, Sidak post hoc; ChR2+ vs ChR2+ shuffled p<0.0001; ChR2− vs ChR2− shuffled p<0.0001. ChR2− vs ChR2+ from t=−50 to −250 msec p<0.0001. ChR2−=4, ChR2+=5 ***p<0.0001. Displayed as mean (line) ± sem (shaded region). See also Figure S5.

Similar articles

Cited by

References

    1. Wierzynski CM, Lubenov EV, Gu M, and Siapas AG (2009). State-Dependent Spike-Timing Relationships between Hippocampal and Prefrontal Circuits during Sleep. Neuron 61, 587–596. - PMC - PubMed
    1. Siapas AG, and Wilson MA (1998). Coordinated Interactions between Hippocampal Ripples and Cortical Spindles during Slow-Wave Sleep. Neuron 21, 1123–1128. - PubMed
    1. Sirota A, Csicsvari J, Buhl D, and Buzsáki G. (2003). Communication between neocortex and hippocampus during sleep in rodents. Proc. Natl. Acad. Sci. 100, 2065–2069. - PMC - PubMed
    1. Ji D, and Wilson MA (2007). Coordinated memory replay in the visual cortex and hippocampus during sleep. Nat. Neurosci. 10, 100–107. - PubMed
    1. Sara SJ (2009). The locus coeruleus and noradrenergic modulation of cognition. Nat. Rev. Neurosci. 10, 211–223. - PubMed

Publication types