. 2019 Jan 2;27(1):175-188.e6.
doi: 10.1016/j.str.2018.09.011. Epub 2018 Nov 1.

Bayesian Weighing of Electron Cryo-Microscopy Data for Integrative Structural Modeling

Affiliations

Bayesian Weighing of Electron Cryo-Microscopy Data for Integrative Structural Modeling

Massimiliano Bonomi et al. Structure. .

Abstract

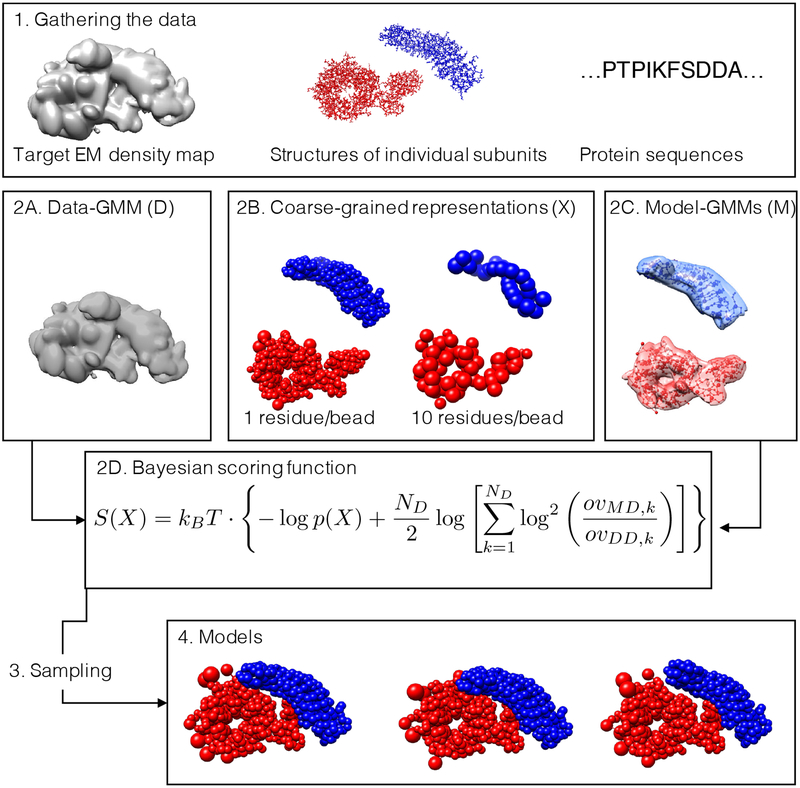
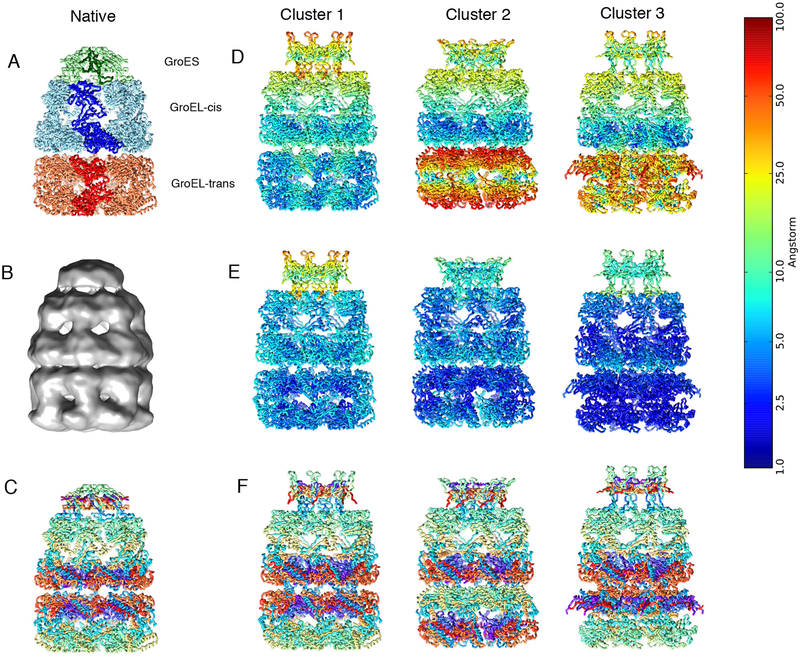
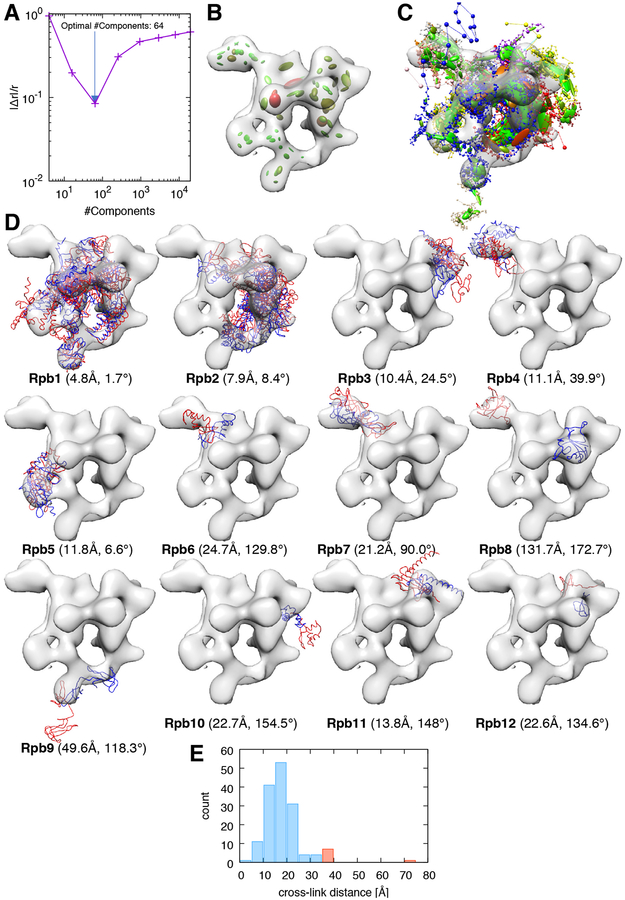
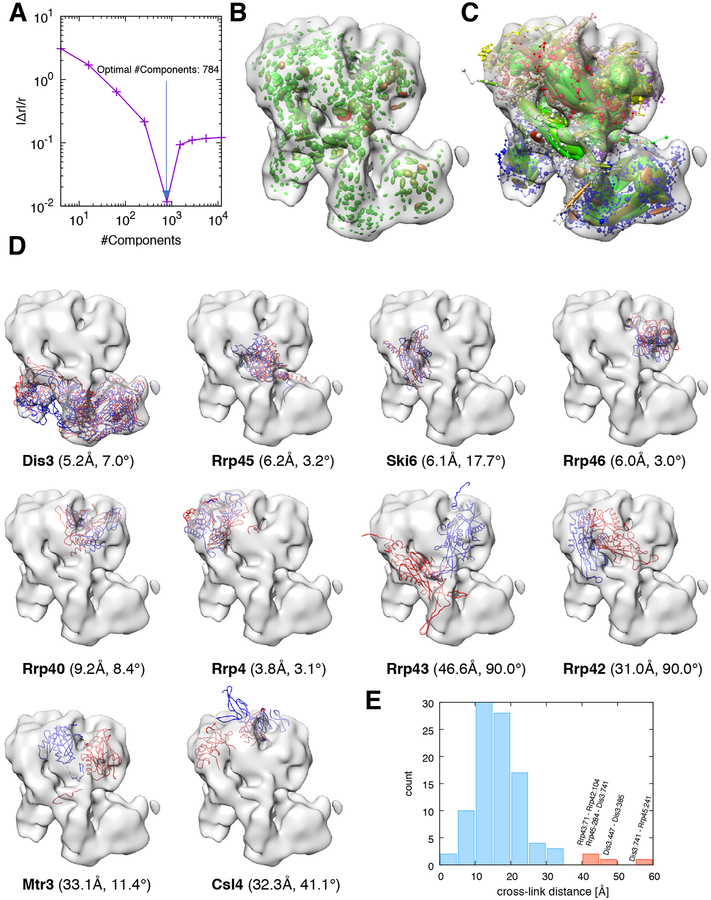
Cryo-electron microscopy (cryo-EM) has become a mainstream technique for determining the structures of complex biological systems. However, accurate integrative structural modeling has been hampered by the challenges in objectively weighing cryo-EM data against other sources of information due to the presence of random and systematic errors, as well as correlations, in the data. To address these challenges, we introduce a Bayesian scoring function that efficiently and accurately ranks alternative structural models of a macromolecular system based on their consistency with a cryo-EM density map as well as other experimental and prior information. The accuracy of this approach is benchmarked using complexes of known structure and illustrated in three applications: the structural determination of the GroEL/GroES, RNA polymerase II, and exosome complexes. The approach is implemented in the open-source Integrative Modeling Platform (http://integrativemodeling.org), thus enabling integrative structure determination by combining cryo-EM data with other sources of information.

Keywords: Gaussian mixture model; bayesian inference; cross-linking mass spectrometry; cryo-electron microscopy; data weighing; integrative structural modeling; macromolecular complexes; structural biology.


Conflict of interest statement

Declaration of Interests

The authors declare no competing interests.

Figures

Figure 1:
Figure 1:. Workflow for multi-scale modeling of cryo-EM data.
(1) The input information for the modeling protocol consists of: an experimental cryo-EM density map (left), the structures of the subunits (center), and the sequences of the subunits (right). (2A) The density map is fitted with a GMM (ie, the data-GMM) using our divide-and-conquer approach. (2B) The atomistic coordinates of the subunits are suitably coarse-grained into large beads. Regions without a known atomistic structure are represented by a string of large beads, each representing a set of residues. (2C) GMM for the subunits (ie, the model-GMMs) are also computed from the atomistic coordinates. (2D) The Bayesian scoring function encodes prior information about the system and measures the agreement between the data-GMM and the model-GMM. (3) Structural models are sampled by MC coupled with replica exchange, with or without the iterative sampling protocol. (4) The generated models are analysed.
Figure 2:
Figure 2:. Divide-and-conquer approach for fitting cryo-EM density maps with a Gaussian mixture model (GMM).
(A) The input map is thresholded according to the recommended threshold. (B) The resulting map is initially fitted using a GMM with 2 components. (C) Each component of the GMM is used to partition the map into overlapping sub-maps. (D) Each sub-map is fitted using a GMM with 2 components, similarly to step B. (E) The sum of all the GMMs of the sub-maps results in a data-GMM that approximates the original map. The accuracy of approximation increases at every iteration. (F) The fitting procedure is iterated until the data-GMM reaches an optimal accuracy. The green arrow indicates a branch that was stopped because the local CC was higher than 0.95.
Figure 3:
Figure 3:. Benchmark of the divide-and-conquer fit of the data-GMM.
(A) The accuracy of the divide-and-conquer approach is measured using the correlation coefficient between the input map and the corresponding data-GMMs obtained at different iterations. The accuracy increases with the number of components in the mixture, and the saturation point (ie, the number of components beyond which the accuracy does not increase significantly) depends on the resolution of the experimental map (red and blue curves are low and high resolutions, respectively). (B) Relationship between map resolution and number of components of the data-GMM. For all the density maps of panel A, the experimental resolution is plotted as a function of the optimal number of components of the data-GMM normalized by the molecular weight of the complex (solid circles). The points are fitted using a power law (blue line). The orange and purple circles correspond to maps whose resolution was determined by the Fourier Shell Correlation 0.143 and 0.5, respectively. (B, inset) For each density map, the optimal number of components is computed as the minimal absolute relative deviation |Δr|/r between the data-GMM resolution and the density map resolution.
Figure 4:
Figure 4:. Benchmark of the modeling protocol.
Examples of each of the three possible outcomes of the benchmark: positive (first column, PDB code 3NVQ), partial positive (second column, PDB code 3LU0), and negative (third column, PDB code 1TYQ). (A) Native structures and simulated 10 Å resolution cryo-EM density maps. (B) 50 best scoring models displayed with the simulated cryo-EM density maps. (C) Residue-wise accuracy of the best scoring models: residues whose positions deviate from the native structure less than 10 Å, between 10 and 20 Å, and above 20 Å are coloured in blue, green, and red, respectively. (D) Total score of all the sampled models as a function of the total rmsd from the native structure.
Figure 5:
Figure 5:. Modeling of the GroEL/ES complex.
(A) Native structure of the GroEL/ES complex (PDB code 1AON). (B) Cryo-EM density map of GroEL/ES (EMDB 1046). (C) Residue indexes are color-coded using a rainbow palette, where the N-terminus is violet, the C-terminus is red, and intermediate residues are green and yellow. The three columns on the right are the representative structures of the three best-scoring clusters color coded using the rmsd from the native structure per residue (D), the per-residue precision (E), and the same color coding as in (C) to emphasize the orientation of the subunits. The color bar on the left refers to the panels (D) and (E).
Figure 6:
Figure 6:. Integrative modeling of the RNA polymerase II.
(A) Absolute relative deviation between data-GMM and experimental map resolutions |Δr|r, plotted as a function of the number of components of the data-GMM. The minimum (blue arrow) corresponds to the optimal number of components used in the modeling (64 Gaussians). (B) The experimental cryo-EM density map (transparent grey surface) is represented with the optimal data-GMM (colored ellipsoids). The color gradient (from green to red) is proportional to the weight ωD,i of the corresponding Gaussian. The length of the three axes and their orientation represent the 3-dimensional covariance matrix ΣD,i. (C) Representation of the best-scoring model. Coarse-grained subunits are represented by the strings of beads: the small beads and large beads represent 1- or 20-residue fragments, respectively. As for the data-GMM in panel B, the model-GMM is represented by ellipsoids. (D) All subunits of the model (red) and reference structure (PDB code 1WCM, blue) are represented along with the experimental cryo-EM map. For each panel, the name of the subunit is indicated in bold, together with the placement score of that subunit. (E) Histogram of the distance between cross-linked residues. The histogram bins corresponding to satisfied and violated cross-links are represented in blue and red, respectively.
Figure 7:
Figure 7:. Integrative modeling of the exosome complex.
We report the same information as in Fig. 6 for the case of the yeast exosome complex, with the following differences: (A) the optimal number of components used in the modeling is 784; (D) the reference structure is taken from PDB code 5G06.

References

    1. Abergel C, Monchois V, Byrne D, Chenivesse S, Lembo F, Lazzaroni JC, and Claverie JM (2007). Structure and evolution of the Ivy protein family, unexpected lysozyme inhibitors in Gram-negative bacteria. P Natl Acad Sci USA 104, 6394–6399. - PMC - PubMed
    1. Adams PD, Afonine PV, Bunkoczi G, Chen VB, Echols N, Headd JJ, Hung LW, Jain S, Kapral GJ, Kunstleve RWG, et al. (2011). The Phenix software for automated determination of macromolecular structures. Methods 55, 94–106. - PMC - PubMed
    1. Armache K-J, Mitterweger S, Meinhart A, and Cramer P (2005). Structures of Complete RNA Polymerase II and its Subcomplex, Rpb4/7. J Biol Chem 280, 7131. - PubMed
    1. Bai XC, McMullan G, and Scheres SH (2015). How cryo-EM is revolutionizing structural biology. Trends in Biochemical Sciences 40, 49–57. - PubMed
    1. Bernecky C, Herzog F, Baumeister W, Plitzko JM, and Cramer P (2016). Structure of transcribing mammalian RNA polymerase II. Nature 529, 551-+. - PubMed

Publication types

MeSH terms