. 2019 Jan 17;26(1):35-47.e7.
doi: 10.1016/j.chembiol.2018.10.005. Epub 2018 Nov 1.

Synthetic Fluorogenic Peptides Reveal Dynamic Substrate Specificity of Depalmitoylases

Affiliations

Synthetic Fluorogenic Peptides Reveal Dynamic Substrate Specificity of Depalmitoylases

Neri Amara et al. Cell Chem Biol. .

Abstract

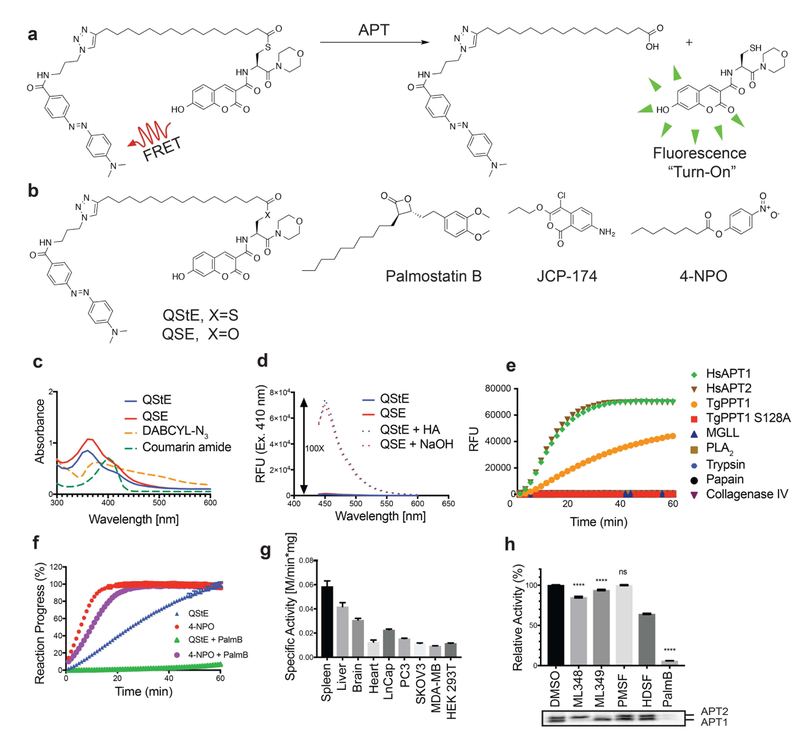
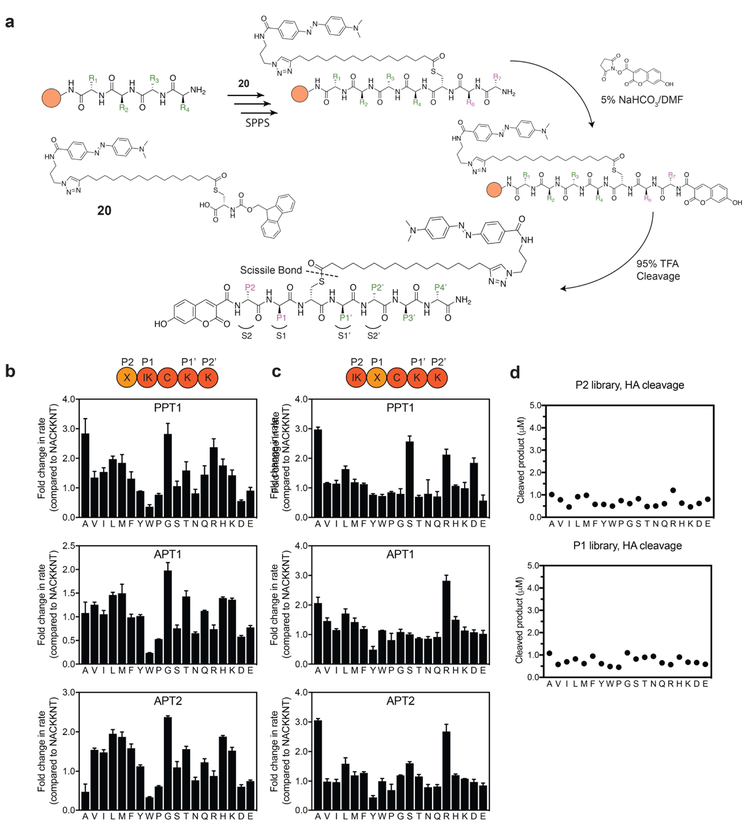
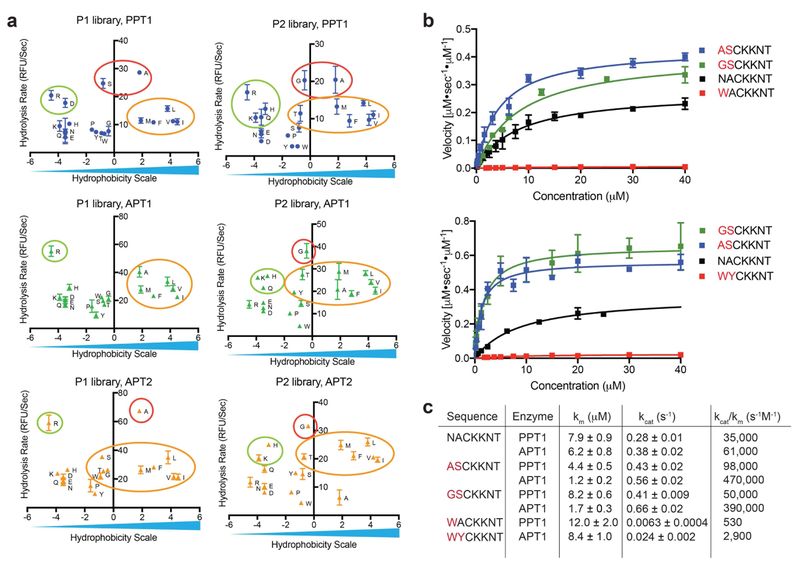
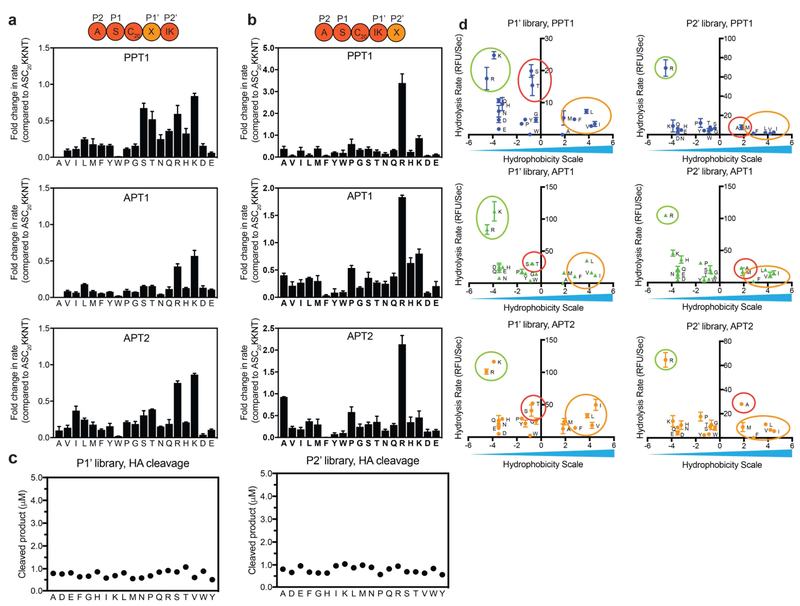
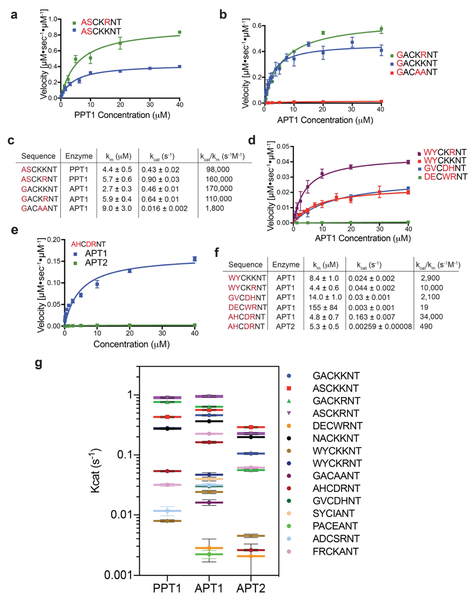
Palmitoylation is a post-translational modification involving the thioesterification of cysteine residues with a 16-carbon-saturated fatty acid. Little is known about rates of depalmitoylation or the parameters that dictate these rates. Here we report a modular strategy to synthesize quenched fluorogenic substrates for the specific detection of depalmitoylase activity and for mapping the substrate specificity of individual depalmitoylases. We demonstrate that human depalmitoylases APT1 and APT2, and TgPPT1 from the parasite Toxoplasma gondii, have distinct specificities that depend on amino acid residues distal to the palmitoyl cysteine. This information informs the design of optimal and non-optimal substrates as well as isoform-selective substrates to detect the activity of a specific depalmitoylase in complex proteomes. In addition to providing tools for studying depalmitoylases, our findings identify a previously unrecognized mechanism for regulating steady-state levels of distinct palmitoylation sites by sequence-dependent control of depalmitoylation rates.

Keywords: chemical probes; combinatorial libraries; depalmitoylases; dynamic palmitoylation; fluorogenic peptides; substrate specificity; thioesterases.


Figures

Figure 1:
Figure 1:. Design of a quenched fluorogenic substrate for depalmitoylases.
a) Overall design of the fluorescently quenched substrate to detect depalmitoylase activity. The substrate contains a S-palmitoyled cysteine carrying a quencher molecule that is released upon thioester hydrolysis by the depalmitoylase, producing a fluorescent peptide product. b) Chemical structures of the thioester (QStE) and ester (QSE) fluorogenic substrates, Palmostatin B, the T. gondii PPT1 specific inhibitor JCP-174 and the general colorimetric esterase substrate 4-nitropehyl octanoate (4-NPO) c) Absorbance spectra of QStE, QSE (at 1 mM) and the precursor fluorophore (Coumarin amide) and quencher (DABCYL-N3). d) Fluorescence spectra of QStE and QSE (at 10 μM, Ex=410 nm, Em=450 nm), before and after chemical hydrolysis with 5% hydroxylamine (HA) or 0.1M sodium hydroxide (NaOH) for 30 minutes. e) Measurement of QStE hydrolysis (at 10 μM) by the indicated recombinant depalmiylases (HsAPT1 at 50 nM, HsAPT2 at 150 nM, and TgPPT1 at 100 nM), esterases (MGLL and PLA2 at 500 nM) and proteases (Trypsin and Papain at 100 nM and Collagenase IV at 1 mg/ml). The catalytically dead TgPPT1 is included as a negative control (TgPPT1 S128A at 100 nM). f) Plot of the hydrolysis of QStE and 4-NPO in mouse liver homogenates in the presence of the general depalmitoylase inhibitor Palmostatin B. Lysates (20 μg) were incubated with DMSO or Palmostatin B (10 μM) for 30 minutes on ice before the addition of substrates (5 μM). g) Specific activity of depalmitoylases measured with QStE in different organ homogenates and cell line lysates. QStE was added to lysates (20 μg) at varying concentrations and the initial rates of hydrolysis were used to calculate the specific activity. h) Relative activity of depalmitoylases measured with QStE in PC3 cell lysate, treated with the isotype-selective inhibitors ML348 and ML349, the general serine hydrolase inhibitor phenylmethylsulfonyl fluoride (PMSF), the serine hydrolase inhibitor hexadecylsulfonyl fluoride (HDSF) and Palmostatin B (PalmB). Lower panel shows the residual activity of APT1 and APT2 (as indicated) after treatment with each inhibitor by labeling lysates with the ABP fluorophosphonate-rhodamine (FP-Rho). Lysates (at 20 μg) were incubated with DMSO or inhibitors (10 μM) for 30 minutes on ice before the addition of QStE (5 μM). Error bars represent S.D. of three replicates. Statistical significance is calculated using ordinary oneway ANOVA compared with DMSO (**** P=0.001, n.s. P=0.9999). See also figure S3.
Figure 2:
Figure 2:. Positional scanning libraries highlight substrate specificities of APTs at positions P1 and P2.
a) Synthesis scheme for preparation of quenched fluorogenic substrates using solid phase peptide synthesis (SPPS). Peptide libraries were synthesized on a rink amide resin, the palmitoyl mimic containing DABCYL was synthesized as an Fmoc protected cysteine analogue (compound 20 or C20) and coupled instead of cysteine in the sequence. The N-terminus was capped with the flourophore 7-hydroxy-3-carboxycoumarin. Peptide positions spanning the thioester-containing cysteine analogue from the N-terminus side are referred to as P1, P2.., and from the C-terminus side as P1’, P2’... Libraries contain combinatorial mixtures (marked X) of all natural amino acids (excluding cysteine) at position P2 or position P1 and an isokinetic mixture of the same amino acids at the adjacent position (marked IK). b) Plots of fold-change in hydrolysis rates for each P2 scanning sublibrary relative to the reference peptide NAC20KKNT. Error bars represent S.D. of three replicates c). Same as in b) for the P1 positional scanning sublibraries. d) Effective concentration of each library was evaluated by chemical cleavage of the thioester bond by incubation with 5% HA for 30 minutes. Concentrations were estimated using a standard curve generated from non-quenched substrates. DBU = 1,8-Diazabicyclo(5.4.0)undec-7-ene. HA = hydroxylamine. See also figure S4.
Figure 3:
Figure 3:. Validation of substrate specificity using fluorogenic peptides designed from the library screening data.
a) Rates of hydrolysis for each amino acid substitution, measured with P1 or P2 libraries plotted relative to a hydrophobicity scale (adopted from Kyte and Doolittle(Kyte and Doolittle, 1982)). Small aliphatic residues (red circles) are favored at positions P1 and P2 and result in fast hydrolysis rates, positively charged residues (green circles) as well as hydrophobic aliphatic residues (yellow circles) result in moderate hydrolysis rates for all three depalmitoylases. b) Michaelis Menten plots showing rates of hydrolysis of the indicated fluorogenic peptides synthesized based on data from the positional scanning libraries. Each point represents mean and standard deviation of three replicates c) Catalytic rates and efficiencies of the fluorogenic peptides derived from the Michaelis Menten plots in (b). See also table S1 and figure S1 and S2.
Figure 4:
Figure 4:. Residues in the P1’ and P2’ positions of fluorogenic substrates dramatically impact rate of hydrolysis.
Plots of fold-change from the rate measured for the optimal substrate ASC20KKNT in which the C-terminal position P1’ (a) or P2’ (b) are scanned through the indicated amino acids (one letter codes). Hydrolysis was measured and initial rates calculated from the time curves. Error bars represent standard deviation of three replicates. c) Effective concentration of each library was evaluated by chemical cleavage of the thioester bond by incubation with 5% HA for 30 minutes. Concentrations were estimated using a standard curve generated from non-quenched substrates. d) Plots of the rates of hydrolysis for each amino acid substitution, measured for the P1’ or P2’ positional scanning libraries relative to hydrophobicity scale. Polar interactions with positively charged residues (green circles) are favored at both positions, polar aliphatic residues (red circles) are favored at position P1’ only by TgPPT1. Moderate preference for alanine at P2’, isoleucine and threonine at P1’ (yellow circles) is seen only for APT2. See also figure S4
Figure 5:
Figure 5:. Engineering of fluorogenic peptide substrates based on substrate specificity profiles.
Michaelis Menten plots comparing the kinetic curves of optimized peptides, measured with (a) TgPPT1 or (b) HsAPT1. Each point represents the mean and standard deviation of three replicates. c) Catalytic efficiencies of the fluorogenic peptides derived from the Michaelis Menten plots in (a) and (b). d) Michaelis Menten plot comparing kinetic curves of suboptimized and least optimized peptides measured for HsAPT1. e) Activity of the selective substrate AHC20DRNT for HsAPT1 and HsAPT2. f) Catalytic efficiencies of the fluorogenic peptides derived from the Michaelis Menten plots in (d) and (e). g) Plot of Kcat values for the indicated fluorogenic substrates for TgPPT1 HsAPT1 and HsAPT2. Error bars represent S.D. of three replicates. See also table S1 and figures S1, S2 and S6.
Figure 6:
Figure 6:. Specificity of fluorogenic peptides in complex proteomes.
a) Activity of endogenous depalmitoylases measured in T. gondii lysates (at 5 μg) using the optimized fluorgenic substrates (at 2.5 μM). Error bars represent the S.D. of three replicates. b) Normalized rate of hydrolysis for the ASC20KRNT substrate (at 2.5 μM) measured in Ku80 T. gondii lysates (at 5 μg) untreated (WT) or treated with JCP174 (JCP174, 10 μM) or Palmostatin B (PalmB, 10 μM) and untreated PPT1 knockout (ΔPPT1) T. gondii lysates (at 5 μg). Error bars represent S.D. of three biological replicates and 3 technical replicates. Statistical significance is calculated using one-way ANOVA (**** p < 0.0001), (*** p = 0.0003), (* p = 0.0252). c) Activity of endogenous depalmitoylases measured in mammary breast tumor homogenate (at 5 μg) using optimized and non-optimal fluorogenic substrates (at 2.5 μM). Error bars represent the S.D. of three replicates. d) and e) Normalized rate of hydrolysis for ASC20KKNT and AHC20DRNT (at 2.5 μM) measured in tumor homogenates treated with vehicle (DMSO) or the inhibitors ML348, ML349 and Palmostatin B (at 10 μM). Error bars represent S.D. of three biological replicates and 3 technical replicates. Statistical significance is calculated using one-way ANOVA (**** p = 0.0001), (ns p = 0.6711). See also figure S5.

Comment in

Similar articles

Cited by

References

    1. Adibekian A, Martin BR, Chang JW, Hsu KL, Tsuboi K, Bachovchin DA, Speers AE, Brown SJ, Spicer T, Fernandez-Vega V, et al. (2010). Characterization of a Selective, Reversible Inhibitor of Lysophospholipase 2 (LYPLA2) In Probe Reports from the NIH Molecular Libraries Program (Bethesda (MD)). - PubMed
    1. Ahearn IM, Tsai FD, Court H, Zhou M, Jennings BC, Ahmed M, Fehrenbacher N, Linder ME, and Philips MR (2011). FKBP12 binds to acylated H-ras and promotes depalmitoylation. Mol Cell 41, 173–185. - PMC - PubMed
    1. Baker TL, Zheng H, Walker J, Coloff JL, and Buss JE (2003). Distinct rates of palmitate turnover on membrane-bound cellular and oncogenic H-ras. J Biol Chem 278, 19292–19300. - PubMed
    1. Breuza L, Poux S, Estreicher A, Famiglietti ML, Magrane M, Tognolli M, Bridge A, Baratin D, Redaschi N, and UniProt C (2016). The UniProtKB guide to the human proteome. Database (Oxford) 2016. - PMC - PubMed
    1. Chen B, Zheng B, DeRan M, Jarugumilli GK, Fu J, Brooks YS, and Wu X (2016). ZDHHC7-mediated S-palmitoylation of Scribble regulates cell polarity. Nat Chem Biol 12, 686–693. - PMC - PubMed

Publication types