. 2018 Nov 12;34(5):852-862.e4.
doi: 10.1016/j.ccell.2018.10.003. Epub 2018 Nov 1.

Widespread Selection for Oncogenic Mutant Allele Imbalance in Cancer

Affiliations

Widespread Selection for Oncogenic Mutant Allele Imbalance in Cancer

Craig M Bielski et al. Cancer Cell. .

Abstract

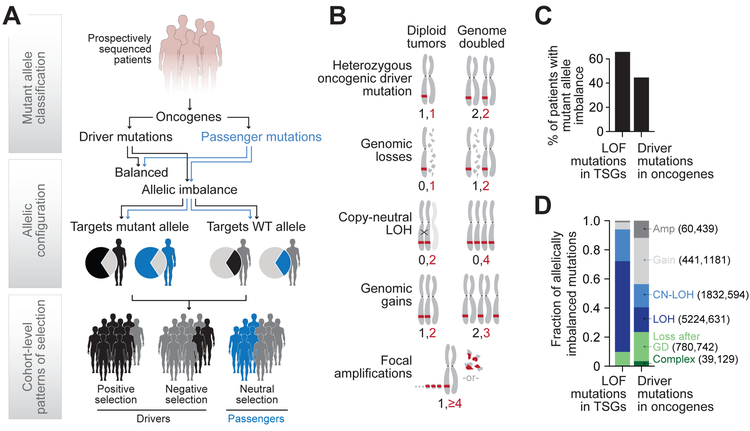
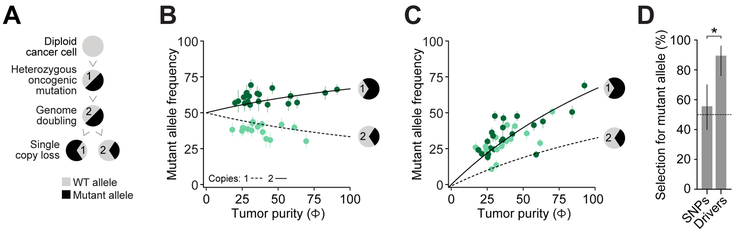
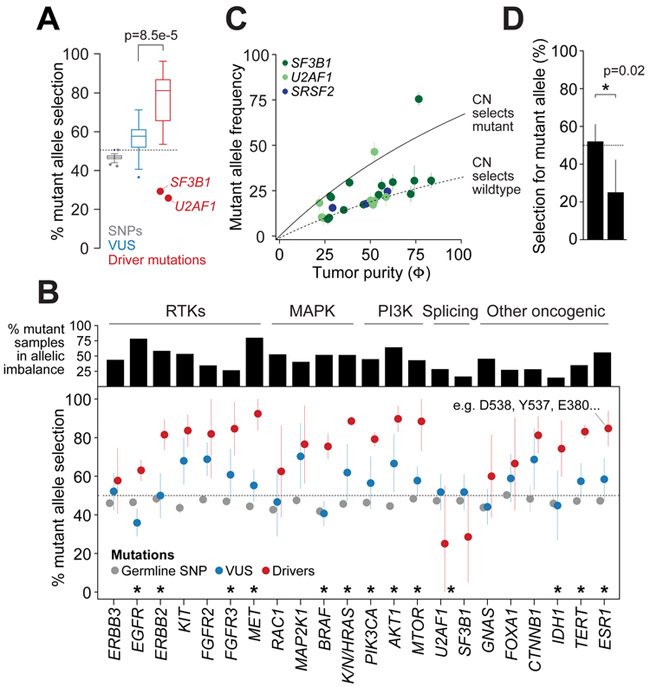
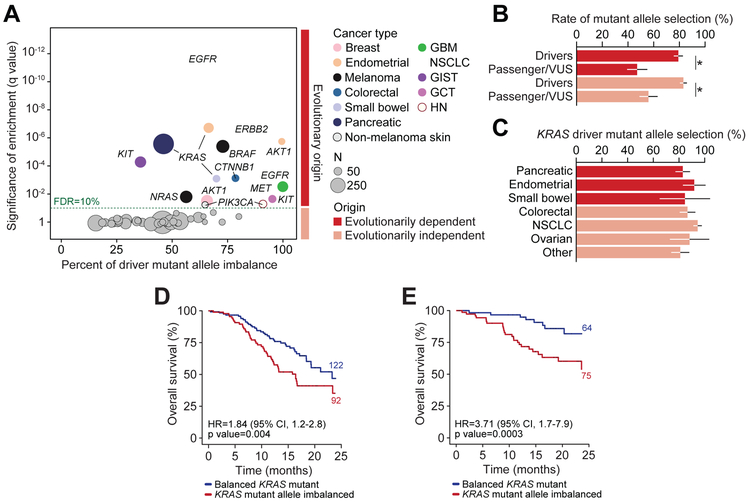
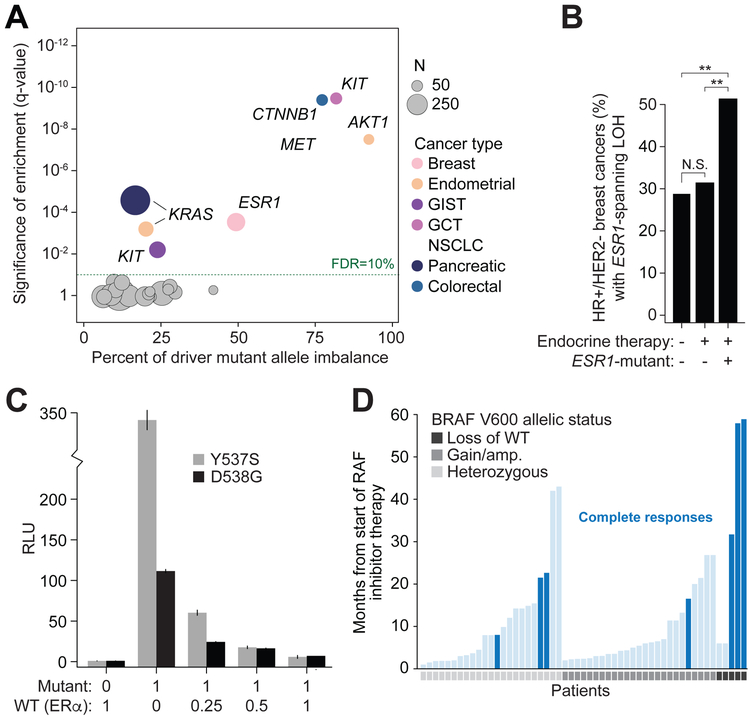
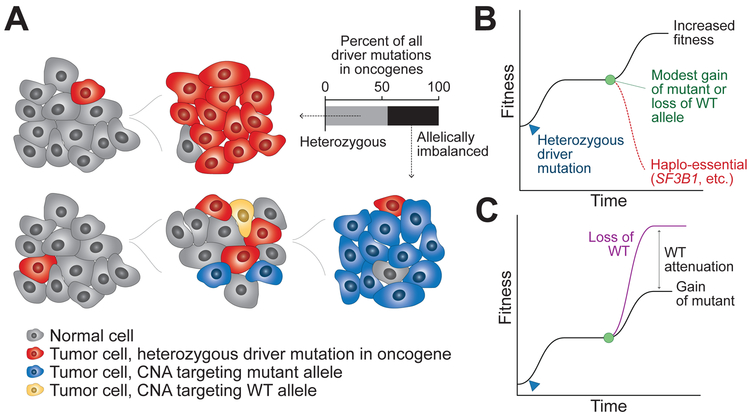
Driver mutations in oncogenes encode proteins with gain-of-function properties that enhance fitness. Heterozygous mutations are thus viewed as sufficient for tumorigenesis. We describe widespread oncogenic mutant allele imbalance in 13,448 prospectively characterized cancers. Imbalance was selected for through modest dosage increases of gain-of-fitness mutations. Negative selection targeted haplo-essential effectors of the spliceosome. Loss of the normal allele comprised a distinct class of imbalance driven by competitive fitness, which correlated with enhanced response to targeted therapies. In many cancers, an antecedent oncogenic mutation drove evolutionarily dependent allele-specific imbalance. In other instances, oncogenic mutations co-opted independent copy-number changes via the evolutionary process of exaptation. Oncogenic allele imbalance is a pervasive evolutionary innovation that enhances fitness and modulates sensitivity to targeted therapy.

Keywords: cancer; competitive fitness; exaptation; oncogenes; selection; targeted therapy.


Figures

Figure 1
Figure 1. Oncogenic mutant allele imbalance in advanced cancers.
(A) Somatic mutations were identified in a cohort of 13,448 prospectively sequenced advanced cancers and mutations in one of 69 frequently mutated oncogenes were classified as known drivers or likely passenger mutations [including variants of uncertain significance (VUS)]. The number of copies of the mutant and WT alleles were determined in each affected tumor based on allele-specific and integer copy number data in the same tumors after correcting for tumor cell purity and clonality. Positive, neutral, or negative selection was assessed as a function of the expected versus observed rate by which mutant and WT copies are targeted by the underlying allele-specific chromosomal changes. (B) Categories of oncogenic mutant allele imbalance characterized here are shown for tumors with an underlying diploid genome and for those that underwent genome doubling (WGD) with the red hash indicating an oncogenic mutation and the numbers at bottom reflecting the final WT and mutant allele configurations. Complex combinatorial events are not shown. The X for CN-LOH reflects linkage between two chromosomes, as in the case of uniparental disomy. (C) The percent of all tumors with mutations of the indicated types in allelic imbalance. (D) The different mechanisms of allelic imbalance of the indicated mutation classes. The mechanism of allelic imbalance is labeled and the number of allelically imbalanced mutations targeted by each category are provided in parentheses (for TSGs and oncogenes respectively). See also Figure S1 and Tables S1-S4.
Figure 2
Figure 2. Positive selection for gain-of-function mutant allele imbalance.
(A) Approach for utilizing single-copy losses after WGD to ascertain selection for oncogenic mutant alleles. (B) In 36 tumors, the observed mutant allele frequency in the tumor for germline heterozygous SNPs in oncogenes in regions spanned by single-copy losses acquired after WGD (as in panel A) are shown as a function of tumor purity. The mutant allele frequency for the SNPs when the reference or non-reference allele were retained or lost (dark and light green, respectively). Points are tumors and vertical lines are the 95% confidence interval (CI) of the mutant allele frequency and the solid/dashed lines represent the 2- and 1-copy lines corresponding to the count of mutant alleles at a 3-copy locus due to loss after WGD. (C) For the same tumors shown in panel B, the pattern of mutant allele imbalance for the corresponding gain-of-function mutations in the same oncogenes is shown. Solid line corresponds to expected mutant allele frequencies for retention of the mutant allele (elevated ratio of mutant to WT alleles). Points and error bars as described for panel B. (D) The rate at which the mutant allele is retained by the single-copy loss after WGD for the germline SNPs and driver mutations indicated in panels b and c, respectively (asterisk, p value = 4×10⁻⁷; Chi-squared test). Error bars are 95% CI. See also Figure S2.
Figure 3
Figure 3. Patterns of selection for oncogenic mutant allele imbalance across oncogenes.
(A) The rate of selection for the mutant allele among germline SNPs (gray) and somatic mutations that are either putative passenger mutations or variants of uncertain significance (VUS, blue) or known and likely driver mutations (red) in 24 oncogenes (p value as indicated, Wilcoxon test). Boxplot reflects the first and third quartile of data (boxes), the horizontal line is the median, the whiskers extend to +/− 1.5 times the inter-quartile range with outliers indicated as points. (B) The rate of selection for the mutant allele for the same 24 oncogenes and three mutation classes (as labeled) across all solid cancers grouped by function and/or pathway (RTK = receptor tyrosine kinases; MAPK = Ras/Raf/MEK/ERK pathway; PI3K = PI3 kinase signaling). The black bars at the top show the percentage of tumor samples with allelic imbalance for the indicated driver mutant oncogene(s). Error bars are the 95% CI. Dotted line indicates 50% and asterisk indicates statistically significant selection for the driver over passenger mutations by gene. KRAS, NRAS, and HRAS are grouped as a single mutant RAS category. (C) The pattern of mutant allele imbalance for the allele harboring the indicated driver mutations in haplo-essential mutant spliceosomal factors SF3B1, U2AF1, and SRSF2. Points are tumors and all tumors with allelic imbalance of any type are shown. Color indicates the mutant spliceosomal factor of interest (see inset), vertical lines are the 95% CI of the mutant allele frequency, and diagonal/curved dashed lines indicate the expected value in tumors in which the allele imbalance targets the mutant or WT allele (as labeled). Negative selection would be reflected as selection against the mutant allele. (D) The rate of selection for mutant allele-specific imbalance among the driver and likely passenger mutations in spliceosomal factors. Error bars are the 95% CI. P values as indicated, two-sided Fisher’s exact test. See also Figures S3 and S4.
Figure 4
Figure 4. Oncogenic mutations drive or co-opt their allelic imbalance.
(A) The statistical significance of enrichment of allelic imbalance in tumors by cancer type (indicated by color, see legend) harboring a driver mutation in the indicated gene over those tumors lacking a mutation (dashed line, false discovery rate (FDR) = 10%). The size of the circle corresponds to the number of driver-mutant cases by cancer type and oncogene. The evolutionary origins of allelic imbalance inferred from this analysis are indicated by red and pink bars at the right. (B) The rate of mutant allele-specific selection is shown for both driver mutations and presumed passenger mutations in those mutant oncogenes that drive the acquisition of their allelic imbalance (red, evolutionary dependent; as in panel A) or for those in which these two events evolved independently (pink). Neutral selection would be reflected as selection rates of approximately 50%, whereas positive selection would be reflected in increasing rates of selection. Error bars are the 95% CI. (C) The rate of selection for the KRAS mutant allele in affected lineages based on the evolutionary relationship between KRAS mutations and the underlying chromosome 12p changes leading to selection for the mutant allele (red and pink respectively, as labeled in panel A). Error bars are the 95% CI. (D-E) Overall survival in the presence or absence of KRAS allelic imbalance in patients with KRAS-mutant pancreatic adenocarcinomas (D) and colorectal cancers (E). Statistics and sample numbers as indicated from Cox proportional hazards models.
Figure 5
Figure 5. Functional and therapeutic significance of oncogenic mutant allele imbalance.
(A) As in the Figure 4A, but assessing the enrichment for loss of the WT allele as the mechanism of mutant allele imbalance. (B) In HR+ HER2 breast cancers, the rate of LOH spanning ESR1 in tumors with or without ESR1 gain-of-function mutations and those acquired before or after endocrine therapy (asterisk, p value = 0.00015, Chi-squared test; numbers in black bars represent the number of affected cases). (C) Luciferase reporter activity (RLU) in HR SKBr3 cells ectopically expressing HA-ERα wild-type (WT) or the specified mutant in proportions equivalent to homozygous mutant (left) to heterozygosity (right) in hormone-depleted medium. Error bars are +/− SD from triplicate experiments. (D) Duration of time of patients with BRAF V600E-mutant metastatic melanomas on vemurafenib therapy as a function of allelic imbalance of V600E and the mechanisms thereof [median PFS is 31.7 months (95% CI, 6-not reached) for patients with loss of WT BRAF versus 6.5 months (4.8-12) in the rest; hazard ratio, 4.4; p value = 0.01]. Complete pathologic responses are indicated in dark blue (p value = 0.01 comparing patients whose tumors lost the WT allele to those whose tumors that do not, two-sided Fisher’s exact test). See also Figure S5.
Figure 6
Figure 6. Fitness and selection of serially evolving mutant oncogenes.
(A) Schematic representation whereby the acquisition of a heterozygous driver mutation in an oncogene (red), along with subsequent genomic events (not shown), leads to clonal outgrowth, representing approximately half of all human tumors with driver mutations in oncogenes (top). The other approximately half of all oncogenic driver mutations in human cancers that are targeted by serial genetic changes that when targeting the allele carrying the gain-of-function mutation confer a selective growth advantage on affected cancers by increasing and tuning the dosage of these mutations (bottom). (B) The preferential selection of the mutant allele by chromosomal changes (green) that come after a heterozygous oncogenic mutation (blue arrow) indicates that ~single copy dosage changes at mutant oncogenic loci enhance fitness and contribute to clonal outgrowth in most oncogenes, while in some specific contexts fitness appears to be reduced by such allelic imbalance where selection against possessing multiple copies of the mutant allele exists (red). (C) For oncogenes where (CN)-LOH is a predominant mechanism underlying their mutant allele imbalance, while ~single copy gain of the mutant allele can increase fitness, the effect of the oncogenic mutation may be attenuated by the continued presence of and competition with the WT allele, which drives selection for LOH as the mechanism of oncogenic mutant allele imbalance.

References

    1. Ambrogio C, Kohler J, Zhou ZW, Wang H, Paranal R, Li J, Capelletti M, Caffarra C, Li S, Lv Q, et al. (2018). KRAS Dimerization Impacts MEK Inhibitor Sensitivity and Oncogenic Activity of Mutant KRAS. Cell 172, 857–868 e815. - PubMed
    1. Benjamini Y, and Hochberg Y (1995). Controlling the False Discovery Rate: A Practical and Powerful Approach to Multiple Testing. Journal of the Royal Statistical Society Series B (Methodological) 57, 289–300.
    1. Bentley C, Jurinka SS, Kljavin NM, Vartanian S, Ramani SR, Gonzalez LC, Yu K, Modrusan Z, Du P, Bourgon R, et al. (2013). A requirement for wild-type Ras isoforms in mutant KRas-driven signalling and transformation. Biochem J 452, 313–320. - PubMed
    1. Bielski CM, Zehir A, Penson AV, Donoghue MTA, Chatila W, Armenia J, Chang MT, Schram AM, Jonsson P, Bandlamudi C, et al. (2018). Genome doubling shapes the evolution and prognosis of advanced cancers. Nat Genet 50, 1189–1195. - PMC - PubMed
    1. Bremner R, and Balmain A (1990). Genetic changes in skin tumor progression: correlation between presence of a mutant ras gene and loss of heterozygosity on mouse chromosome 7. Cell 61, 407–417. - PubMed

Publication types