. 2018 Dec 3;47(5):645-659.e6.
doi: 10.1016/j.devcel.2018.10.004. Epub 2018 Nov 1.

SETDB1 Links the Meiotic DNA Damage Response to Sex Chromosome Silencing in Mice

Affiliations

SETDB1 Links the Meiotic DNA Damage Response to Sex Chromosome Silencing in Mice

Takayuki Hirota et al. Dev Cell. .

Abstract

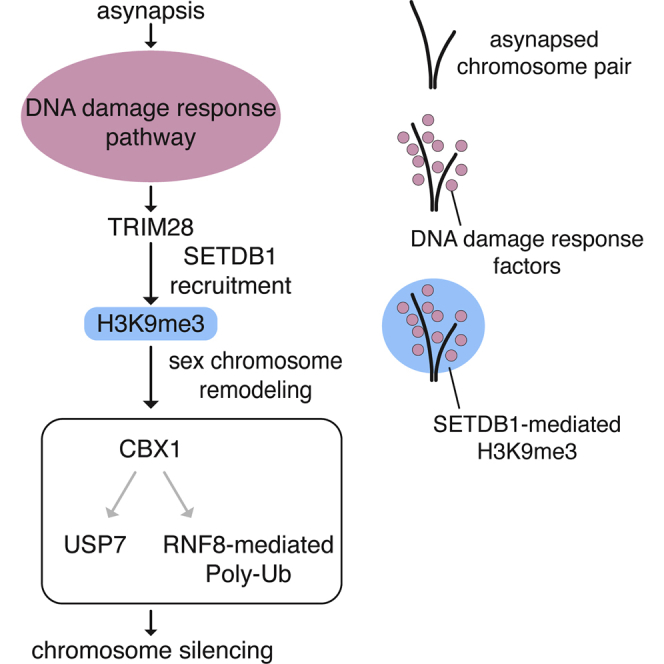
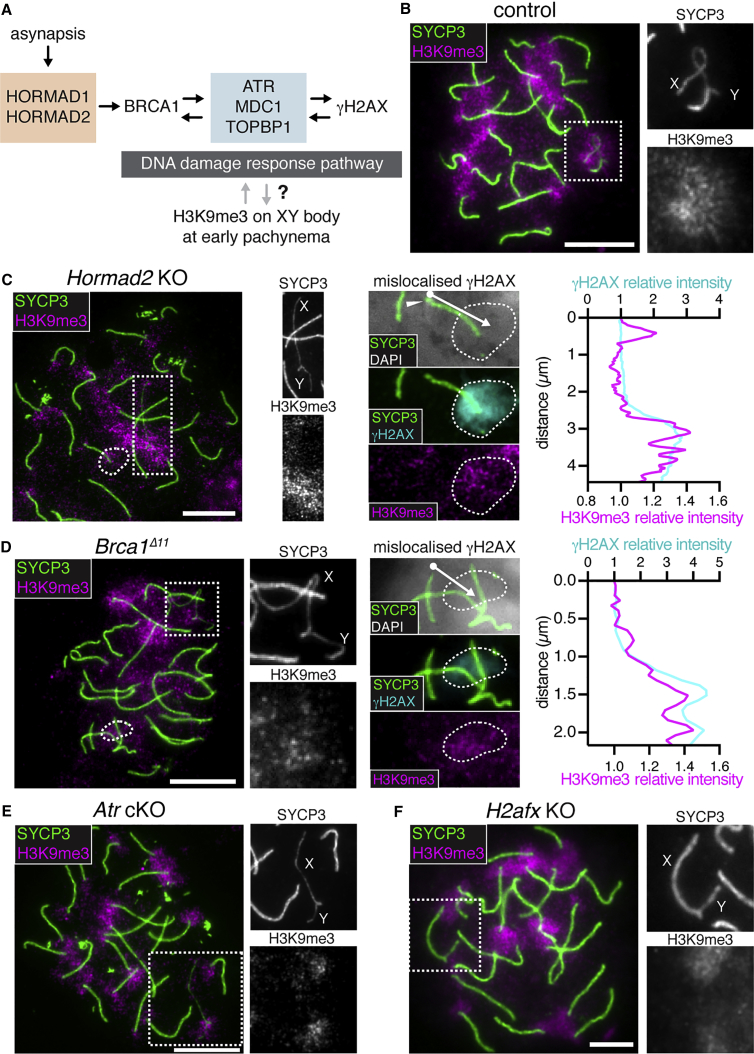
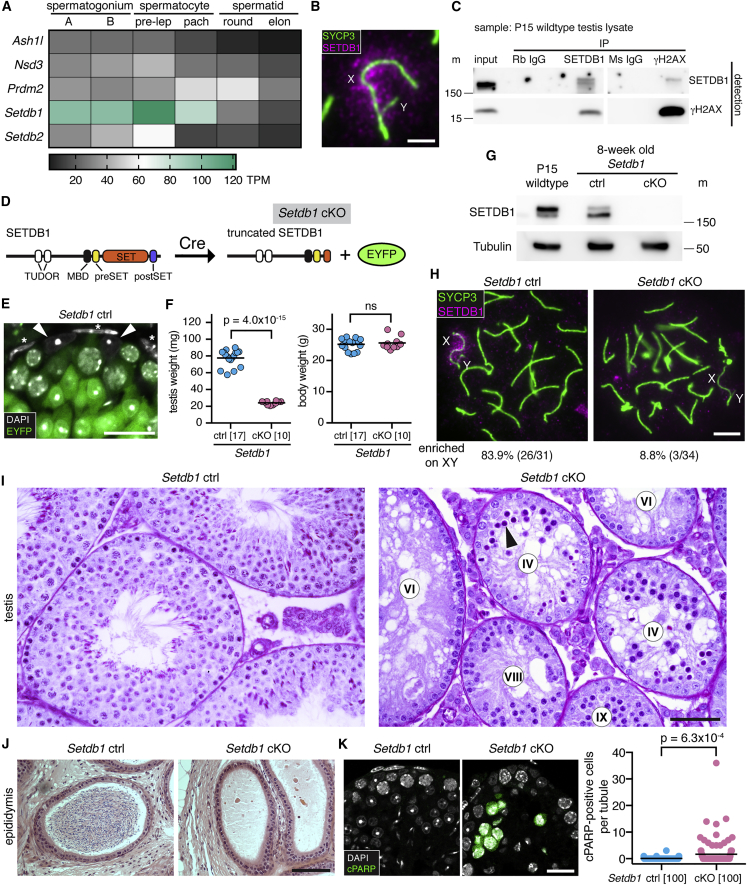
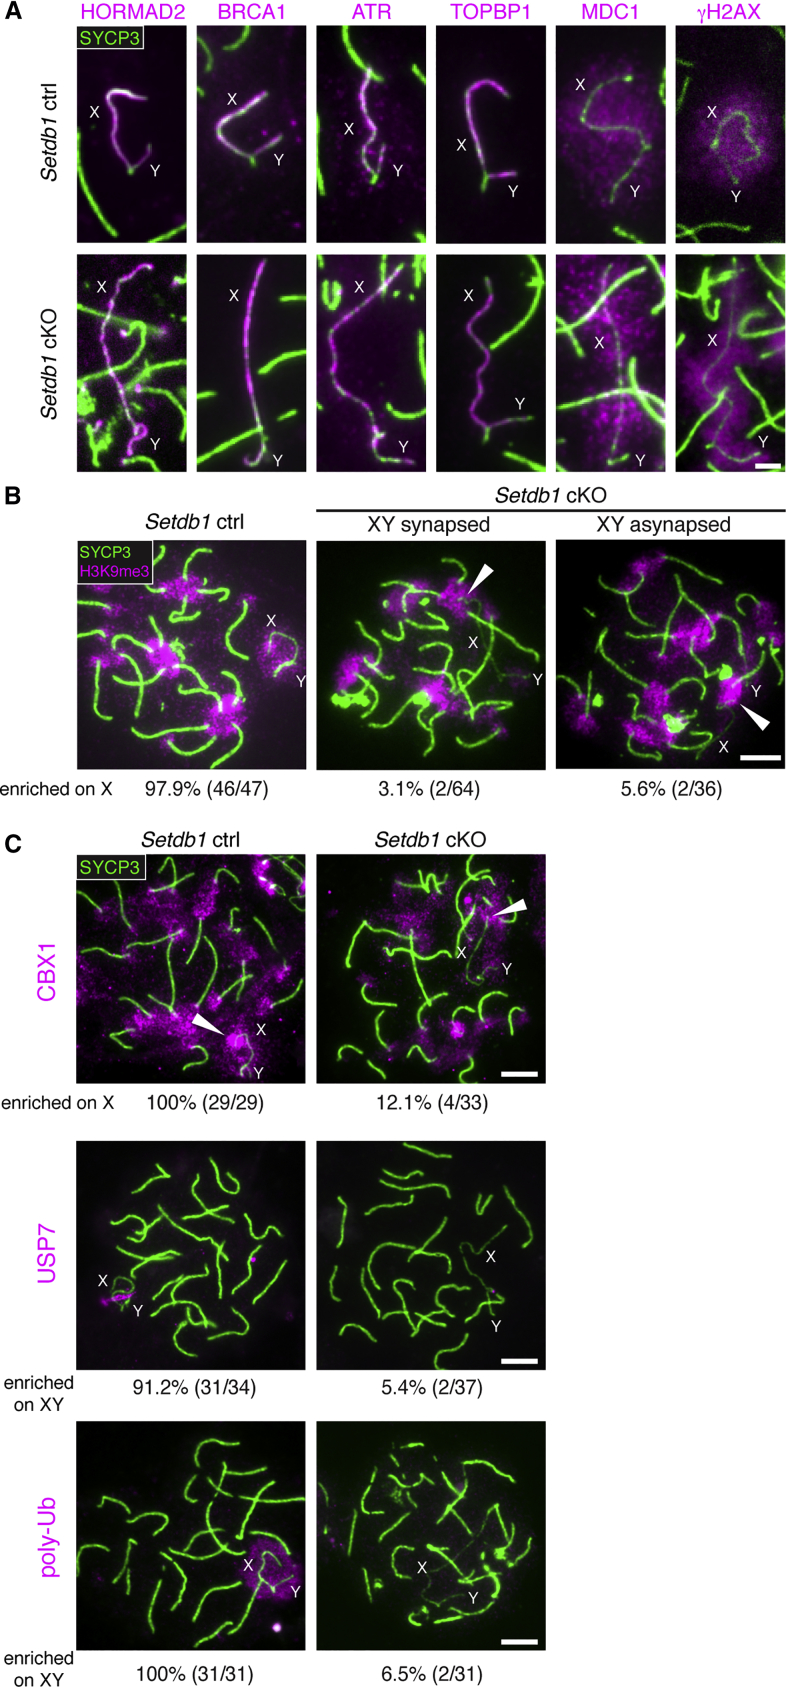
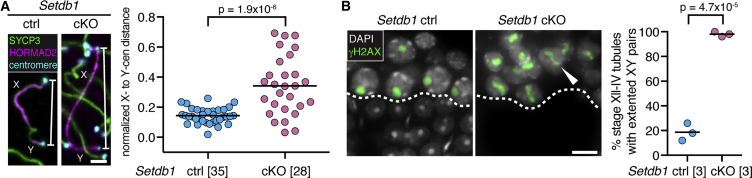
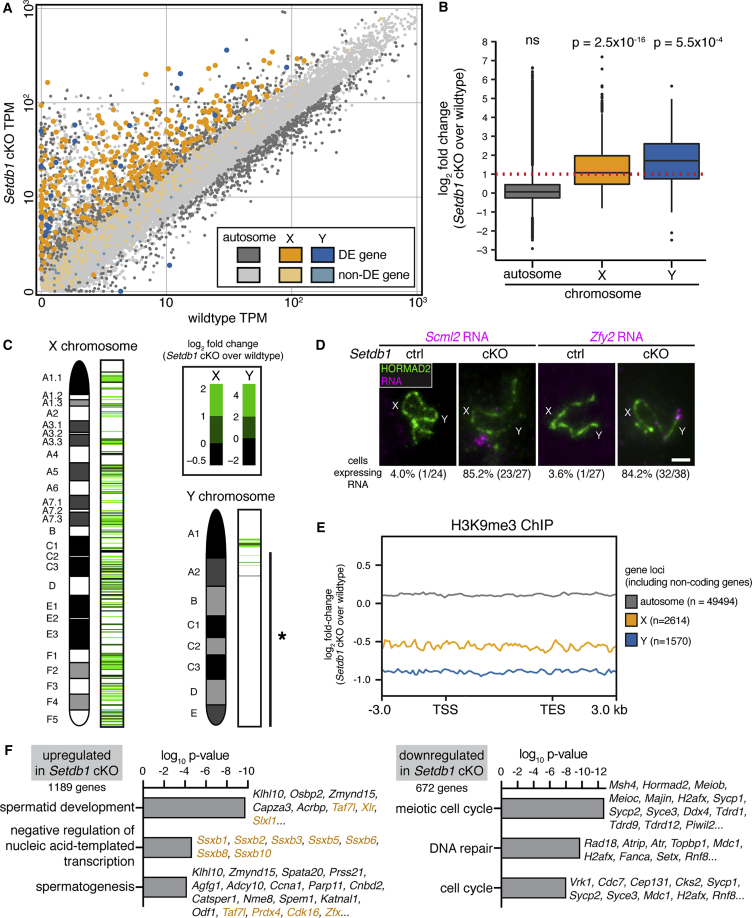
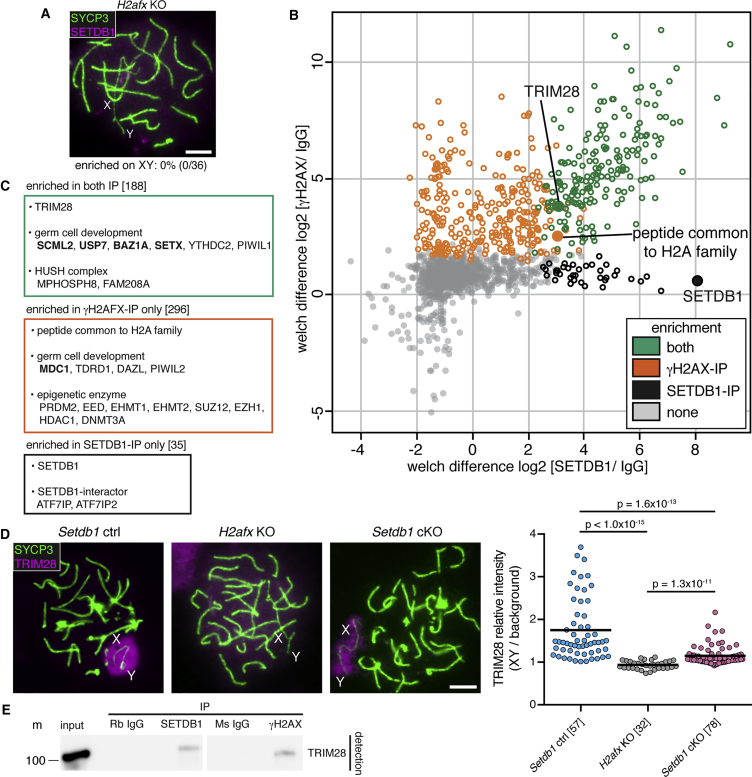
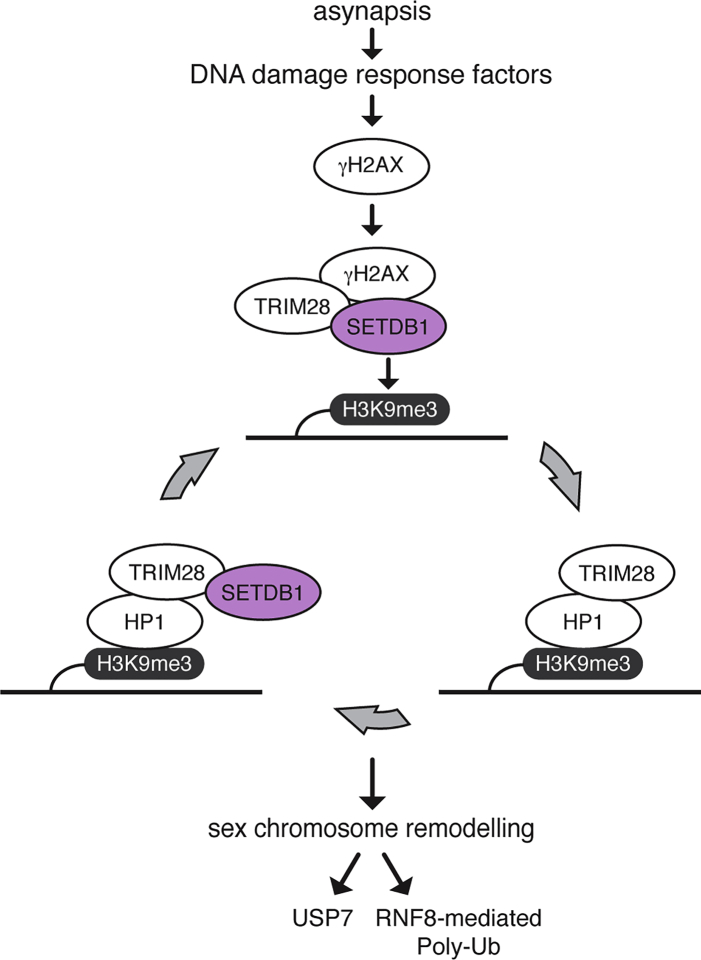
Meiotic synapsis and recombination ensure correct homologous segregation and genetic diversity. Asynapsed homologs are transcriptionally inactivated by meiotic silencing, which serves a surveillance function and in males drives meiotic sex chromosome inactivation. Silencing depends on the DNA damage response (DDR) network, but how DDR proteins engage repressive chromatin marks is unknown. We identify the histone H3-lysine-9 methyltransferase SETDB1 as the bridge linking the DDR to silencing in male mice. At the onset of silencing, X chromosome H3K9 trimethylation (H3K9me3) enrichment is downstream of DDR factors. Without Setdb1, the X chromosome accrues DDR proteins but not H3K9me3. Consequently, sex chromosome remodeling and silencing fail, causing germ cell apoptosis. Our data implicate TRIM28 in linking the DDR to SETDB1 and uncover additional factors with putative meiotic XY-silencing functions. Furthermore, we show that SETDB1 imposes timely expression of meiotic and post-meiotic genes. Setdb1 thus unites the DDR network, asynapsis, and meiotic chromosome silencing.

Keywords: DNA damage response; H3K9me3; MSCI; meiotic silencing; mouse; sex chromosomes.


Figures

None
Graphical abstract
Figure 1
Figure 1
DNA Damage Response Factors Direct H3K9me3 Acquisition on the X Chromosome (A) Schematic of the MSCI pathway. (B–F) Early pachytene spermatocytes from control (B, n = 38 cells), Hormad2 KO (C, n = 32 cells), Brca1Δ11 (D, n = 17 cells), Atr cKO (E, n = 20 cells), and H2afx KO (F, n = 34 cells) immunostained for SYCP3 (green) and H3K9me3 (magenta). Dashed rectangles highlight XY pair, which is magnified in right panels. Far right panels (C and D) show magnified images of mislocalized γH2AX (cyan, dashed circle) and plot profiles of relative fluorescence intensity of γH2AX (cyan) and H3K9me3 (magenta). Arrows show lines used for plot profile analysis. Arrowhead shows DAPI-dense pericentric heterochromatin. 8-week-old mice were used for analyses. Scale bars: 5 μm. See also Figure S1.
Figure 2
Figure 2
Setdb1 Deletion Causes Midpachytene Apoptosis (A) H3K9me3 MTase expression in male germ cells by RNA-seq. A: typeA; B: type B; pre-lep: pre-leptonema; pach: pachynema; elon: elongated; TPM: transcripts per million. (B) Setdb1 control XY bivalent immunostained for SYCP3 (green) and SETDB1 (magenta). See quantitation in (H). Scale bar: 2 μm. (C) Western blot of input and immunoprecipitated samples using P15 wild-type testis lysate treated with nuclease. Rb: rabbit; Ms: mouse; m: size marker. Expected size: 180 kDa (SETDB1), 17 kDa (γH2AX). (D) Schematic of SETDB1 domain structure before and after Cre recombination. Setdb1 cKO also expresses EYFP from Gt(ROSA)26Sor Cre reporter locus. (E) Testis section of Setdb1 control immunostained for EYFP (green, stained with GFP antibody). Note that EYFP is negative in Sertoli cells (arrowheads) and peritubular myoid cells (asterisks). Scale bar: 20 μm. (F) Testis and body weights in Setdb1 control and cKO mice. Number of mice analyzed in brackets. ns: not significant. p value calculated using unpaired t test. (G) Testis SETDB1 western blot of Setdb1 control and cKO. Tubulin was used as a loading control. 50 μg of protein per lane was loaded. m: size marker. Expected size: 180 kDa (SETDB1), 50 kDa (Tubulin). SETDB1 antibody used recognizes two SETDB1 bands, of which the upper band is considered to be ubiquitinated SETDB1 (Ishimoto et al., 2016). (H) Early pachytene Setdb1 controls and Setdb1 cKOs immunostained for SYCP3 (green) and SETDB1 (magenta). Percentages of cells positive for SETDB1 signals on XY are shown below panels. (I and J) Histology of Setdb1 control and cKO testes (I, periodic acid-Schiff staining) and epididymides (J, hematoxylin and eosin staining). Arrowhead: apoptotic pachytene cell. Number labels show tubule stages. Scale bars: 50 μm (I), 100 μm (J). (K) Testis sections of Setdb1 control and cKO immunostained for cleaved PARP (green). Chart shows number of cells positive for cleaved PARP per tubule. Number of tubules analyzed in brackets. p value calculated using unpaired t test. Scale bar: 20 μm. 8-week-old mice were used for analyses except for P15 sample in (C) and (G). See also Figure S2.
Figure 3
Figure 3
SETDB1 Is Required for Epigenetic Remodeling of the XY Pair (A) Early pachytene Setdb1 control and cKO XY bivalents immunostained for SYCP3 (green) and silencing factors (magenta; n ≥ 30 cells for each factor). Scale bar: 2 μm. (B) Early pachytene Setdb1 controls and cKOs immunostained for SYCP3 (green) and H3K9me3 (magenta). Arrowheads: H3K9me3 on pericentric heterochromatin of X. Percentages of cells positive for H3K9me3 signals on non-pericentric X are shown below panels. Scale bar: 5 μm. (C) Early (CBX1) and mid (USP7 and poly-Ub) pachytene Setdb1 controls and cKOs immunostained for SYCP3 (green) and indicated factors (magenta). Arrowheads: CBX1 on pericentric heterochromatin of X. Percentages of cells positive for signals on non-pericentric X (CBX1) or XY (USP7 and poly-Ub) are shown below panels. Scale bar: 5 μm. 8-week-old mice were used for analyses. See also Figures S3 and S4.
Figure 4
Figure 4
SETDB1 Is Required for Condensation of the XY Pair (A) Immunostaining and quantification of early pachytene X-Y centromere distance in Setdb1 controls and cKOs (SYCP3: green; HORMAD2: magenta; centromeres: cyan). Number of cells analyzed in brackets. p value calculated using Mann-Whitney test. Scale bar: 2 μm. (B) Immunostaining and quantification of XY condensation in Setdb1 control and cKO testis sections (γH2AX: green; DAPI: white). Dashed line: boundary between spermatocytes and spermatids. In Setdb1 cKOs, spermatids are absent as a result of stage lV block. Arrowhead: example of extended XY pair. Chart represents percentage of stage Xll–lV tubules with extended XY pairs (50 tubules per mouse analyzed; three mice per genotype). p value calculated using unpaired t test. Scale bar: 10 μm. 8-week-old mice were used for analyses.
Figure 5
Figure 5
Defective MSCI in Setdb1 cKO Pachytene Spermatocytes (A) Comparison of gene expression levels between wild-type ad Setdb1 cKO pachytene cells. DE: differentially expressed. DE genes: autosome (dark gray); X (dark orange); Y (dark blue). non-DE genes: autosome (light gray); X (light orange); Y (light blue). TPM: transcripts per million. (B) Boxplot represents gene expression log2-fold change of Setdb1 cKO relative to wild-type. Box: 25th/75th percentiles. Line on box: median. Whisker: 1.5 times the interquartile range from the 25th/75th percentiles. Red dashed line: 2-fold change. ns: not significant. p value calculated using Welch’s t test. (C) Heatmaps representing gene expression log2-fold change of Setdb1 cKO relative to wild-type across different chromosomal locations. Asterisk: long arm of the Y chromosome, which is occupied by multicopy genes (Ssty1, Ssty2, Sly, Asty). Note that the software used for these heatmaps excludes multi-mapped X and Y genes. (D) X-linked Scml2 and Y-linked Zfy2 RNA-FISH (magenta) of Setdb1 controls and cKOs immunostained for HORMAD2 (green). Percentages of cells positive for RNA signals are shown below panels. Scale bar: 2 μm. (E) H3K9me3 occupancy log2-fold change of Setdb1 cKO relative to wild-type. Gray: autosomal genes; orange: X genes; blue: Y genes. Analysis includes all coding and noncoding genes. TSS: transcription start site. TES: transcription end site. (F) The top three ontology terms enriched in upregulated and downregulated genes in Setdb1 cKO cells. Example genes are listed on the right. Orange: X-linked genes. See also Figures S5–S7 and Tables S1 and S2.
Figure 6
Figure 6
Genetic and Protein Interaction of SETDB1 with γH2AX and TRIM28 (A) Early pachytene H2afx KOs immunostained for SYCP3 (green) and SETDB1 (magenta). Percentages of cells positive for SETDB1 signals on XY are shown below panels. (B) IP-MS analysis to identify SETDB1- and γH2AX-interactors in testes. Axis values show LFQ intensity log2-fold change of SETDB1-IP (X axis) or γH2AX-IP (Y axis) relative to control immunoglobulin G (IgG)-IP. Green: enriched in both γH2AX- and SETDB1-IP. Orange: enriched only in γH2AX-IP. Black: enriched only in SETDB1-IP. Gray: non-enriched. Detection of H2AX is limited due to sequence similarity among H2A family proteins. (C) Examples of proteins enriched in γH2AX- and/or SETDB1-IP. Number of proteins enriched in brackets. Bold: known MSCI factors. (D) Early pachytene Setdb1 controls, H2afx KOs, and Setdb1 cKOs immunostained for SYCP3 (green) and TRIM28 (magenta). Chart shows relative intensity of TRIM28 on XY relative to non-XY region in nucleus. Number of cells analyzed in brackets. p value calculated using Mann-Whitney test. (E) Western blot of input and immunoprecipitated samples using P15 wild-type testis lysate treated with nuclease. Rb: rabbit; Ms: mouse; m: size marker. Expected TRIM28 size: 110 kDa. 8-week-old mice were used in (A) and (D); P15 mice were used in (B) and (E). Scale bars: 5 μm. See also Figure S7D and Table S4.
Figure 7
Figure 7
Model Explaining the Role of SETDB1 in MSCI Asynapsis sensors and DNA damage response factors are recruited to XY pair, resulting in γH2AX accumulation. γH2AX recruits TRIM28 and SETDB1, which mediates H3K9me3 acquisition. HP1 (CBX1, CBX3, CBX5)-TRIM28 complex binds to H3K9me3 and recruits more SETDB1, facilitating the repressive chromatin state. USP7 and RNF8-mediated poly-Ub pathways act downstream of H3K9me3 for further sex chromosome remodeling.

Similar articles

Cited by

References

    1. An J., Zhang X., Qin J., Wan Y., Hu Y., Liu T., Li J., Dong W., Du E., Pan C. The histone methyltransferase ESET is required for the survival of spermatogonial stem/progenitor cells in mice. Cell Death Dis. 2014;5:e1196. - PMC - PubMed
    1. Ayrapetov M.K., Gursoy-Yuzugullu O., Xu C., Xu Y., Price B.D. DNA double-strand breaks promote methylation of histone H3 on lysine 9 and transient formation of repressive chromatin. Proc. Natl. Acad. Sci. USA. 2014;111:9169–9174. - PMC - PubMed
    1. Baarends W.M., Hoogerbrugge J.W., Roest H.P., Ooms M., Vreeburg J., Hoeijmakers J.H., Grootegoed J.A. Histone ubiquitination and chromatin remodeling in mouse spermatogenesis. Dev. Biol. 1999;207:322–333. - PubMed
    1. Bannister A.J., Zegerman P., Partridge J.F., Miska E.A., Thomas J.O., Allshire R.C., Kouzarides T. Selective recognition of methylated lysine 9 on histone H3 by the HP1 chromo domain. Nature. 2001;410:120–124. - PubMed
    1. Bastos H., Lassalle B., Chicheportiche A., Riou L., Testart J., Allemand I., Fouchet P. Flow cytometric characterization of viable meiotic and postmeiotic cells by hoechst 33342 in mouse spermatogenesis. Cytometry A. 2005;65:40–49. - PubMed

Publication types

Substances