. 2018 Nov 20;115(10):1956-1965.
doi: 10.1016/j.bpj.2018.10.003. Epub 2018 Oct 10.

Effects of Passive Phospholipid Flip-Flop and Asymmetric External Fields on Bilayer Phase Equilibria

Affiliations

Effects of Passive Phospholipid Flip-Flop and Asymmetric External Fields on Bilayer Phase Equilibria

John J Williamson et al. Biophys J. .

Abstract

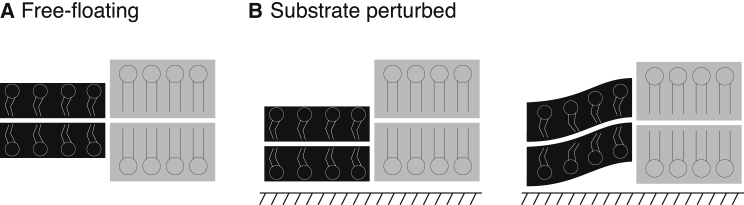
Compositional asymmetry between the leaflets of bilayer membranes modifies their phase behavior and is thought to influence other important features such as mechanical properties and protein activity. We address here how phase behavior is affected by passive phospholipid flip-flop, such that the compositional asymmetry is not fixed. We predict transitions from "pre-flip-flop" behavior to a restricted set of phase equilibria that can persist in the presence of passive flip-flop. Surprisingly, such states are not necessarily symmetric. We further account for external symmetry breaking, such as a preferential substrate interaction, and show how this can stabilize strongly asymmetric equilibrium states. Our theory explains several experimental observations of flip-flop-mediated changes in phase behavior and shows how domain formation and compositional asymmetry can be controlled in concert, by manipulating passive flip-flop rates and applying external fields.


Figures

Figure 1
Figure 1
(A) A landscape of free energy per lipid f(ϕt,ϕb)a2 (with a20.6nm2 a typical lipid area) in the space of top and bottom leaflet compositions. Compositions in the unstable (white) region phase separate into registered (R) and antiregistered (AR) phases lying in the spinodally stable corners (blue). The contour lines indicate where phospholipid chemical potentials of both leaflets are equal, μt=μb. (B) A pre-flip-flop partial phase diagram for times t<tf-f, obtained by drawing common tangent planes on f(ϕt,ϕb) (28). Equilibrium tie-lines (R-R, R-AR) and triangles (R-R-AR) are black, and metastable coexistences (AR-AR, AR-AR-R) are red. An exhaustive phase diagram including further regions of metastable coexistence may be found in (29). (C) A post-flip-flop phase diagram applicable at late times. The only allowed states are a single phase lying on the μt=μb contours (cf. (A)) inside the spinodally stable corners or a tie-line whose endpoints satisfy those criteria. For any other overall leaflet compositions, the bilayer must evolve via δϕb=δϕt to reach an allowed post-flip-flop state. Simulation trajectories for such flip-flop-mediated transitions (see Fig. 2) are shown here as dashed lines that evolve from the initial (a square in (B)) to the final overall composition (a square in (C)). (D) Projected free energy fproj.(ϕbl) (dotted line) along the μt=μb contour as a function of ϕbl(ϕt+ϕb)/2. Blue segments are spinodally stable. At ϕbl0.25 (asterisk), where the μt=μb contour (see (A)) splits into diagonal and oval parts, we take the oval path because the diagonal part is spinodally unstable and so irrelevant to phase equilibria. The post-flip-flop tie-lines from (C) are indicated as solid lines; the R-AR states (red) are doubly degenerate in this projection. (Color Online).
Figure 2
Figure 2
Simulation snapshots illustrating the flip-flop-mediated transitions, which are labeled in Fig. 1, B and C. The initial overall leaflet compositions in (A)–(C) are (ϕt,ϕb)=(0.2,0.6), (0.3,0.3), and (0.01,0.99), respectively, and further details of the model and parameters are given in Parameters and Simulation Method. Cartoons beneath each snapshot indicate the coexisting phases present.
Figure 3
Figure 3
(A and C) Free-energy landscapes for increasing values of the free-energy gain ζ per S lipid in the top leaflet. The landscape is tilted, and the μt=μb contour deformed compared to ζ=0 (Fig. 1A). (B) A post-flip-flop phase diagram following from (A), similarly to Fig. 1C. (D) A phase diagram following from (C). The two R-AR tie-lines involving US are no longer allowed, whereas those involving SU have replaced the R-R tie-line as the equilibrium coexistences. (Color Online).
Figure 4
Figure 4
Projected free energy fζproj.(ϕbl) for increasing strength of symmetry-breaking field ζ (cf. Fig. 1, B and D). We plot only the branch of the μt=μb contour passing through the SU phase, which is favored by ζ (cf. Fig. 3). The metastable (red) and equilibrium (black) tie-lines are plotted on each free-energy curve. A larger ζ stabilizes R-AR phase coexistence as equilibrium, instead of R-R. (Color Online).
Figure 5
Figure 5
Alternative phase diagram topologies (A and B) to those considered in the main text. For each, the pre-flip-fop phase diagram is shown, and the μt=μb contours overlaid (in gray) that pick out the allowed post-flip-flop tie-lines (cf. Fig. 1), for increasing external field ζ (arrow; cf. Fig. 3). On the right, for each strength of ζ, a free-energy landscape (cf. Fig. 3) is shown, along with an illustration of the projected free energy along μt=μb (cf. Fig. 1D). (A) Shown here are parameters as in Fig. 1, but with V=0.52kBT and a higher temperature T'=1.19T, thus effectively reducing all coupling strengths. There are now no AR free-energy minima and so no metastable AR-AR coexistence. Only the ϕt=ϕb diagonal satisfies μt=μb for ζ=0. For ζ=0.02kBT, ζ=0.2kBT (arrow), the μt=μb contour deforms, for ζ=0.2kBT picking out R-AR rather than R-R as allowed post-flip-flop tie-lines. As is evident in the corresponding projection of fproj., an R-R tie-line then cannot be drawn satisfying μt=μb. (B) Now AR minima are absent and, in addition, the four arms of R-AR coexistence regions become truncated (cf. (23)). The parameters are V=0.43kBT, J=0.75a2kBT, B=0.8a2kBT, Δ0=1a, and κ=3a2kBT. The external field is increased (arrow). For ζ=0.2kBT, the post-flip-flop state, if within the phase-separating range, is R-R. For ζ=0.4kBT, the post-flip-flop states comprise two R-AR tie-lines. For ζ=0.6kBT, the μt=μb contour lies entirely outside the any coexistence region, so only homogeneous post-flip-flop states are allowed. (Color Online).
Figure 6
Figure 6
Schematic illustration of a possible mechanism by which hydrophobic mismatches incur a higher penalty in bilayers on a substrate versus free floating. In (A), the equilibrium state, by symmetry, can be presumed to have the thickness mismatch distributed evenly as shown. If a substrate encourages one side of the bilayer to lie flat against it, as in (B), this may require additional deformation relative to the state shown in (A).

Similar articles

Cited by

References

    1. Marquardt D., Geier B., Pabst G. Asymmetric lipid membranes: towards more realistic model systems. Membranes (Basel) 2015;5:180–196. - PMC - PubMed
    1. Collins M.D., Keller S.L. Tuning lipid mixtures to induce or suppress domain formation across leaflets of unsupported asymmetric bilayers. Proc. Natl. Acad. Sci. USA. 2008;105:124–128. - PMC - PubMed
    1. Lin W.C., Blanchette C.D., Longo M.L. Lipid asymmetry in DLPC/DSPC-supported lipid bilayers: a combined AFM and fluorescence microscopy study. Biophys. J. 2006;90:228–237. - PMC - PubMed
    1. Lin Q., London E. Ordered raft domains induced by outer leaflet sphingomyelin in cholesterol-rich asymmetric vesicles. Biophys. J. 2015;108:2212–2222. - PMC - PubMed
    1. Marquardt D., Heberle F.A., Pabst G. 1H NMR shows slow phospholipid flip-flop in gel and fluid bilayers. Langmuir. 2017;33:3731–3741. - PMC - PubMed

Publication types

LinkOut - more resources