

doi: 10.1007/s10562-018-2506-1.
Epub 2018 Jul 31.
Heterogeneous Surfaces as Structure and Particle Size Libraries of Model Catalysts
Affiliations
- PMID: 30393447
- PMCID: PMC6191079
- DOI: 10.1007/s10562-018-2506-1
Item in Clipboard
Heterogeneous Surfaces as Structure and Particle Size Libraries of Model Catalysts
Catal Letters.
2018.
Abstract
Keywords: Heterogeneous catalysis; Hydrogen–oxygen reaction; Photoemission electron microscopy; Processes and reactions; Surface reaction kinetics.
Figures
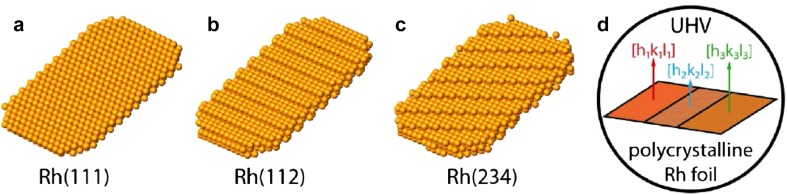
Physical, chemical and catalytic properties depend on the particular surface structure: a crystallographic structure of an fcc Rh(111) surface; b the same for a stepped Rh(112) surface; c the same for a “kinked” (234) surface; d the idea of a surface structure library

Polycrystalline Pd foil as surface structure library in catalysis: a optical microphotography of a 500 × 500 µm2 region; b EBSD image of the same region; the EBSD color code is shown in the inset; c the same region, imaged with PEEM, individual crystallographic orientations are marked. b and c Adapted from Ref. [10] https://pubs.acs.org/doi/abs/10.1021/jp312510d with permission from the American Chemical Society

Concept of local reaction kinetics by imaging. a Catalytic reaction on a polycrystalline foil is monitored in situ, simultaneously by PEEM and MS. Local data obtained from the intensity analysis of PEEM video-sequences for each individual (hkl)-domain are compared with global (averaged) MS data; b comparison of kinetic behaviour of individual “quasi-unsupported” and oxide-supported Pd particles. a Reproduced from Ref. [7] with permission from Springer, b reproduced from [38] with permission from Springer Nature

Catalytic ignition of CO oxidation on crystallographically differently oriented domains of a polycrystalline Pd foil: a) Ignition (red squares) and extinction curves (black triangles), as CO2 production rate, measured globally by MS, at cyclic variation of sample temperature (0.5 K s−1) at constant pCO = 5.8 × 10⁻⁶ mbar and pO2 = 1.3 × 10⁻⁵ mbar. The simultaneously recorded PEEM video-sequences illustrate the ignition process: (1) inactive, CO-covered surface; (2) ignition starts on the (110) domains; (3) ignition continues on the (100) domains; (4) oxygen-covered, active surface. b Spatially-resolved ignition/extinction measurements: local PEEM intensity of the individual (110), (100) and (111) domains during the same cyclic temperature variations as in (a). The vertical dashed line marks the reversal from heating to cooling. Reproduced from Ref. [9] with permission from John Wiley and Sons
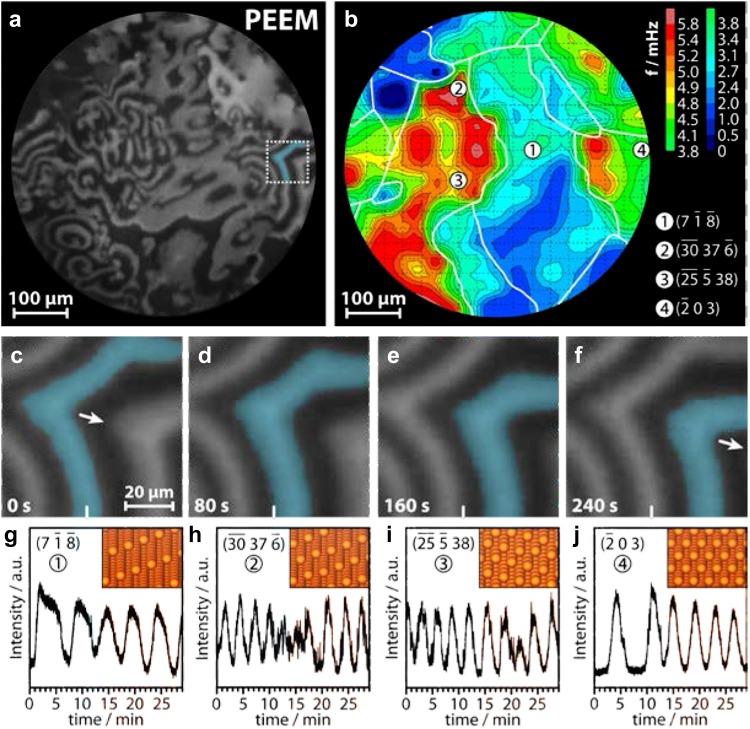
Isothermal kinetic oscillations of H2 oxidation on a polycrystalline Rh foil: a PEEM snapshot taken during H2 oxidation at constant pO2 = 1.1 × 10⁻⁶ mbar, pH2 = 8.4 × 10⁻⁷ mbar and T = 433 K; b “frequency landscape image” of the observed oscillations. Crystallographically different domains are marked by white lines. The round number symbols indicate selected crystallographic orientations; c–f propagation of a chemical wave in the section marked in (a); g–j time-dependent (oscillating) local PEEM intensities of selected regions. The positions of the corresponding regions of interests (diameter 1 µm) are marked by the number symbols in (b). The inserts in g–j show the ball models of the corresponding surface structures. The particular orientation of the individual domains (Miller indices) was determined by EBSD. Reproduced from Ref. [30] with permission from Springer Nature
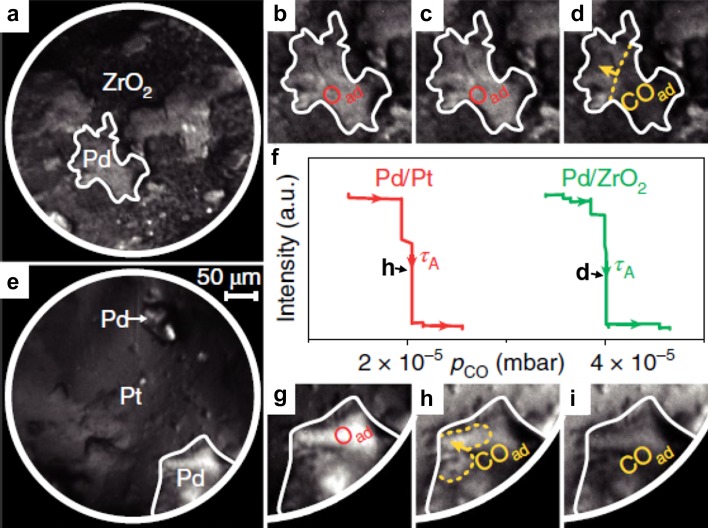
Long-range effect of the metal/oxide interface on CO oxidation on Pd: a PEEM field of view showing Pd agglomerates supported on ZrO2; b, c Pd agglomerate marked in (a) in the active steady state (oxygen covered surface) during increasing the CO pressure up to 4 × 10⁻⁵ mbar at constant T = 473 K and pO2 = 1.3 × 10⁻⁵ mbar; d isothermal kinetic transition (propagation of the CO front) to the inactive steady state at pCO = 4 × 10⁻⁵ mbar; e Pd agglomerates of similar size as in (a), but supported by Pt, f local PEEM intensity of the oxide supported Pd agglomerate marked in (a) (green curve) and of the Pt supported Pd marked in (e) (red curve); g Pd agglomerate marked in (e) being in the active state at the same T and pO2 as in (b–d) and at pCO < 2 × 10⁻⁵ mbar. h Kinetic transition to the inactive state (CO front propagates) at pCO=2 × 10⁻⁵ mbar; i Pd agglomerate in the inactive state (CO covered) at pCO > 2 × 10⁻⁵ mbar. Under these conditions, the oxide supported Pd agglomerate (c) still remains active (oxygen covered). Reproduced from [38] with permission from Springer Nature
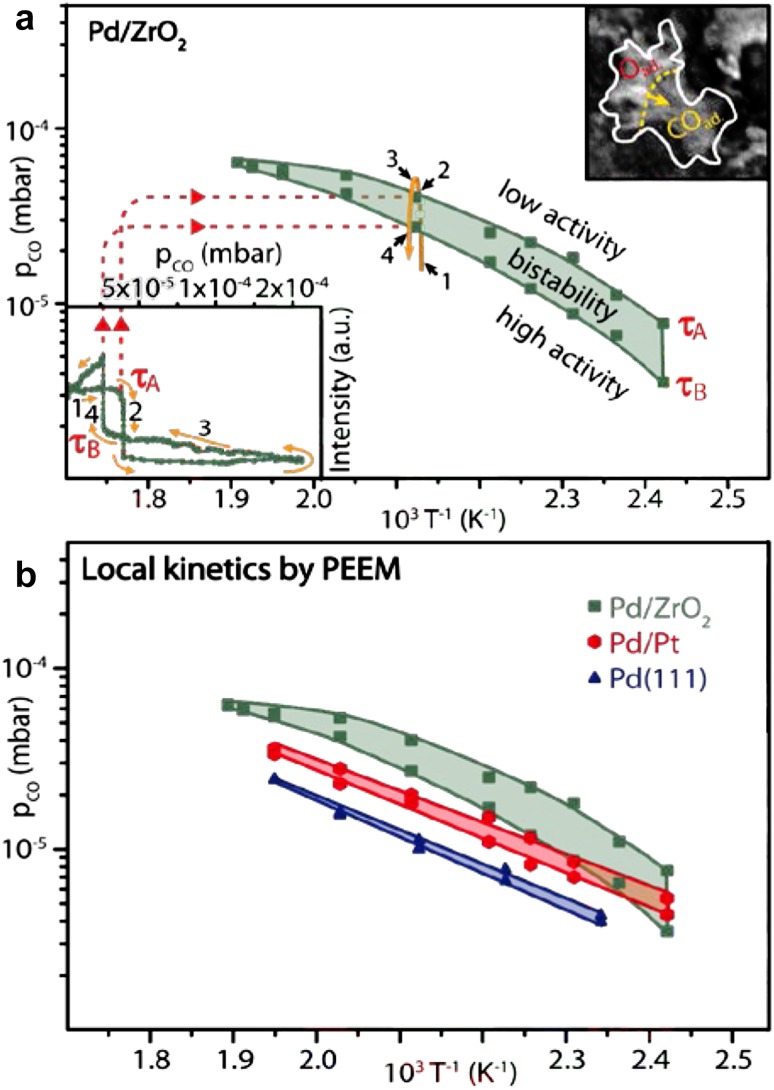
Local kinetic data for CO oxidation on Pd. a Kinetic phase diagram for CO oxidation on the individual Pd agglomerate supported by ZrO2 marked in Fig. 6a, measured by PEEM at pO2 = 1.3 × 10⁻⁵ mbar. The left-hand inset displays the PEEM intensity hysteresis during a cycle-wise variation of the CO pressure at 473 K. The right hand inset shows the chosen Pd agglomerate during the kinetic transition τB from the inactive to the active steady state; b catalytic behaviour of Pd supported on ZrO2, Pd supported on Pt and of a Pd(111) domain of a polycrystalline Pd foil. Reproduced from [38] with permission from Springer Nature
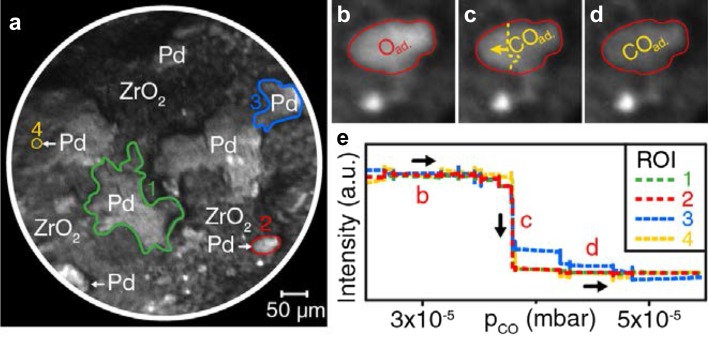
CO oxidation on ZrO2 supported Pd aggregates: a PEEM field of view with four Pd aggregates of significantly differing size marked by green, red, blue and yellow colour lines; b–d CO front propagation on the Pd agglomerate no. 2, e direct comparison of the normalized PEEM intensity reflecting the kinetic transition for the four Pd aggregates marked in (a). Reproduced from SI of Ref. [38] with permission from Springer Nature
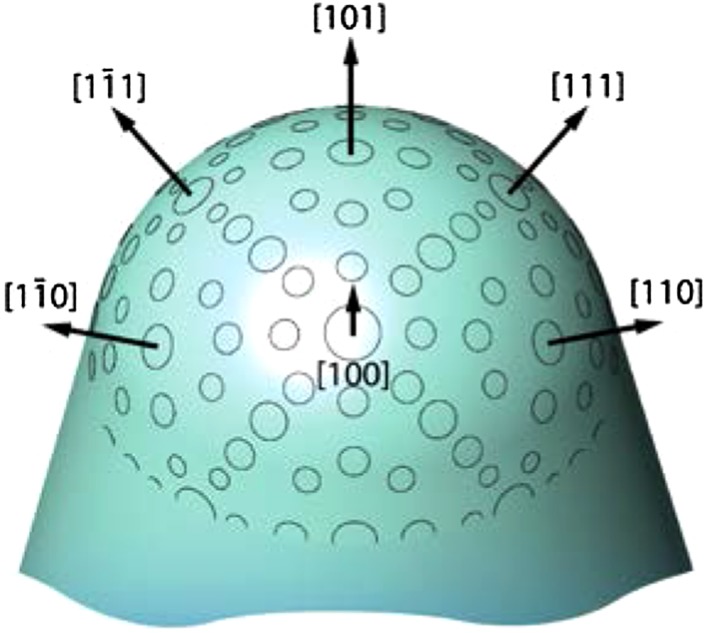
A schematics of a µm-sized curved crystal with large opining angle of a precious metal (e.g. Pt, Pd, Rh) exposing a wide range of differently oriented facets on its apex surface
References
-
- Ertl G, Knözinger H, Schüth F, Weitkamp J. Handbook of heterogeneous catalysis. Weinheim: VCH-Verlag; 2008.
-
- Somorjai GA. Surf Sci. 1994;299/300:849. doi: 10.1016/0039-6028(94)90702-1. - DOI
-
- Ertl G. Surf Sci. 1994;299/300:742. doi: 10.1016/0039-6028(94)90694-7. - DOI
-
- King DA. Surf Sci. 1994;299/300:678. doi: 10.1016/0039-6028(94)90689-0. - DOI
-
- Ertl G, Freund HJ. Phys Today. 1999;52:32. doi: 10.1063/1.882569. - DOI
LinkOut - more resources
Full Text Sources