Blocking PD1/PDL1 Interactions Together with MLN4924 Therapy is a Potential Strategy for Glioma Treatment
- PMID: 30393513
- PMCID: PMC6214201
- DOI: 10.4172/1948-5956.1000543
Blocking PD1/PDL1 Interactions Together with MLN4924 Therapy is a Potential Strategy for Glioma Treatment
Abstract
Objective: MLN4924, a pharmacological inhibitor of cullin neddylation, resulted in glioma cell apoptosis, deregulation of the S-phase of DNA synthesis and thus, offers great potential for the treatment of brain tumours. However, targeting the neddylation pathway with an MLN4924 treatment stabilized the hypoxia-inducible factor 1A (HIF1A), which is one of the main transcriptional enhancers of the immune checkpoint molecule PDL1 (programmid death ligand-1) in cancer cells. The influence of immune checkpoint molecules on glioma progression has recently been discovered; PDL1 overexpression in gliomas corresponds to a significant shortening of patient survival and a decrease of the anti-tumour immune response. We hypothesize that i) PDL1 is up-regulated in gliomas after treatment with MLN4924 and induces T-cell energy; ii) co-utilization of the PD1/PDL1 blockage with MLN4924 therapy may reduce T-cell energy and may engage MLN4924-induced tumour disruption with the immune response.
Methods: PDL1 expression and its immunosuppressive role in gliomas, glioma microenvironments, and after treatments with MLN4924 were assessed by utilizing methods of immunohistochemistry, molecular biology, and biochemistry.
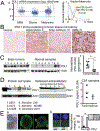
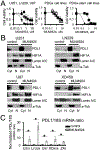
Results: We confirmed PDL1 overexpression in clinical brain tumour samples, PDGx and established glioma cell lines, extracellular media from glioma cells, and CSF (cerebrospinal fluid) samples from tumour-bearing mice. Our primary T-cell based assays verified that the up-regulation of PDL1 in tumour cells protects gliomas from T-cell treatment and reduces T-cell activation. We found that a pharmacological inhibitor of cullin neddylation, MLN4924, exhibited strong cytotoxicity towards PDGx and established glioma cell lines, in vitro, with an IC50's range from 0.2 to 3 uM. However, we observed a significant increase of HIF1A and PDL1 in mRNA and protein levels in all glioma cell lines after treatment with MLN4924. The MLN4924-dependent induction of PDL1 in gliomas resulted in T-cell energy, which was blocked by a blockage of the PD1/PDL1 interaction.
Conclusion: We conclude that i) PDL1 up-regulation in gliomas and the glioma microenvironment is an important chemotherapeutic target; ii) MLN4924 therapy, combined with a blockage of the PD1/PDL1 pathway, should be considered as a potential strategy for glioma treatment.
Keywords: Brain tumour; Cancer therapy; Gliomas; HIF; Immune checkpoint; MLN4924; PDL1.
Conflict of interest statement
Conflict of Interest The authors declare no conflict of interest.
Figures


Similar articles
-
A first-in-class inhibitor, MLN4924 (pevonedistat), induces cell-cycle arrest, senescence, and apoptosis in human renal cell carcinoma by suppressing UBE2M-dependent neddylation modification.Cancer Chemother Pharmacol. 2018 Jun;81(6):1083-1093. doi: 10.1007/s00280-018-3582-z. Epub 2018 Apr 17. Cancer Chemother Pharmacol. 2018. PMID: 29667067
-
Ubiquitin E3 ligase CRL4(CDT2/DCAF2) as a potential chemotherapeutic target for ovarian surface epithelial cancer.J Biol Chem. 2013 Oct 11;288(41):29680-91. doi: 10.1074/jbc.M113.495069. Epub 2013 Aug 30. J Biol Chem. 2013. PMID: 23995842 Free PMC article.
-
MRFAP1 plays a protective role in neddylation inhibitor MLN4924-mediated gastric cancer cell death.Eur Rev Med Pharmacol Sci. 2018 Dec;22(23):8273-8280. doi: 10.26355/eurrev_201812_16524. Eur Rev Med Pharmacol Sci. 2018. PMID: 30556867
-
Resistance Mechanisms of Anti-PD1/PDL1 Therapy in Solid Tumors.Front Cell Dev Biol. 2020 Jul 21;8:672. doi: 10.3389/fcell.2020.00672. eCollection 2020. Front Cell Dev Biol. 2020. PMID: 32793604 Free PMC article. Review.
-
PD-1/PD-L1 Checkpoint Inhibitors in Tumor Immunotherapy.Front Pharmacol. 2021 Sep 1;12:731798. doi: 10.3389/fphar.2021.731798. eCollection 2021. Front Pharmacol. 2021. PMID: 34539412 Free PMC article. Review.
Cited by
-
Mathematical model of tumor immune microenvironment with application to the combined therapy targeting the PD-1/PD-L1 pathway and IL-10 cytokine antibody.Theory Biosci. 2025 Feb;144(1):19-43. doi: 10.1007/s12064-024-00428-1. Epub 2024 Nov 26. Theory Biosci. 2025. PMID: 39586899
-
Validation of NEDD8-conjugating enzyme UBC12 as a new therapeutic target in lung cancer.EBioMedicine. 2019 Jul;45:81-91. doi: 10.1016/j.ebiom.2019.06.005. Epub 2019 Jun 14. EBioMedicine. 2019. PMID: 31208947 Free PMC article.
-
The Double-Edged Effects of MLN4924: Rethinking Anti-Cancer Drugs Targeting the Neddylation Pathway.Biomolecules. 2024 Jun 21;14(7):738. doi: 10.3390/biom14070738. Biomolecules. 2024. PMID: 39062453 Free PMC article. Review.
-
Targeting cullin neddylation for cancer and fibrotic diseases.Theranostics. 2023 Sep 4;13(14):5017-5056. doi: 10.7150/thno.78876. eCollection 2023. Theranostics. 2023. PMID: 37771770 Free PMC article. Review.
-
Targeting the HuR Oncogenic Role with a New Class of Cytoplasmic Dimerization Inhibitors.Cancer Res. 2021 Apr 15;81(8):2220-2233. doi: 10.1158/0008-5472.CAN-20-2858. Epub 2021 Feb 18. Cancer Res. 2021. PMID: 33602784 Free PMC article.
References
-
- Cheng S, Zheng J, Zhu J, Xie C, Zhang X, et al. (2015) PD-L1 gene polymorphism and high level of plasma soluble Pd-L1 protein may be associated with non-small cell lung cancer. Int J Biol Markers 30: 364–368. - PubMed
-
- Finkelmeier F, Canli Ö, Tal A, Pleli T, Trojan J, et al. (2016) High levels of the soluble programmed death-ligand (sPD-L1) identify hepatocellular carcinoma patients with a poor prognosis. Eur J Cancer 59: 152–159. - PubMed
-
- Rossille D, Gressier M, Damotte D, Maucort-Boulch D, Pangault C, et al. (2014) High level of soluble programmed cell death ligand 1 in blood impacts overall survival in aggressive diffuse large B-Cell lymphoma: Results from a French multicenter clinical trial. Leukemia 28: 2367–2375. - PubMed
Grants and funding
LinkOut - more resources
Full Text Sources
Research Materials
