. 2018 Oct 15:10:ecurrents.outbreaks.3cc277d133e2d6078912800748dbb492.
doi: 10.1371/currents.outbreaks.3cc277d133e2d6078912800748dbb492.

Real Time Forecasting of Measles Using Generation-dependent Mathematical Model in Japan, 2018

Affiliations

Real Time Forecasting of Measles Using Generation-dependent Mathematical Model in Japan, 2018

Andrei R Akhmetzhanov et al. PLoS Curr. .

Abstract

Background: Japan experienced a multi-generation outbreak of measles from March to May, 2018. The present study aimed to capture the transmission dynamics of measles by employing a simple mathematical model, and also forecast the future incidence of cases.

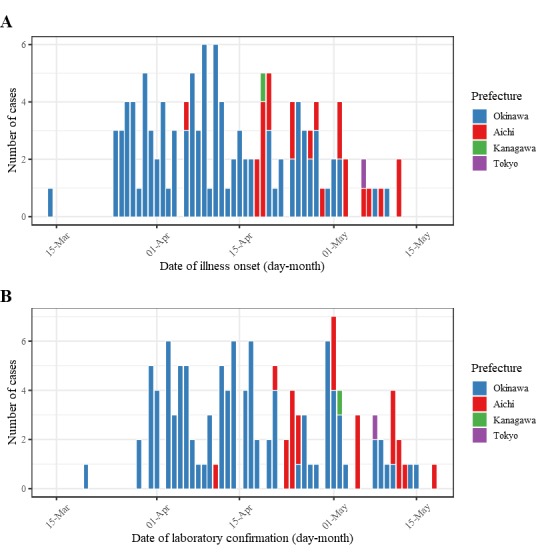
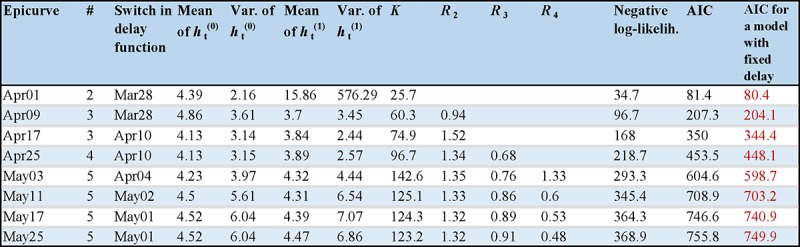
Methods: Epidemiological data that consist of the date of illness onset and the date of laboratory confirmation were analysed. A functional model that captures the generation-dependent growth patterns of cases was employed, while accounting for the time delay from illness onset to diagnosis.

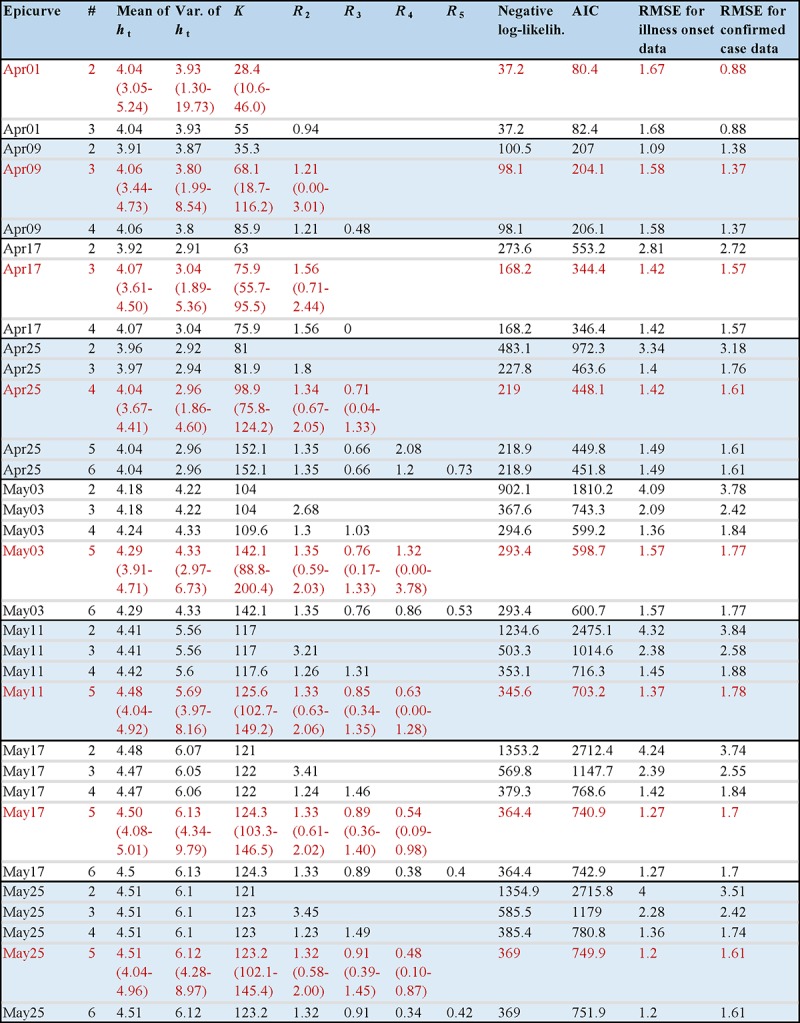
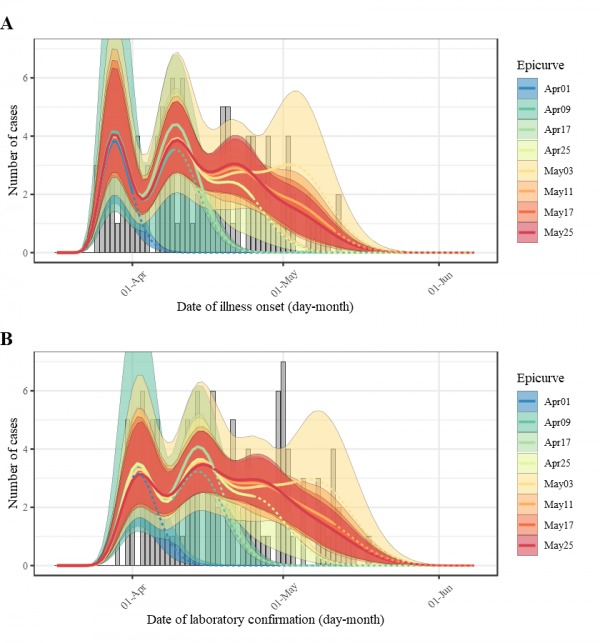
Results: As long as the number of generations is correctly captured, the model yielded a valid forecast of measles cases, explicitly addressing the reporting delay. Except for the first generation, the effective reproduction number was estimated by generation, assisting evaluation of public health control programs.

Conclusions: The variance of the generation time is relatively limited compared with the mean for measles, and thus, the proposed model was able to identify the generation-dependent dynamics accurately during the early phase of the epidemic. Model comparison indicated the most likely number of generations, allowing us to assess how effective public health interventions would successfully prevent the secondary transmission.

Keywords: Forecasting; Measles.


Figures

Date of illness onset and laboratory confirmation of reported measles
                        cases in Japan, March-May, 2018.
Date of illness onset and laboratory confirmation of reported measles cases in Japan, March-May, 2018.
(A) Date of illness onset of measles cases reported in Okinawa, Aichi, Kanagawa prefectures, and Tokyo Metropolis, Japan. Illness onset was unknown for 6 cases notified in Okinawa prefecture, thus, was assumed to be 5 days before laboratory confirmation. (B) Date of laboratory confirmation of measles cases reported in Okinawa, Aichi, Kanagawa prefectures, and Tokyo Metropolis.
Estimated parameters values and model comparison by the epidemic date of
                        forecasting.
Estimated parameters values and model comparison by the epidemic date of forecasting.
"#" denotes the assumed number of generations in the model. ht is the probability mass function from the time of illness onset to laboratory confirmation. Rm is the reproduction number of (m + 1)-th generation. AIC is Akaike information criterion. RMSE is the root-mean-square error. K is the estimated total number of symptomatic cases in Japan. Selected models with minimal AIC are shown in red. 95% confidence intervals (CIs) for each model parameter are shown in brackets.
Real time forecasting result of measles in Japan, 2018.
Performance of forecasting for each epicurve (legend) is compared to the number of reported cases in the latest update (bar chart in grey) by date of illness onset of measles cases (A) and date of laboratory confirmation of measles cases (B). Dashed lines denote the forecasting part for each snapshot of the epicurve.
Estimated parameter values and model comparison for a simple case of
                        time-varied distribution of the delay h.
Estimated parameter values and model comparison for a simple case of time-varied distribution of the delay h.
For any epicurve only the cases with minimal AIC values over a set of varied number of generations are shown. The switch in delay function indicates the optimal switching time, i.e., the calendar time on which the distribution is considered to have changed. The mean and variance of the delay distribution function before the switching day are indicated by the variable ht(0), after the switching day by the variable ht(1). The AIC values for a model with fixed distribution of the delay are shown in the last column, while the minimal AIC values are additionally indicated in red.

Similar articles

Cited by

References

    1. Nishiura H, Mizumoto K, Asai Y (2017) Assessing the transmission dynamics of measles in Japan, 2016. Epidemics 20: 67-72 10.1016/j.epidem.2017.03.005 - DOI - PubMed
    1. Inaida S, Matsuno S, Kobune F (2017) Measles elimination and immunisation: national surveillance trends in Japan, 2008-2015. Epidemiology & Infection 145(11): 2374-81 10.1017/S0950268817001248 - DOI - PMC - PubMed
    1. Kinoshita R, Nishiura H (2017) Assessing age-dependent susceptibility to measles in Japan. Vaccine 35(25): 3309-17 10.1016/j.vaccine.2017.05.011 - DOI - PubMed
    1. Okabe, N (2007). Epidemiological situation of measles in Japan and measures for its control. Uirusu 57(2): 171-9 (in Japanese) 10.2222/jsv.57.171 - DOI - PubMed
    1. Darussalam B (2015) Cambodia, Japan verified as achieving measles elimination. Manila: World Health Organization Regional Office for the Western Pacific.