. 2018 Aug 23;7(11):e1500107.
doi: 10.1080/2162402X.2018.1500107. eCollection 2018.

Adipose PD-L1 Modulates PD-1/PD-L1 Checkpoint Blockade Immunotherapy Efficacy in Breast Cancer

Affiliations

Adipose PD-L1 Modulates PD-1/PD-L1 Checkpoint Blockade Immunotherapy Efficacy in Breast Cancer

Bogang Wu et al. Oncoimmunology. .

Abstract

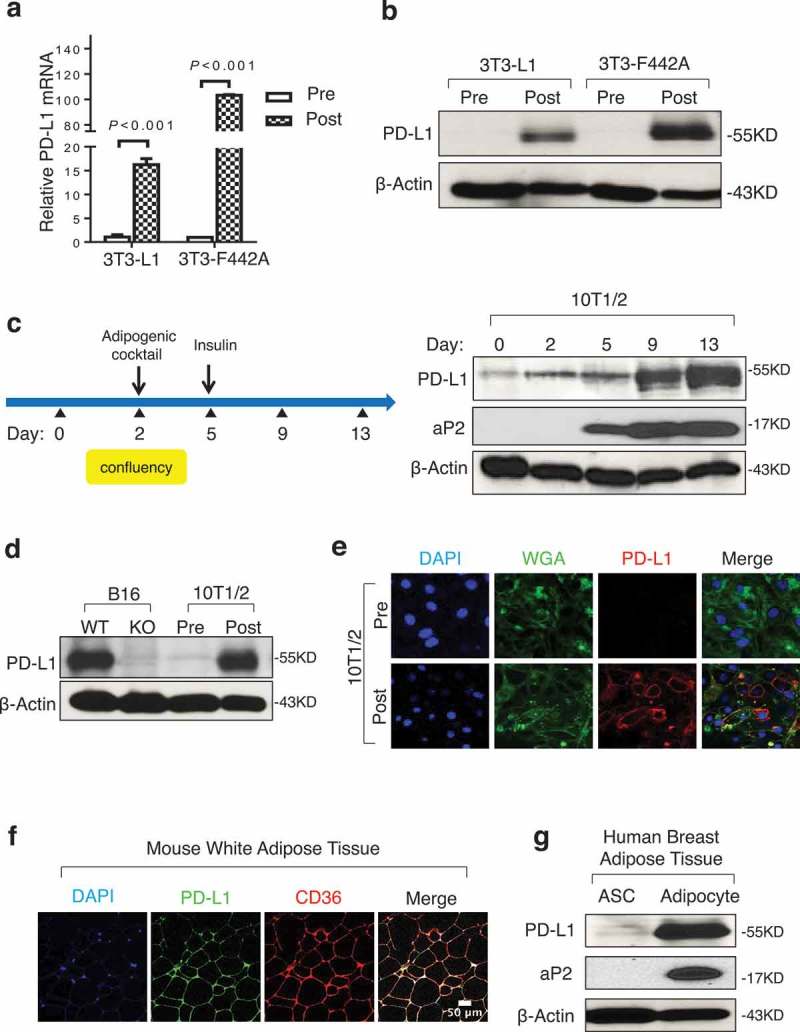
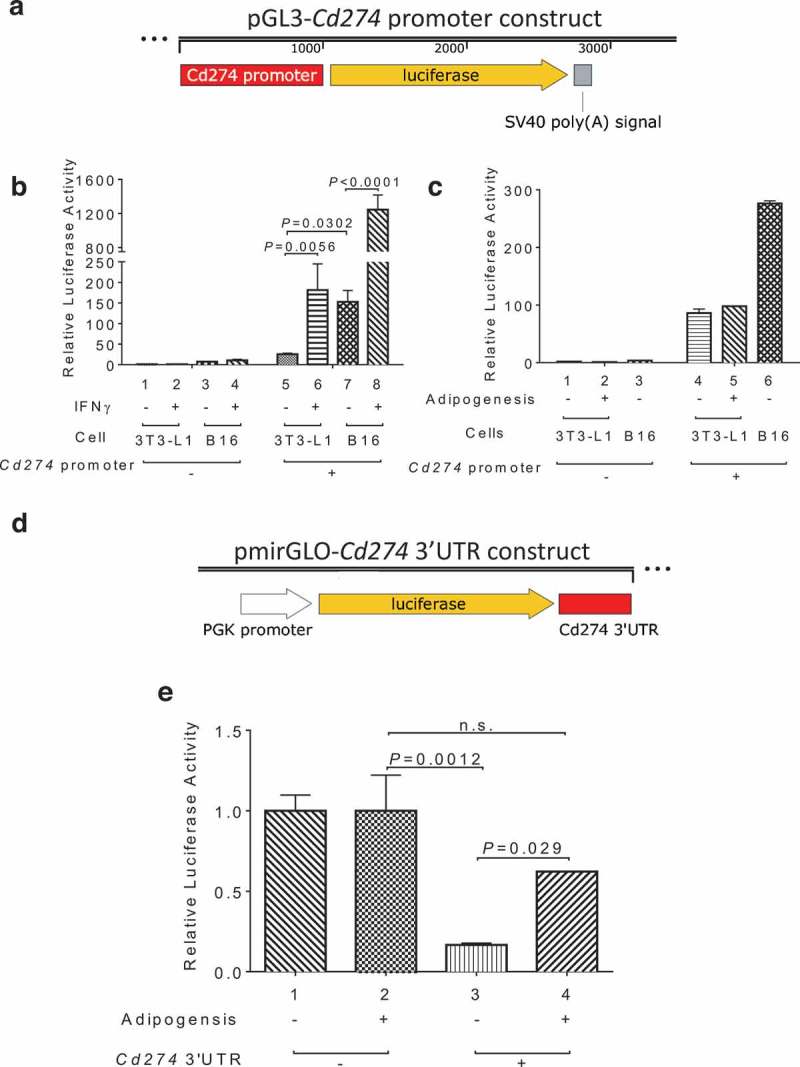
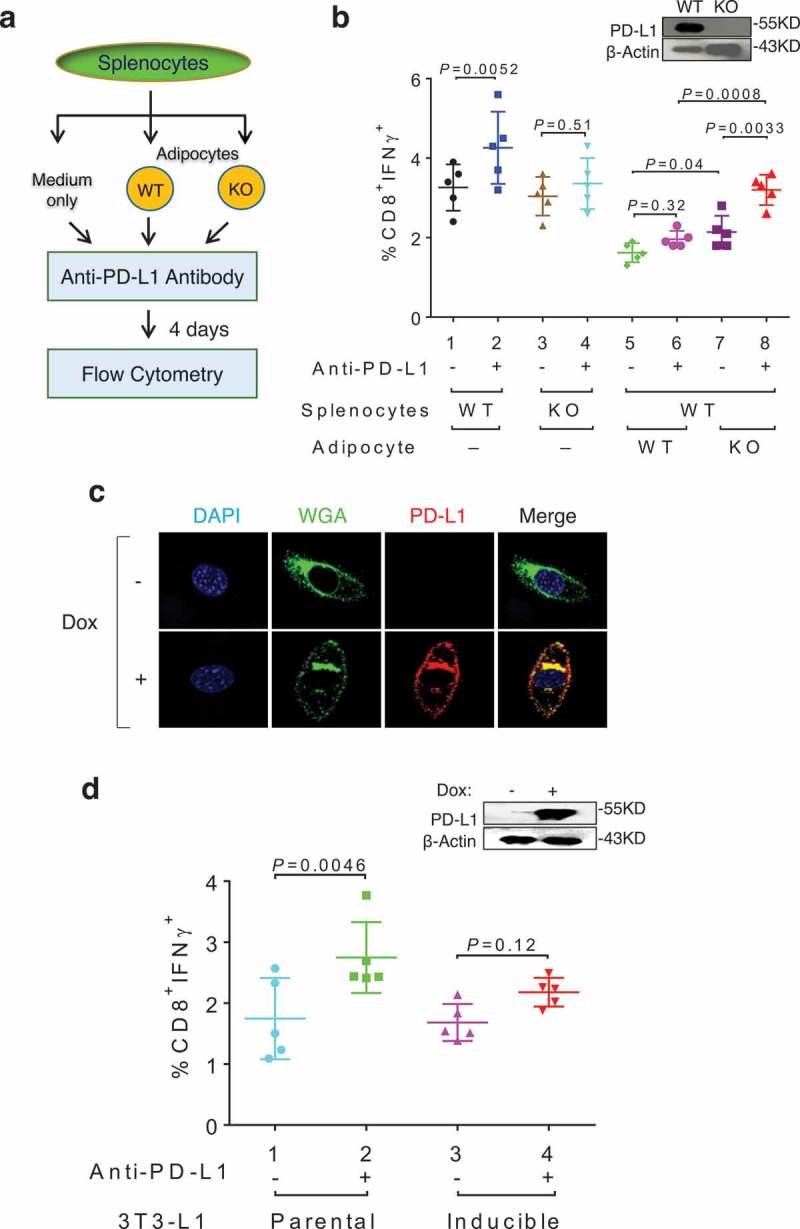
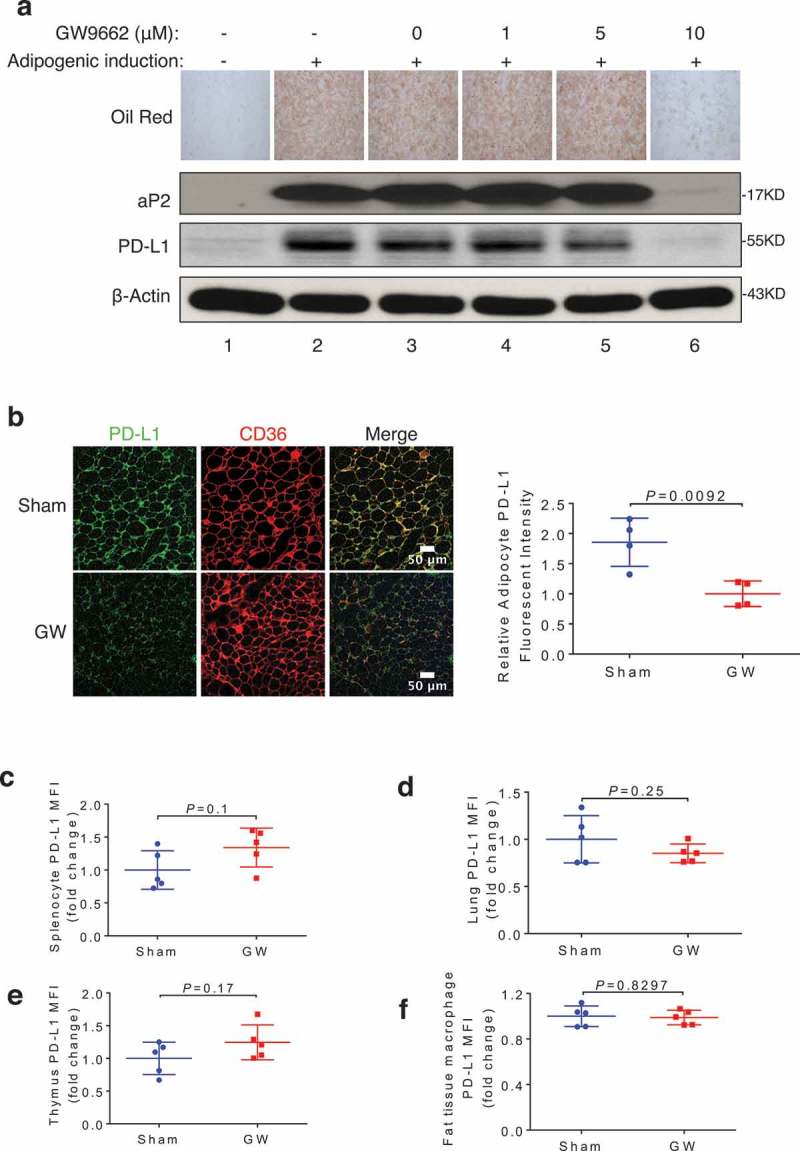
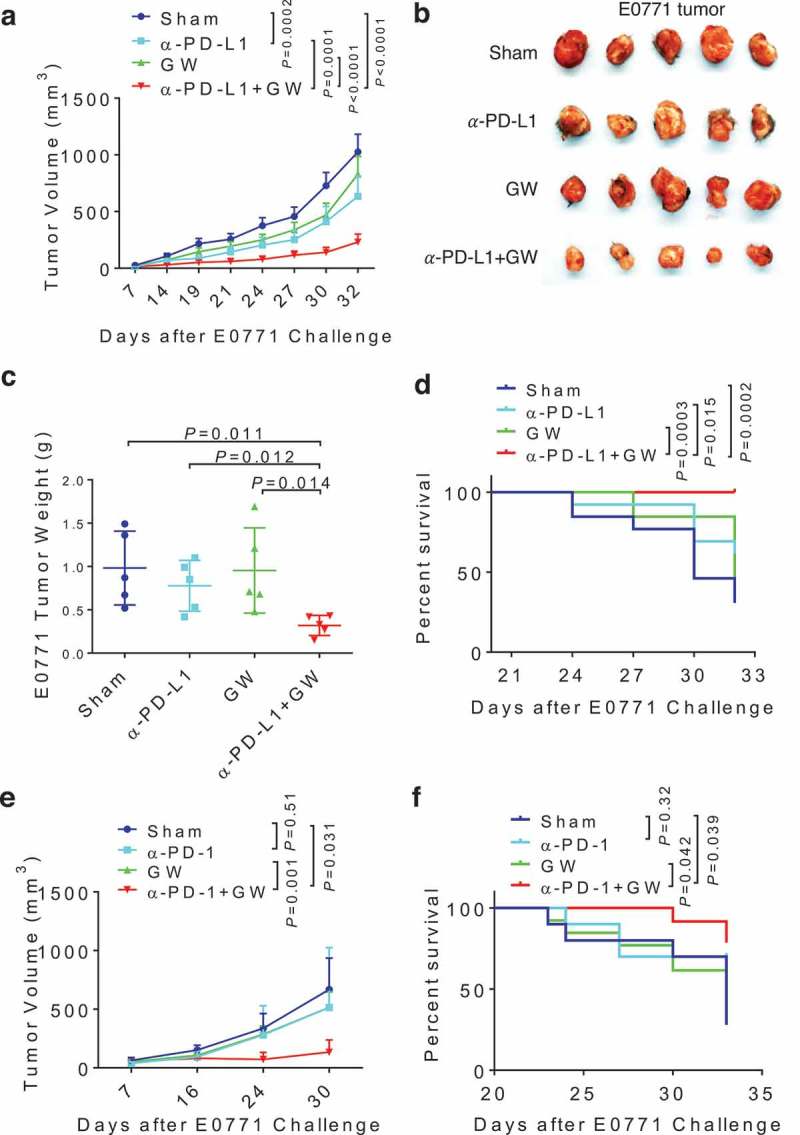
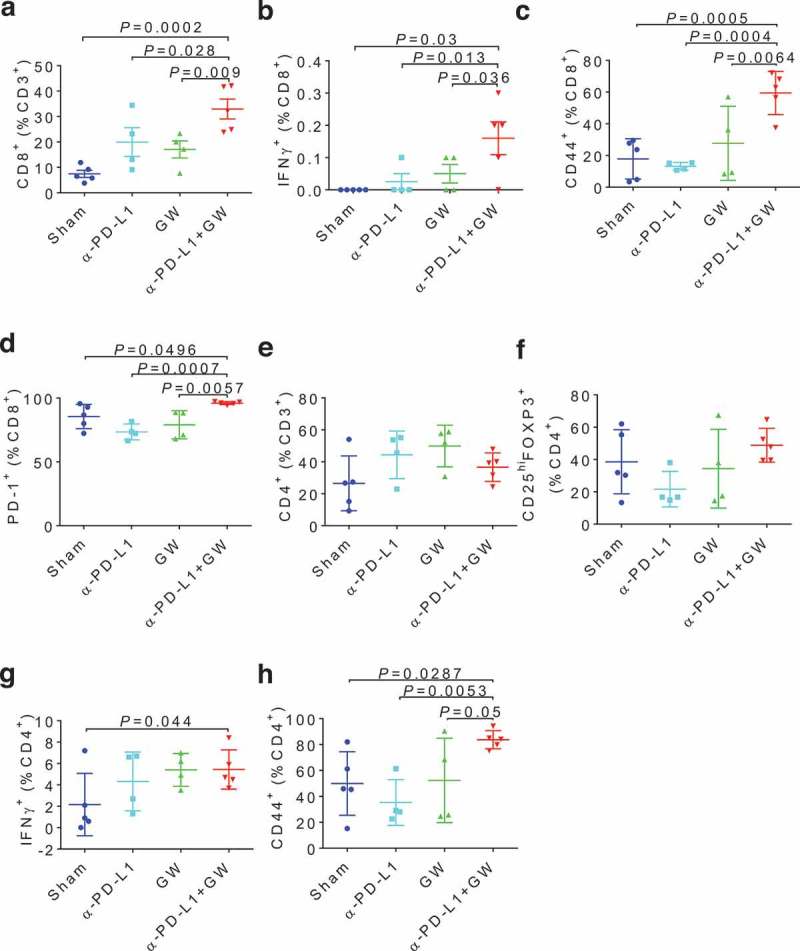
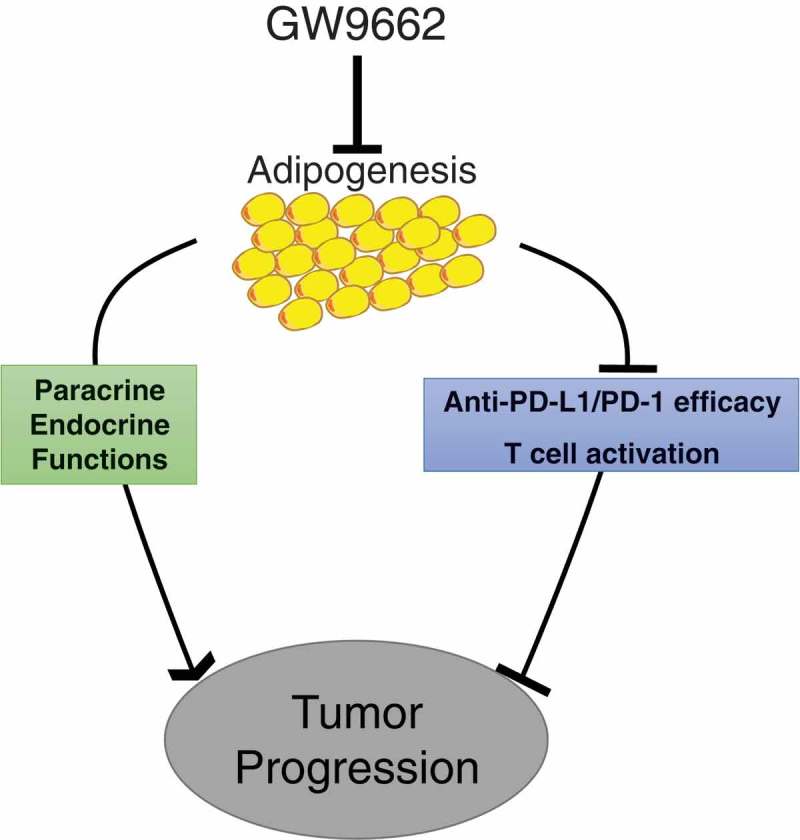
Programmed death-ligand 1 (PD-L1) and its receptor programmed cell death protein 1 (PD-1) modulate antitumor immunity and are major targets of checkpoint blockade immunotherapy. However, clinical trials of anti-PD-L1 and anti-PD-1 antibodies in breast cancer demonstrate only modest efficacy. Furthermore, specific PD-L1 contributions in various tissue and cell compartments to antitumor immunity remain incompletely elucidated. Here we show that PD-L1 expression is markedly elevated in mature adipocytes versus preadipocytes. Adipocyte PD-L1 prevents anti-PD-L1 antibody from activating important antitumor functions of CD8+ T cells in vitro. Adipocyte PD-L1 ablation obliterates, whereas forced preadipocyte PD-L1 expression confers, these inhibitory effects. Pharmacologic inhibition of adipogenesis selectively reduces PD-L1 expression in mouse adipose tissue and enhances the antitumor efficacy of anti-PD-L1 or anti-PD-1 antibodies in syngeneic mammary tumor models. Our findings provide a previously unappreciated approach to bolster anticancer immunotherapy efficacy and suggest a mechanism for the role of adipose tissue in breast cancer progression.

Keywords: Breast cancer; PD-1; PD-L1; PPARgamma antagonist; adipocyte; combination therapy; immune checkpoint; immunotherapy; inflammation and cancer; new targets.


Figures

Figure 1.
Figure 1.
Adipocytes express high levels of PD-L1. (a) PD-L1 mRNA by PCR in 3T3-L1 and 3T3-F442A pre- and post-adipogenesis. (b) PD-L1 protein in cells by WB before and after adipogenesis. (c) Diagram for in vitro adipogenesis (left) and PD-L1 protein expression at different stages of adipogenesis in 10T1/2 (right). aP2 is an adipogenic marker and β-actin is the loading control. (d) Comparison of PD-L1 protein by WB in 10T1/2 pre/post adipogensis and PD-L1 WT/KO B16 melanoma cells. (e) Representative immunofluorescence images of PD-L1 (red), plasma membrane marker wheat germ agglutinin (WGA, green) and nuclear marker DAPI (blue) in pre- and post-adipogenic 10T1/2 cells. (f) Immunostaining of PD-L1 and CD36 using WAT from C57BL/6 mice. (g) WB of PD-L1 and aP2 proteins in adipose stromal cells (ASC) and adipocytes from human breast tissue. One representative result from three donor samples are shown here. β-Actin is used as the loading control. Values represent mean ± SD.
Figure 2.
Figure 2.
3’ UTR-mediated control of PD-L1 expression during adipogenesis. (a) Diagram of the pGL3-Cd274/Pd-l1 promoter reporter construct. (b) IFNγ stimulation of Cd274 promoter-driven luciferase in B16 and 3T3-L1 cells. (c) Cd274 promoter-driven luciferase reporter activity before and after adipogenesis. (d) Diagram of the pmirGLO-CD274 3’UTR reporter construct. (e) Cd274 3’UTR luciferase reporter activity before and after adipogenesis.
Figure 3.
Figure 3.
Adipose PD-L1 attenuates anti-PD-L1 antibody effect in vitro. (a) Flow chart of the coculture assay. (b) Percentage of IFNγ+ T cells in CD8+ cells following co-culturing of total splenocytes, anti-PD-L1 antibody, and adipocytes. (c) Immunofluorescent staining of PD-L1 (red), WGA (green) and DAPI (Blue) in doxycycline (Dox, 1μg/ml) treated PD-L1-inducible 3T3-L1 cells. (d) Percentage of IFNγ+ T cells in CD8+ cells following co-culturing of total splenocytes, anti-PD-L1 antibody, and preadipocytes. Dox was included in all co-culture wells throughout the experiment. Induced ectopic PD-L1 in 3T3-L1 derivative cells is shown in the inlet. Data expressed as mean ± SD.
Figure 4.
Figure 4.
PPARγ antagonist GW9662 represses adipose PD-L1 expression. (a) Oil Red O staining and Western blotting of aP2, PD-L1, and β-actin in 3T3-L1 during adipogenesis, with or without GW9662 treatment. (b) Representative PD-L1 immunofluorescent staining of subcutaneous WAT from DMSO- and GW9662-treated mice (left). Fold change (normalized to vehicle-treated group) of fluorescence intensity of PD-L1 is shown on the right. (c-f) Fold changes of mean fluorescence intensity (MFI) from specific cells types isolated from either sham (vehicle) or GW9662-treated mice are shown for splenocytes (c), lung cells (d), thymus cells (e), fat tissue macrophages (CD45+ CD3-CD11b+ F4/80+) (f). Values represent mean ± SD. N = 5 per group.
Figure 5.
Figure 5.
GW9662 boosts anti-PD-L1/PD-1 antibody efficacy in vivo. (a-d) Tumor study with treatment of GW9662 and anti-PD-L1. E0771 mammary tumor growth curve (a), representative tumor image (b) and tumor weight (c) upon harvest. Survival curve is shown in (d). Treatments are as follow. Sham: vehicle + anti-IgG (n = 13), vehicle + anti-PD-L1 (n = 13), GW + anti-IgG (n = 13) and anti-PD-L1 + GW (n = 13). (e-f) Tumor study with treatment of GW9662 and anti-PD-1. E0771 mammary tumor growth (e) and survival (f). Sham: vehicle + anti-IgG (n = 4), vehicle + anti-PD-1 (n = 4), GW + anti-IgG (n = 5) and anti-PD-1 + GW (n = 4). Data are mean± SEM. P values for the tumor growth curve in (a) indicate the statistics for the last measurement time point. P values for the survival analysis in (d) test the null hypothesis that the indicated two survival curves are identical.
Figure 6.
Figure 6.
GW9662 boosts anti-tumor immunity in E0771 TILs. Immunophenotyping of various tumor infiltrating lymphocytes (TILs) after treatments: (a) Total CD8+ cells, and in the CD8+ gate: (b) IFNγ+, (c) CD44+, (d) PD-1+, (e) CD4+ in CD3+, and in CD4+ gate: (f) CD25+FOXP3+, (g) IFNγ+, (h) CD44+, Sham: vehicle + anti-IgG (n = 5); α–PD-L1: vehicle + anti-PD-L1 (n = 4); GW: GW9662 + anti-IgG (n = 4); α–PD-L1 + GW: anti-PD-L1 + GW9662 (n = 5). Data are mean ± SD.
Figure 7.
Figure 7.
Model for effects of adipogenesis on antitumor immunity.

References

    1. Sharma P, Allison JP.. The future of immune checkpoint therapy. Science. 2015;348:56–61. doi: 10.1126/science.aaa8172. - DOI - PubMed
    1. Freeman GJ, Long AJ, Iwai Y, Bourque K, Chernova T, Nishimura H, Fitz LJ, Malenkovich N, Okazaki T, Byrne MC. Engagement of the PD-1 immunoinhibitory receptor by a novel B7 family member leads to negative regulation of lymphocyte activation. J Exp Med. 2000;192:1027–1034. - PMC - PubMed
    1. Dong H, Strome SE, Salomao DR, Tamura H, Hirano F, Flies DB, Roche PC, Lu J, Zhu G, Tamada K. Tumor-associated B7-H1 promotes T-cell apoptosis: a potential mechanism of immune evasion. Nat Med. 2002;8:793. doi: 10.1038/nm730. - DOI - PubMed
    1. Baumeister SH, Freeman GJ, Dranoff G, Sharpe AH. Coinhibitory pathways in immunotherapy for cancer. Annu Rev Immunol. 2016;34:539–573. doi: 10.1146/annurev-immunol-032414-112049. - DOI - PubMed
    1. Lau J, Cheung J, Navarro A, Lianoglou S, Haley B, Totpal K, Sanders L, Koeppen H, Caplazi P, McBride J, et al Tumour and host cell PD-L1 is required to mediate suppression of anti-tumour immunity in mice. Nat Commun. 2017;8:14572. doi: 10.1038/ncomms14572. - DOI - PMC - PubMed

Publication types