. 2018;10(3):48.
doi: 10.1007/s40820-018-0202-8. Epub 2018 Apr 23.

Highly Sensitive MoS2-Indocyanine Green Hybrid for Photoacoustic Imaging of Orthotopic Brain Glioma at Deep Site

Affiliations

Highly Sensitive MoS2-Indocyanine Green Hybrid for Photoacoustic Imaging of Orthotopic Brain Glioma at Deep Site

Chengbo Liu et al. Nanomicro Lett. 2018.

Abstract

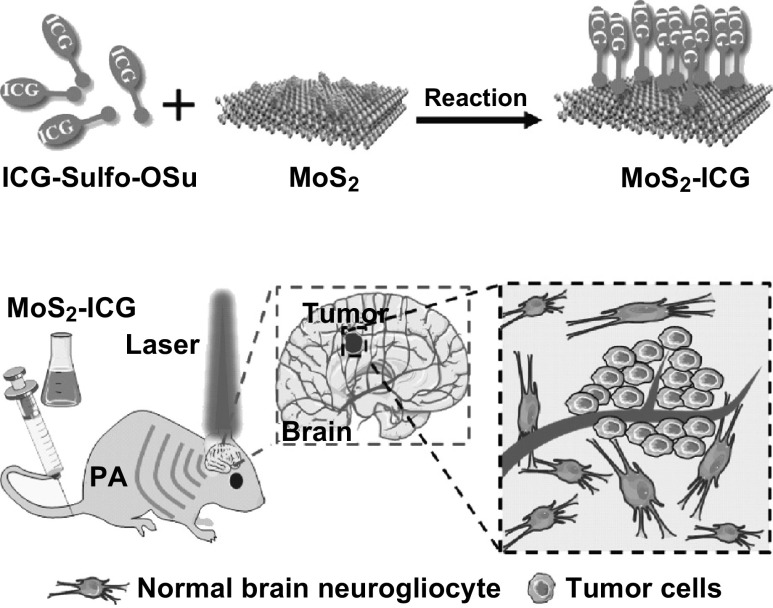
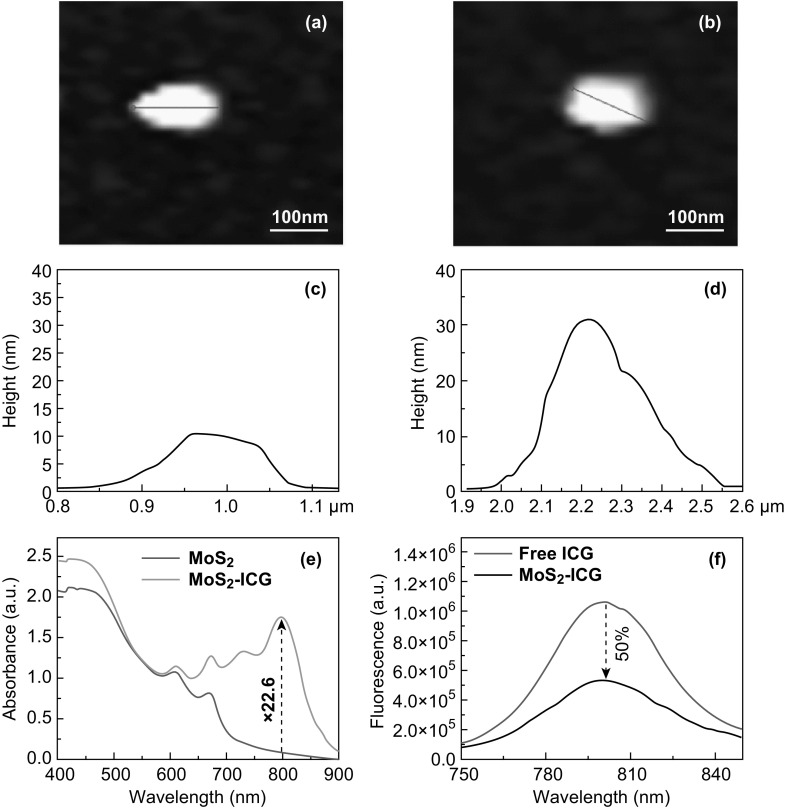
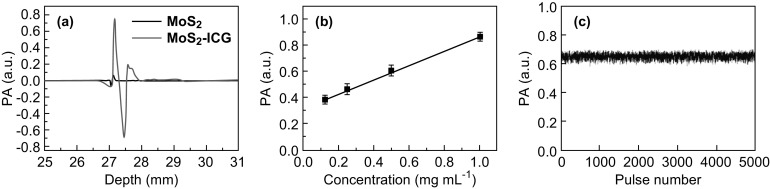
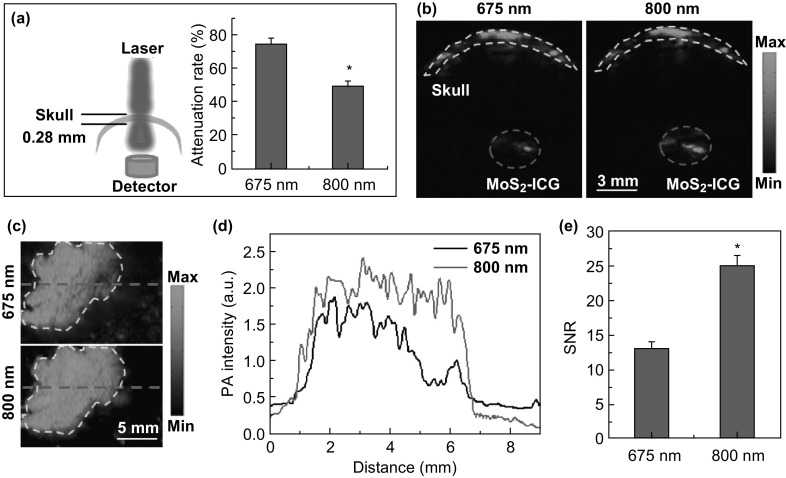
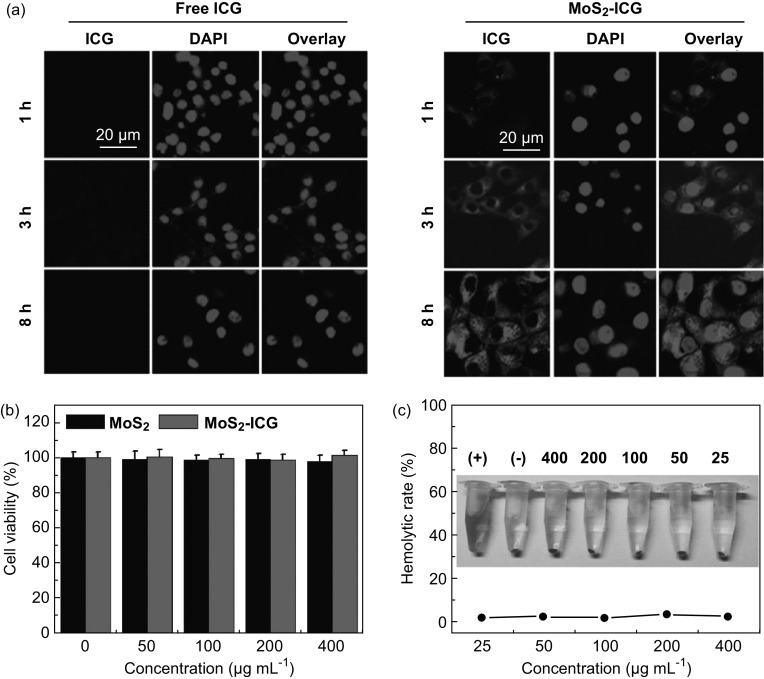
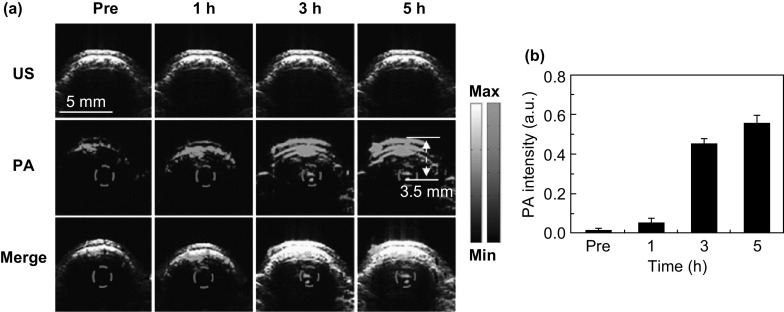
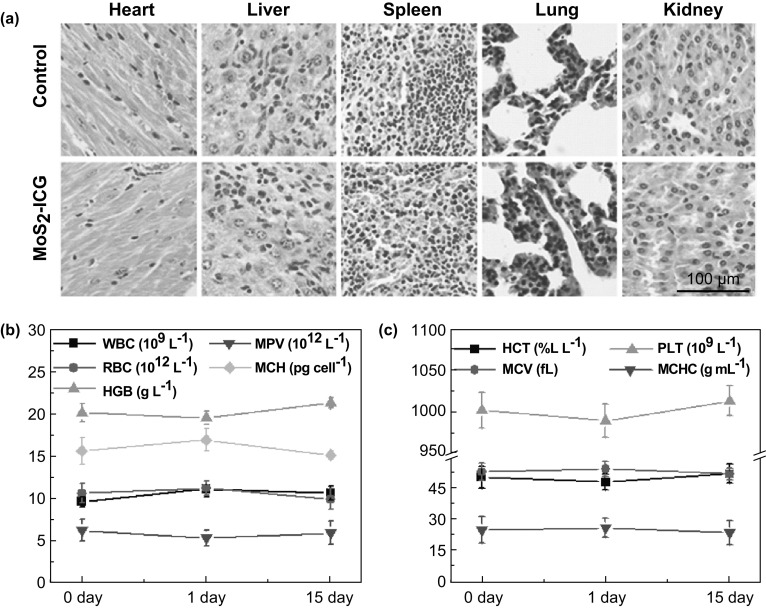
Photoacoustic technology in combination with molecular imaging is a highly effective method for accurately diagnosing brain glioma. For glioma detection at a deeper site, contrast agents with higher photoacoustic imaging sensitivity are needed. Herein, we report a MoS2-ICG hybrid with indocyanine green (ICG) conjugated to the surface of MoS2 nanosheets. The hybrid significantly enhanced photoacoustic imaging sensitivity compared to MoS2 nanosheets. This conjugation results in remarkably high optical absorbance across a broad near-infrared spectrum, redshifting of the ICG absorption peak and photothermal/photoacoustic conversion efficiency enhancement of ICG. A tumor mass of 3.5 mm beneath the mouse scalp was clearly visualized by using MoS2-ICG as a contrast agent for the in vivo photoacoustic imaging of orthotopic glioma, which is nearly twofold deeper than the tumors imaged in our previous report using MoS2 nanosheet. Thus, combined with its good stability and high biocompatibility, the MoS2-ICG hybrid developed in this study has a great potential for high-efficiency tumor molecular imaging in translational medicine.

Keywords: MoS2–ICG hybrid; Molecular imaging; Orthotopic brain glioma; Photoacoustic imaging.


Figures

Scheme 1
Scheme 1
Schematic of MoS2–ICG hybrid synthesis and its application in photoacoustic (PA) imaging of orthotopic brain glioma
Fig. 1
Fig. 1
a, b AFM images and c, d thickness profiles of MoS2 (a, c) and MoS2–ICG (b, d). e Absorbance spectra of MoS2 and MoS2–ICG at the same concentration of MoS2. f Fluorescence spectra of free ICG and MoS2–ICG at the same concentration of ICG
Fig. 2
Fig. 2
a Photoacoustic (PA) signal comparison of MoS2 and MoS2–ICG at the same concentration of MoS2. Photoacoustic signals of b MoS2–ICG at different concentrations and c MoS2–ICG illuminated with 5000 laser pulses
Fig. 3
Fig. 3
a Attenuation rate of 675- and 800-nm pulsed laser after penetrating the mouse skull. b Photoacoustic cross-sectional B-scan images of MoS2–ICG covered with mouse skull under 675- and 800-nm laser excitation. Yellow dashed line delineates the outline of the skull. Red circle indicates the MoS2–ICG sample. c Photoacoustic MAP images of mouse back post-subcutaneous injection of MoS2–ICG under 675- and 800-nm laser excitation. The enclosed area by the yellow dashed line indicates the injected region. d Photoacoustic signal intensity plot corresponding to the two red dashed lines in c. e SNR of photoacoustic images under 675- and 800-nm laser excitation in c
Fig. 4
Fig. 4
a Confocal fluorescence images of U87 glioma cells incubated with free ICG and MoS2–ICG for 1, 3, and 8 h. Blue shows fluorescence of DAPI and red shows fluorescence of ICG. b Viability of U87 glioma cells incubated with different concentrations of MoS2–ICG for 24 h. c Hemolysis percentage of RBCs after treatment with different concentrations of MoS2–ICG for 3 h. (+) and (−) each indicates distilled water and PBS as positive and negative controls. The inset photograph shows the direct observation of hemolysis
Fig. 5
Fig. 5
a B-scan ultrasound (US), photoacoustic (PA), and their merged images of the brain tumor region before and at 1, 3, and 5 h after intravenous injection of MoS2–ICG. The ultrasound images were used to delineate the scalp and skull of the mouse. The photoacoustic signals in the red circles show the accumulation and distribution of MoS2–ICG within the brain glioma. b Quantification results of photoacoustic signals in the tumor region at different time points before and after MoS2–ICG injection
Fig. 6
Fig. 6
a Representative H&E-stained images of the major organs including the heart, liver, spleen, lung, and kidney collected from control group mice and mice treated with MoS2–ICG. b, c Blood analysis of MoS2–ICG-treated group mice. WBC number of white blood cells; RBC number of red blood cells; MPV mean platelet volume; MCH mean corpuscular hemoglobin; HGB concentration of hemoglobin; HCT hematocrit; MCV mean corpuscular volume; MCHC mean corpuscular hemoglobin concentration; PLT platelets

References

    1. de Robles P, Fiest KM, Frolkis AD, Pringsheim T, Atta C, St Germaine-Smith C, Day L, Lam D, Jette N. The worldwide incidence and prevalence of primary brain tumors: a systematic review and meta-analysis. Neuro-Oncology. 2014;17(6):776–783. doi: 10.1093/neuonc/nou283. - DOI - PMC - PubMed
    1. Jiang X, Xin H, Ren Q, Gu J, Zhu L, et al. Nanoparticles of 2-deoxy-d-glucose functionalized poly (ethylene glycol)-co-poly (trimethylene carbonate) for dual-targeted drug delivery in glioma treatment. Biomaterials. 2014;35(1):518–529. doi: 10.1016/j.biomaterials.2013.09.094. - DOI - PubMed
    1. Shabihkhani M, Telesca D, Movassaghi M, Naeini YB, Naeini KM, et al. Incidence, survival, pathology, and genetics of adult Latino Americans with glioblastoma. J. Neuro-Oncol. 2017;132(2):351–358. doi: 10.1007/s11060-017-2377-0. - DOI - PubMed
    1. Wen PY, Reardon DA. Neuro-oncology in 2015: progress in glioma diagnosis, classification and treatment. Nat. Rev. Neurol. 2016;12(2):69–70. doi: 10.1038/nrneurol.2015.242. - DOI - PubMed
    1. Ahmed R, Oborski MJ, Hwang M, Lieberman FS, Mountz JM. Malignant gliomas: current perspectives in diagnosis, treatment, and early response assessment using advanced quantitative imaging methods. Cancer Manag. Res. 2014;24(6):149–170. - PMC - PubMed

LinkOut - more resources