. 2018;10(4):61.
doi: 10.1007/s40820-018-0214-4. Epub 2018 Jul 4.

Visualizing Photodynamic Therapy in Transgenic Zebrafish Using Organic Nanoparticles with Aggregation-Induced Emission

Affiliations

Visualizing Photodynamic Therapy in Transgenic Zebrafish Using Organic Nanoparticles with Aggregation-Induced Emission

Purnima Naresh Manghnani et al. Nanomicro Lett. 2018.

Abstract

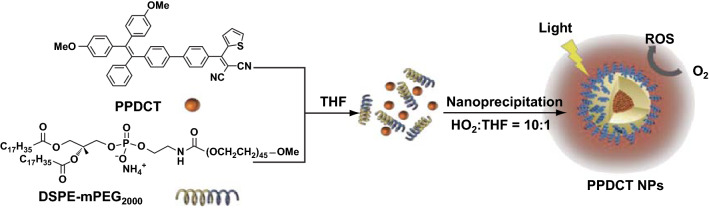
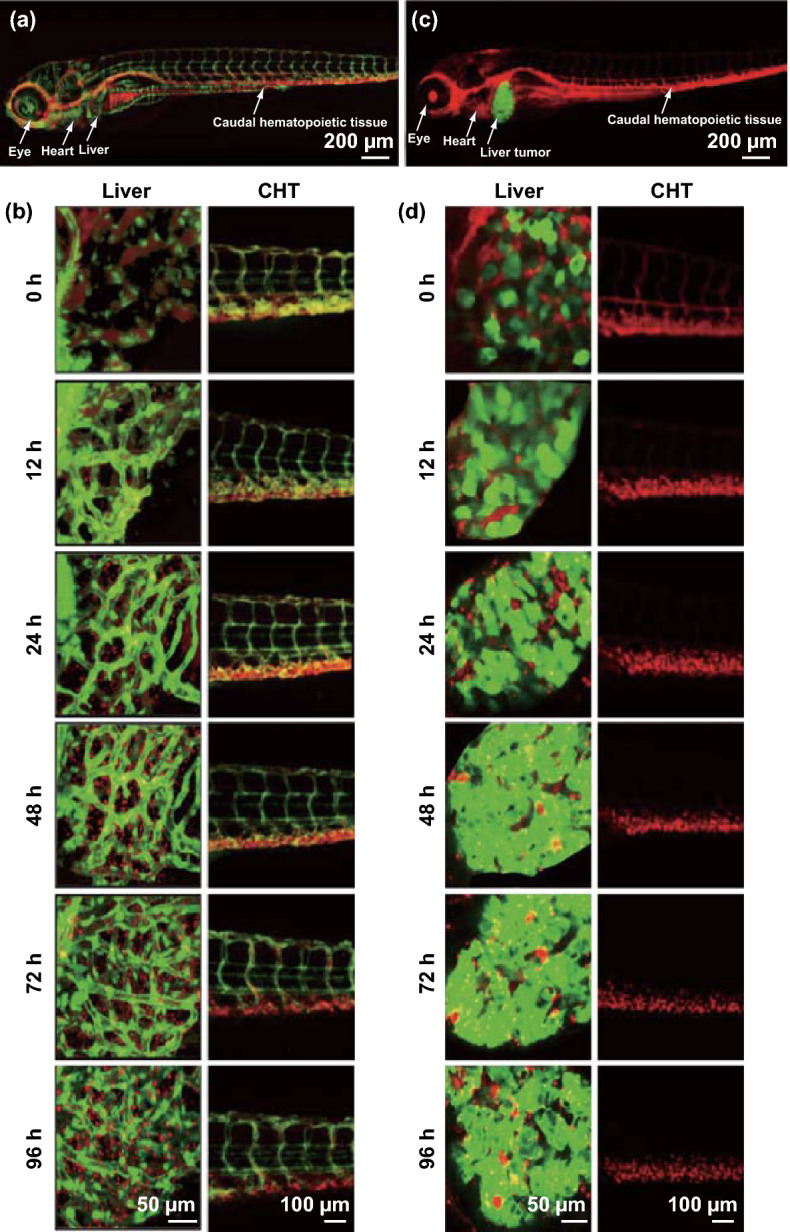
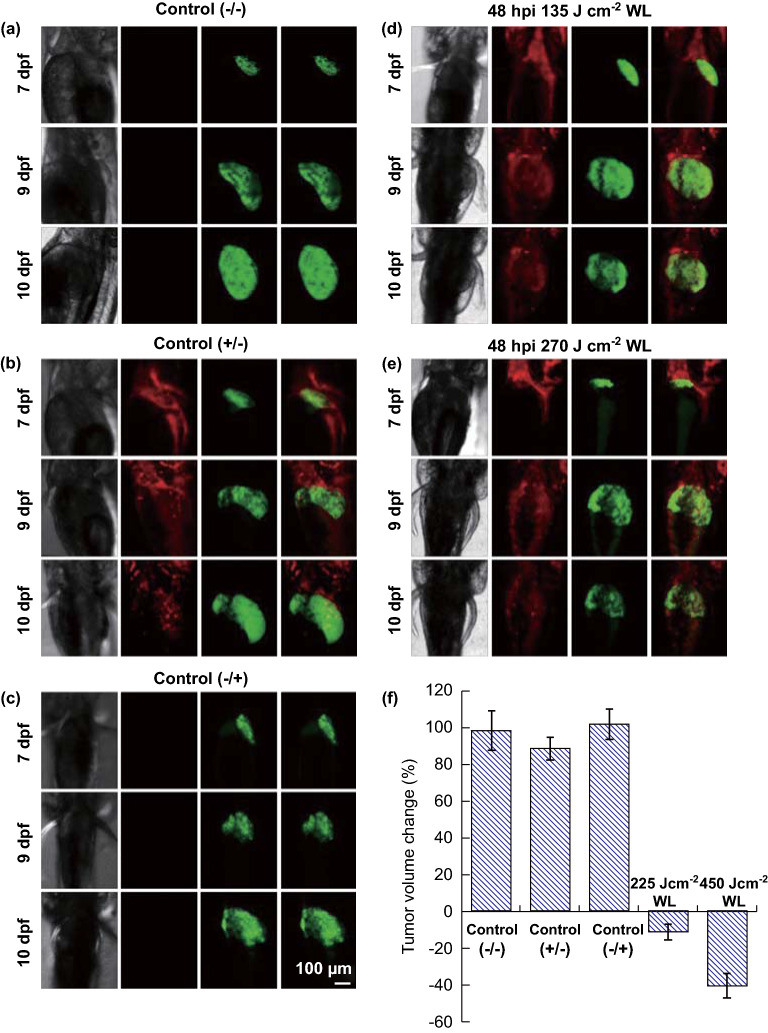
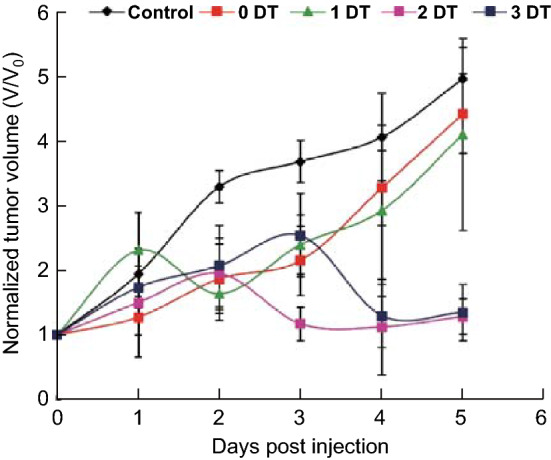
Photodynamic therapy (PDT) employs accumulation of photosensitizers (PSs) in malignant tumor tissue followed by the light-induced generation of cytotoxic reactive oxygen species to kill the tumor cells. The success of PDT depends on optimal PS dosage that is matched with the ideal power of light. This in turn depends on PS accumulation in target tissue and light administration time and period. As theranostic nanomedicine is driven by multifunctional therapeutics that aim to achieve targeted tissue delivery and image-guided therapy, fluorescent PS nanoparticle (NP) accumulation in target tissues can be ascertained through fluorescence imaging to optimize the light dose and administration parameters. In this regard, zebrafish larvae provide a unique transparent in vivo platform to monitor fluorescent PS bio-distribution and their therapeutic efficiency. Using fluorescent PS NPs with unique aggregation-induced emission characteristics, we demonstrate for the first time the real-time visualization of polymeric NP accumulation in tumor tissue and, more importantly, the best time to conduct PDT using transgenic zebrafish larvae with inducible liver hyperplasia as an example.

Keywords: Aggregation-induced emission; Nanomedicine; Organic nanoparticles; Photodynamic therapy; Transgenic zebrafish.


Figures

Scheme 1
Scheme 1
Nanoprecipitation of AIE photosensitizer PPDCT with DSPE-mPEG2000
Fig. 1
Fig. 1
a UV–visible absorption (solid line) and photoluminescence (PL, dashed line) spectra of PPDCT-DSPE-mPEG NPs. b Number size distribution of PPDCT-DSPE-mPEG NPs. c TEM image of PPDCT-DSPE-mPEG NPs. d Absorbance decay of 64 µM ABDA in the presence of PPDCT NPs over 10 min of 0.15 W cm−2 white light
Fig. 2
Fig. 2
a Confocal image of HepG2 cells incubated with PPDCT NPs. b Cellular internalization of PPDCT NPs confirmed using flow cytometry. c MTT viability assay of HepG2 cells treated with PPDCT NPs and 0.15 W cm−2 white light (WL 0, 45 and 90 J cm−2). d Whole zebrafish embryo soaking viability for treatment with different PPDCT NP concentrations
Fig. 3
Fig. 3
a Confocal image of fli:EGFP zebrafish larva injected intravenously with 0.8 mg mL−1 PPDCT NPs. b Uptake and breakdown of NPs over time span of 96 h in the liver and caudal hematopoietic tissue (CHT) of fli:EGFP zebrafish liver. c Confocal image of EGFP:krasV12 zebrafish larva injected intravenously with 0.8 mg mL−1 PPDCT NPs. d Uptake and breakdown of NPs over time span of 96 h in the liver and CHT of EGFP:krasV12 zebrafish liver. Confocal λex = 488 nm, green fluorescent protein λem = 509 nm, PPDCT λem = 660 nm
Fig. 4
Fig. 4
Change in liver tumor volume for control group: a without injection or illumination (−/−), b with injection and without illumination (−/+) and c without injection and with illumination (+/−). Change in liver tumor volume for group injected with NPs on 7 dpf and treated: d with 135 J cm−2 of illumination 9 dpf and e with 270 J cm−2 of illumination of 9 dpf. f Graph depicting the percentage of tumor volume change on 10 dpf relative to the volume on 9 dpf before light treatment for all five groups, n = 14; confocal λex = 488 nm, green fluorescent protein λem = 509 nm, PPDCT λem = 660 nm
Fig. 5
Fig. 5
Changes in normalized tumor volume of larvae subjected to different days of light illumination; 0 dpi depicts 7 dpf larvae immediately after intravenous injection. 0-Day therapy (0 DT) refers to WL illumination on 0 dpi. n = 7

References

    1. Cerman E, Çekiç O. Clinical use of photodynamic therapy in ocular tumors. Surv. Ophthalmol. 2015;60(6):557–574. doi: 10.1016/j.survophthal.2015.05.004. - DOI - PubMed
    1. Rodriguez E, Baas P, Friedberg JS. Innovative therapies: photodynamic therapy. Thorac. Surg. Clin. 2004;14(4):557–566. doi: 10.1016/j.thorsurg.2004.06.004. - DOI - PubMed
    1. Zhao N, Wu B, Hu X, Xing D. NIR-triggered high-efficient photodynamic and chemo-cascade therapy using caspase-3 responsive functionalized upconversion nanoparticles. Biomaterials. 2017;141:40–49. doi: 10.1016/j.biomaterials.2017.06.031. - DOI - PubMed
    1. Cabral H, Nakanishi M, Kumagai M, Jang W-D, Nishiyama N, Kataoka K. A photo-activated targeting chemotherapy using glutathione sensitive camptothecin-loaded polymeric micelles. Pharm. Res. 2009;26(1):82–92. doi: 10.1007/s11095-008-9712-2. - DOI - PubMed
    1. Diehn M, Cho RW, Lobo NA, Kalisky T, Dorie MJ, et al. Association of reactive oxygen species levels and radioresistance in cancer stem cells. Nature. 2009;458(7239):780–783. doi: 10.1038/nature07733. - DOI - PMC - PubMed