Review
. 2018;10(4):64.
doi: 10.1007/s40820-018-0218-0. Epub 2018 Jul 13.

Metal-Organic Framework-Based Sensors for Environmental Contaminant Sensing

Affiliations
Review

Metal-Organic Framework-Based Sensors for Environmental Contaminant Sensing

Xian Fang et al. Nanomicro Lett. 2018.

Abstract

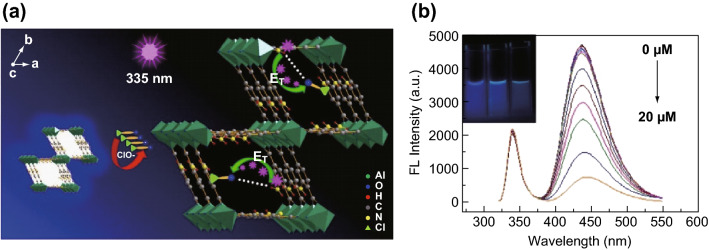
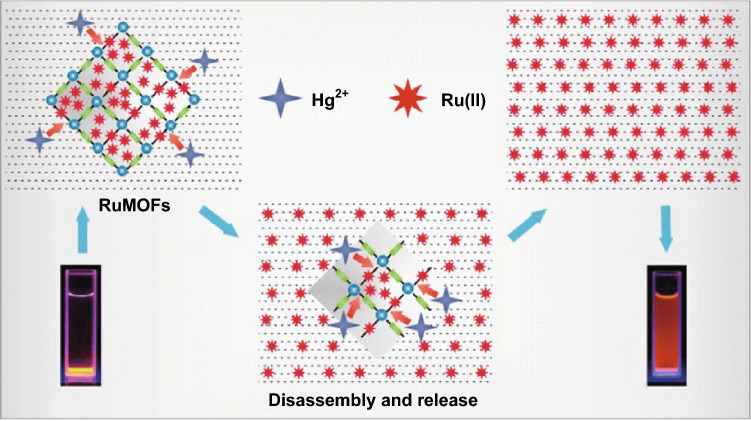
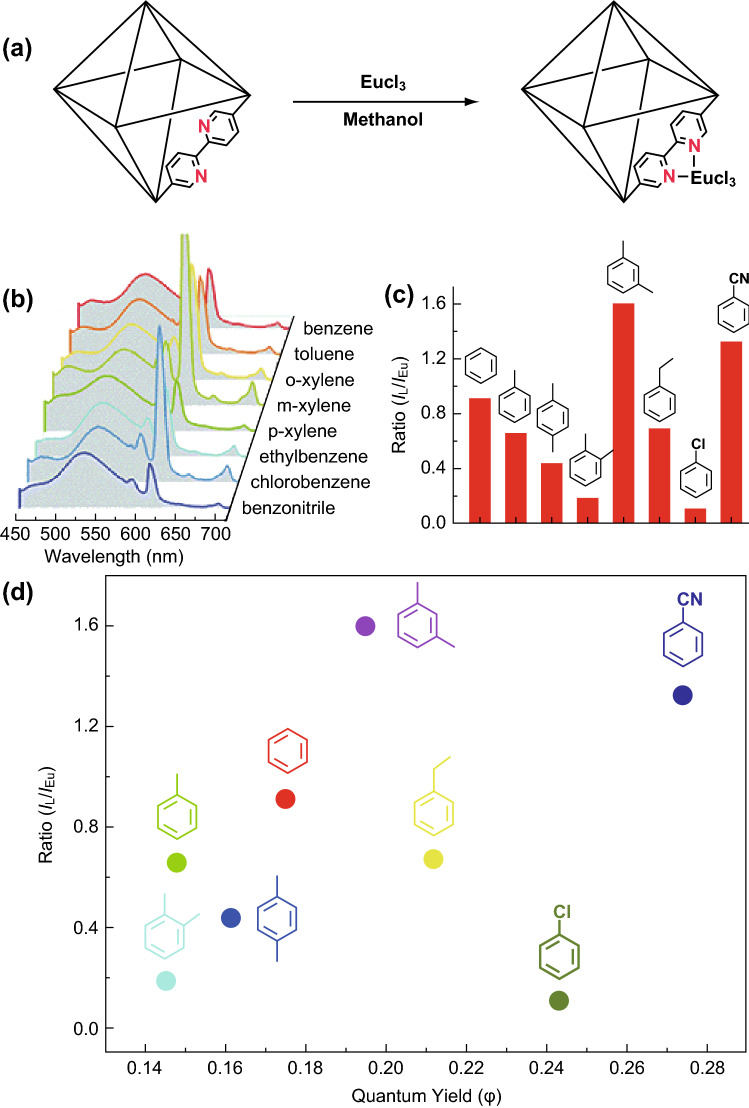
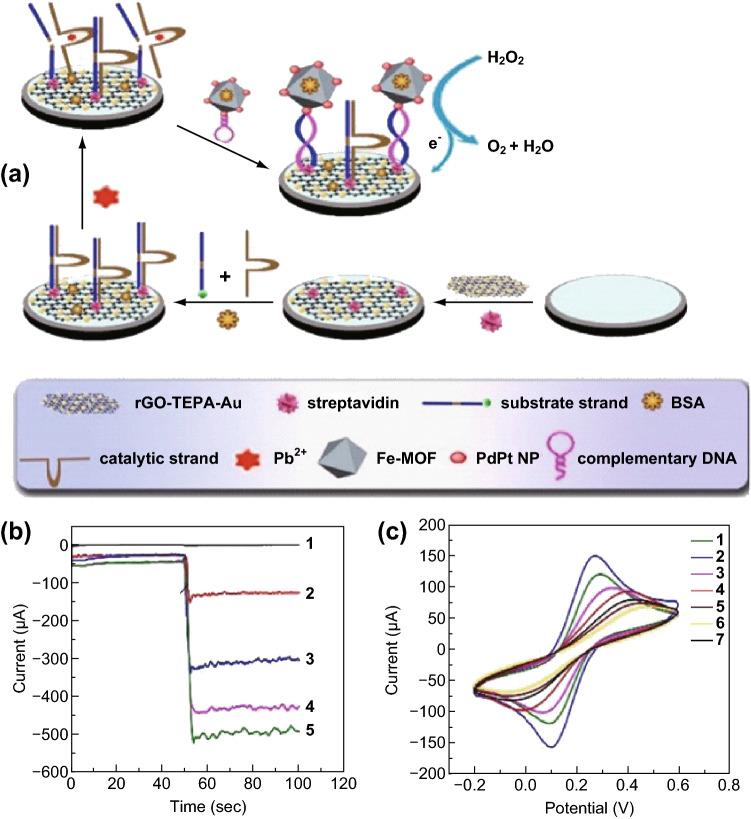
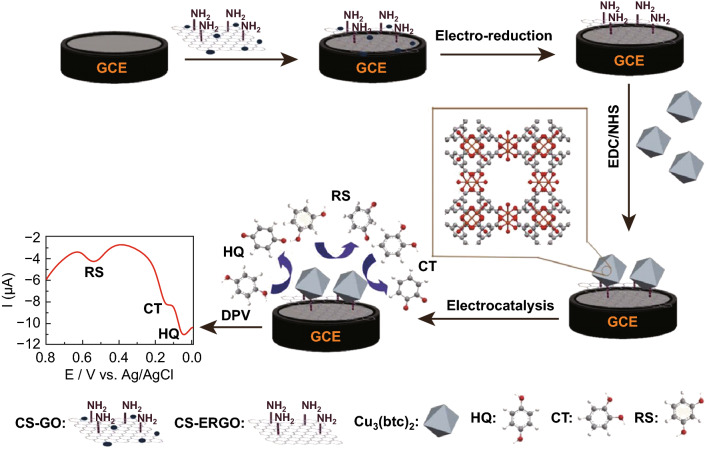
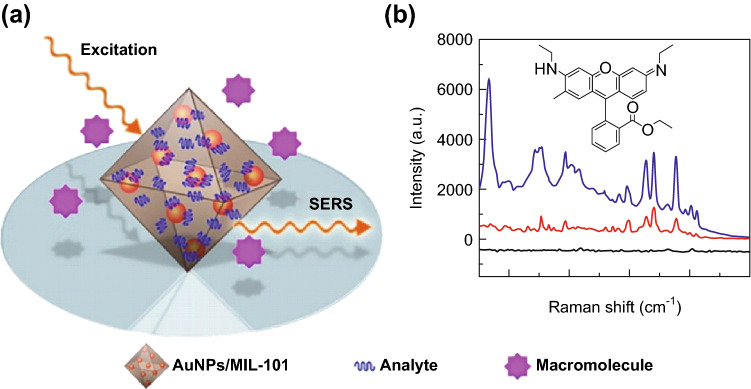
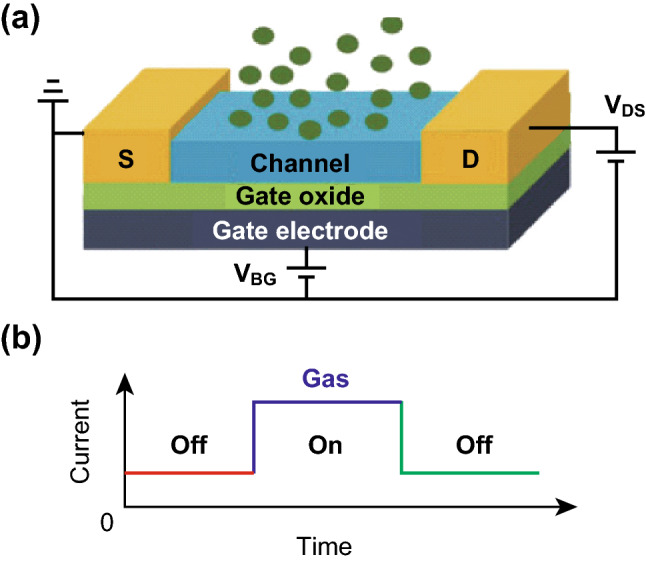
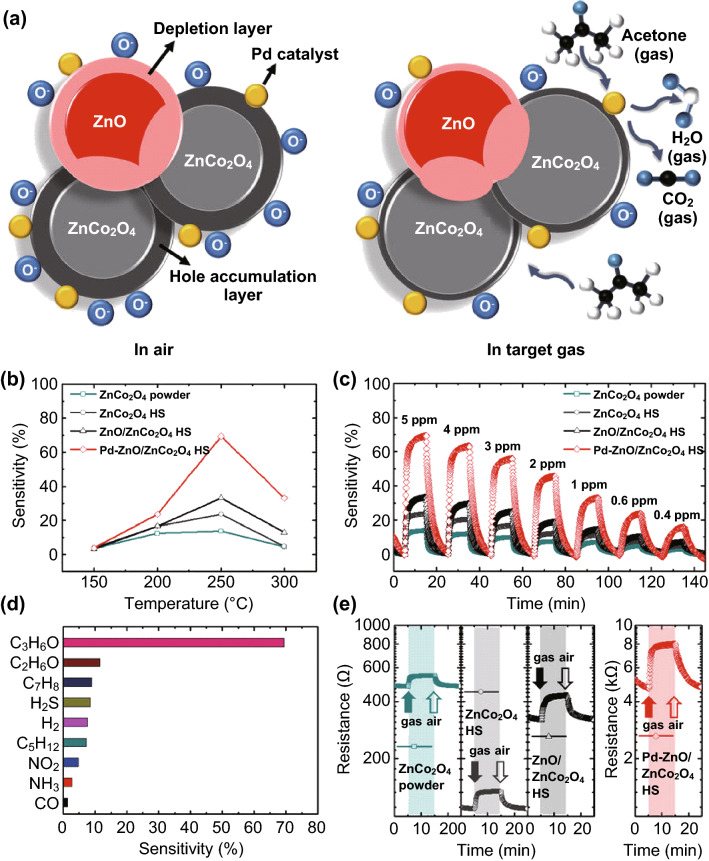
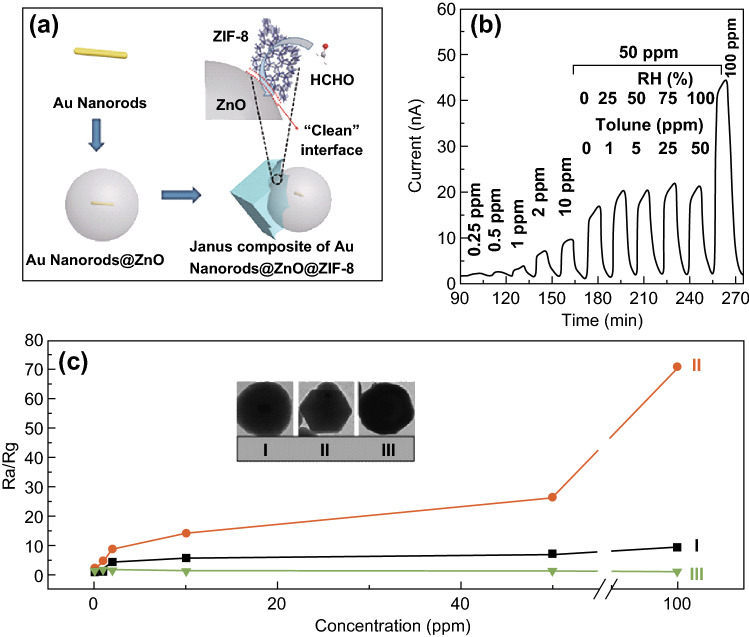
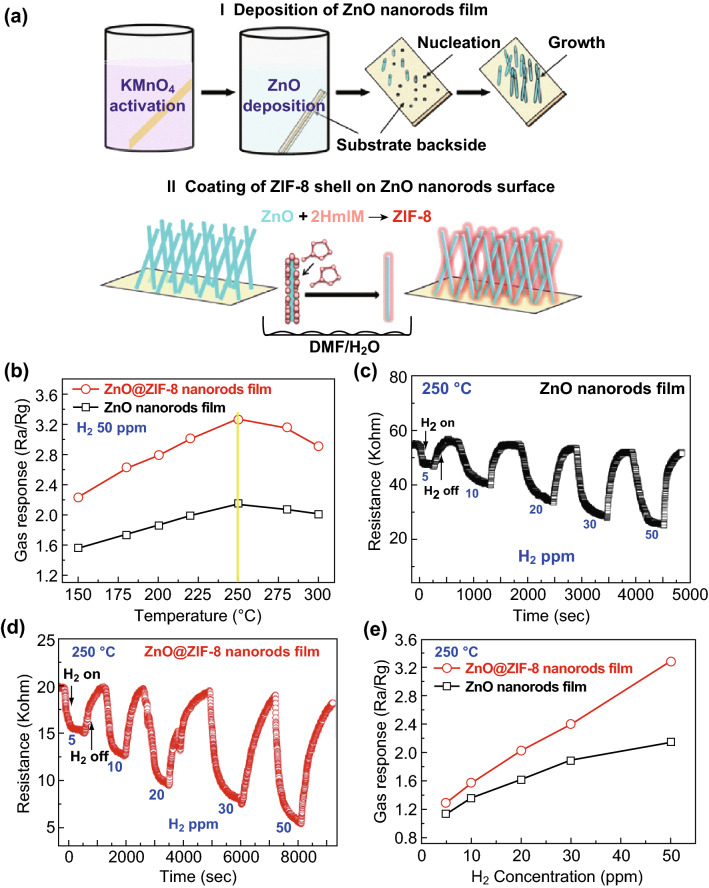
Increasing demand for timely and accurate environmental pollution monitoring and control requires new sensing techniques with outstanding performance, i.e., high sensitivity, high selectivity, and reliability. Metal-organic frameworks (MOFs), also known as porous coordination polymers, are a fascinating class of highly ordered crystalline coordination polymers formed by the coordination of metal ions/clusters and organic bridging linkers/ligands. Owing to their unique structures and properties, i.e., high surface area, tailorable pore size, high density of active sites, and high catalytic activity, various MOF-based sensing platforms have been reported for environmental contaminant detection including anions, heavy metal ions, organic compounds, and gases. In this review, recent progress in MOF-based environmental sensors is introduced with a focus on optical, electrochemical, and field-effect transistor sensors. The sensors have shown unique and promising performance in water and gas contaminant sensing. Moreover, by incorporation with other functional materials, MOF-based composites can greatly improve the sensor performance. The current limitations and future directions of MOF-based sensors are also discussed.

Keywords: Electrochemical sensor; Environmental contaminant; Field-effect transistor sensor; Metal–organic frameworks; Micro- and nanostructure; Optical sensor.


Figures

Fig. 1
Fig. 1
a Working principle of NH2-MIL-53-based sensor for ClO sensing. b Fluorescence emission spectra of NH2-MIL-53(Al)-based sensor toward various concentrations of ClO: 0, 0.05, 0.1, 0.5, 0.8, 1, 2, 3, 5, 7, 10, 15, and 20 μM from top to bottom. Inset shows corresponding photographs of NH2-MIL-53(Al) nanoplates in the absence (left) and presence of 10 μM (middle) and 20 μM (right) ClO under 365 nm UV light. Reprinted with permission from [57]. Copyright (2016) American Chemical Society
Fig. 2
Fig. 2
Sensing mechanism of Hg2+-responsive disassembly of Ru-MOFs and release of guest material of Ru(bpy)32+. Reprinted with permission from [60]. Copyright (2015) American Chemical Society
Fig. 3
Fig. 3
a Post-synthetic modification of UiO-bpy with Eu3+. b Emission profiles and c bar diagram depicting relative intensity ratios (IL/IEu), after addition of VOCs. d Two-dimensional map displaying relative emission intensities and quantum yields of various VOC encapsulated phases. Reprinted with permission from [63]. Copyright (2016) Royal Society of Chemistry
Fig. 4
Fig. 4
a Schematic of sensing strategy. b Amperometric it curves of different nanomaterials: (1) Fe-MOFs, (2) Fe-MOFs/AuNPs, (3) Fe-MOFs/PtNPs, (4) Fe-MOFs/PdNPs, and (5) Fe-MOFs/PdPt NPs. c CV characterization of electrodes at various stages of modification: (1) bare GCE, (2) rGO-TEPA-Au/GCE, (3) streptavidin/rGO-TEPA-Au/GCE, (4) substrate strand/streptavidin/rGO-TEPA-Au/GCE, (5) BSA/substrate strand/streptavidin/rGO-TEPA-Au/GCE, (6) catalytic strand/BSA/substrate strand/streptavidin/rGO-TEPA-Au/GCE, and (7) Pb2+/catalytic strand/BSA/substrate strand/streptavidin/rGO-TEPA-Au/GCE. Reprinted with permission from [76]. Copyright (2018) Elsevier
Fig. 5
Fig. 5
Schematic and detection strategy of electrochemical sensor based on MOF Cu3(BTC)2 and CS/rGO for DBIs detection. Reprinted with permission from [80]. Copyright (2016) American Chemical Society
Fig. 6
Fig. 6
a Schematic of MOF-based SERS platform and b SERS spectra of rhodamine 6G on Au NP/MIL-101 substrate (blue lines), Au colloids substrate (red line), and MIL-101 (black line). Reprinted with permission from [89]. Copyright (2014) American Chemical Society. (Color figure online)
Fig. 7
Fig. 7
a Schematic illustration of FET sensor with source and drain electrodes, channel material, gate oxide, and gate electrode. b Sensor current change after gas adsorption and desorption. Reprinted with permission from [97]. Copyright (2017) Royal Society of Chemistry
Fig. 8
Fig. 8
a Schematic of acetone sensing mechanism with Pd–ZnO/ZnCo2O4 hollow spheres. b Temperature-dependent acetone sensing characteristics to 5 ppm in temperature range of 150–300 °C. c Dynamic acetone sensing responses in concentration range of 0.4–5 ppm at 250 °C of ZnCo2O4 powders, ZnCo2O4 hollow spheres, ZnO/ZnCo2O4 hollow spheres, and Pd–ZnO/ZnCo2O4 hollow spheres. d Selective acetone detection characteristics of Pd–ZnO/ZnCo2O4 hollow spheres. e Dynamic resistance transition properties of samples toward 5 ppm acetone at 250 °C. Reprinted with permission from [103]. Copyright (2017) Macmillan Publishers Limited
Fig. 9
Fig. 9
a Schematic illustration of anisotropic synthesis of Au@ZnO@ZIF-8. b Dynamic response of Au@ZnO@ZIF-8 to HCHO with concentrations from 0.25 to 100 ppm. c Plots of sensor responses to HCHO concentration of three samples: (I) pristine Au@ZnO, (II) synthetic Au@ZnO@ZIF-8, and (III) completed Au@ZnO@ZIF-8. Inset shows TEM images of samples. Reprinted with permission from [104]. Copyright (2017) Springer
Fig. 10
Fig. 10
a Preparation of ZnO@ZIF-8 core–shell nanorod films. b Temperature-dependent response curves of ZnO nanorod and ZnO@ZIF-8 sensors to 50 ppm H2. c, d Dynamic response curves of two sensors to different H2 concentrations at 250 °C. e Concentration-dependent H2 response curves of two sensors at 250 °C. Reprinted with permission from [110]. Copyright (2017) John Wiley & Sons, Inc.

Similar articles

Cited by

References

    1. Lustig WP, Mukherjee S, Rudd ND, Desai AV, Li J, Ghosh SK. Metal–organic frameworks: functional luminescent and photonic materials for sensing applications. Chem. Soc. Rev. 2017;46(11):3242–3285. doi: 10.1039/c6cs00930a. - DOI - PubMed
    1. Petrovic M, Farre M, de Alda ML, Perez S, Postigo C, Kock M, Radjenovic J, Gros M, Barcelo D. Recent trends in the liquid chromatography–mass spectrometry analysis of organic contaminants in environmental samples. J. Chromatogr. A. 2010;1217(25):4004–4017. doi: 10.1016/j.chroma.2010.02.059. - DOI - PubMed
    1. van Nuijs ALN, Tarcomnicu I, Covaci A. Application of hydrophilic interaction chromatography for the analysis of polar contaminants in food and environmental samples. J. Chromatogr. A. 2011;1218(35):5964–5974. doi: 10.1016/j.chroma.2011.01.075. - DOI - PubMed
    1. Falcaro P, Ricco R, Yazdi A, Imaz I, Furukawa S, Maspoch D, Ameloot R, Evans JD, Doonan CJ. Application of metal and metal oxide nanoparticles@MOFs. Coord. Chem. Rev. 2016;307:237–254. doi: 10.1016/j.ccr.2015.08.002. - DOI
    1. Wang J, Jiu JT, Araki T, Nogi M, Sugahara T, Nagao S, Koga H, He P, Suganuma K. Silver nanowire electrodes: conductivity improvement without post-treatment and application in capacitive pressure sensors. Nano-Micro Lett. 2015;7(1):51–58. doi: 10.1007/s40820-014-0018-0. - DOI - PMC - PubMed

LinkOut - more resources