. 2018 Oct 31:1:181.
doi: 10.1038/s42003-018-0165-9. eCollection 2018.

i-BLESS is an ultra-sensitive method for detection of DNA double-strand breaks

Affiliations

i-BLESS is an ultra-sensitive method for detection of DNA double-strand breaks

Anna Biernacka et al. Commun Biol. .

Abstract

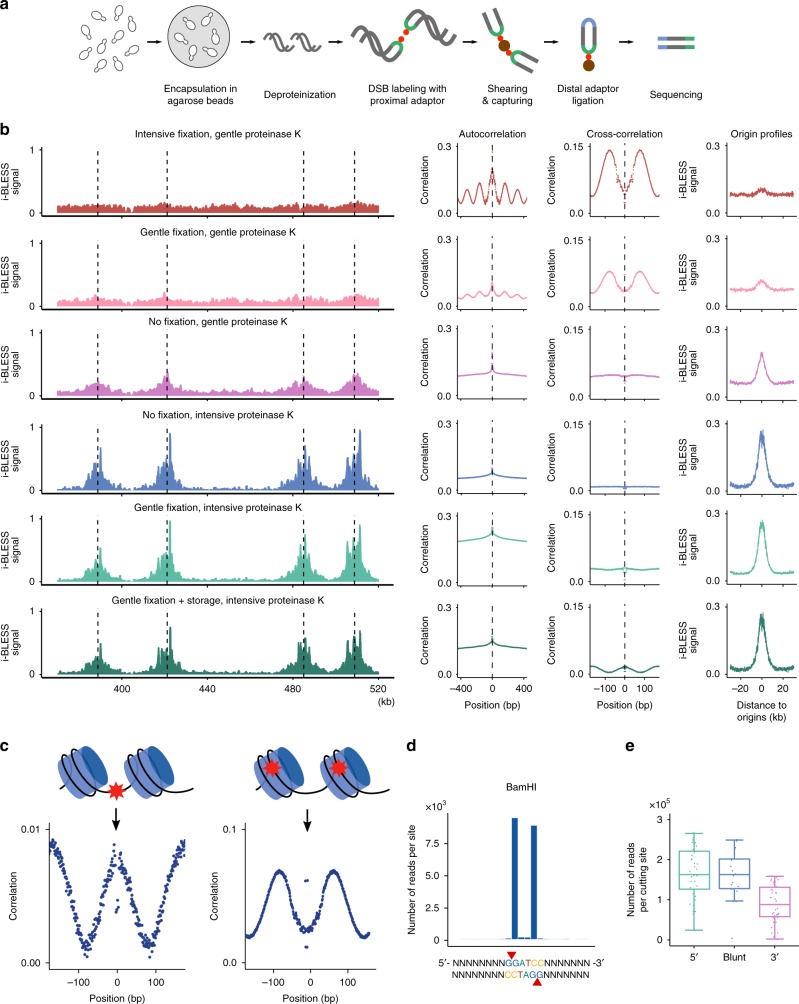
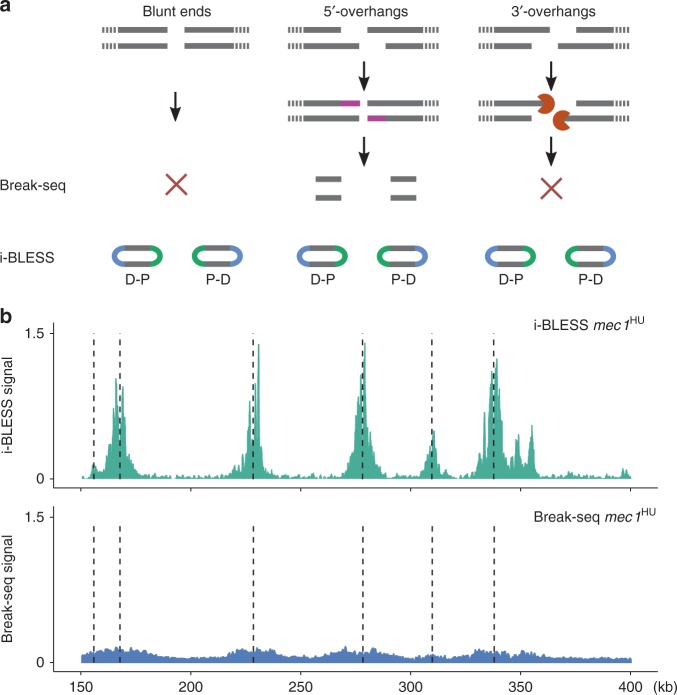
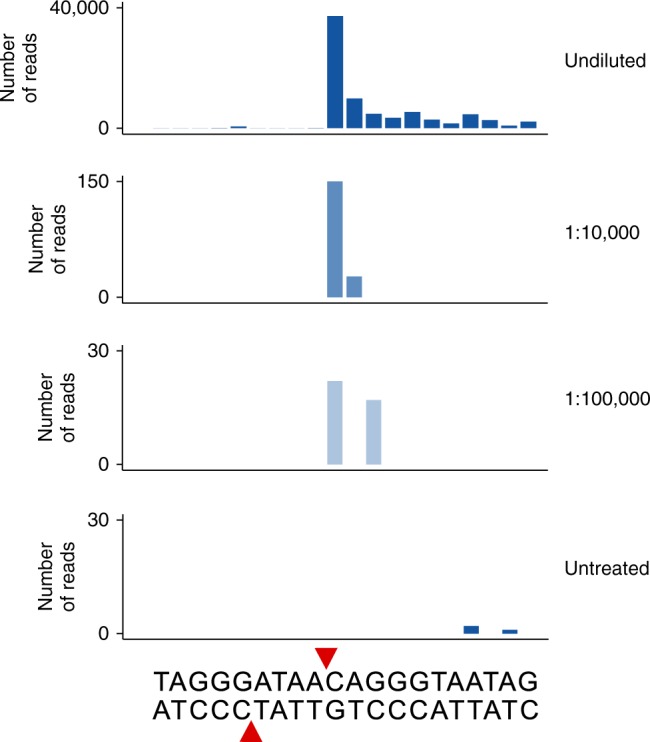
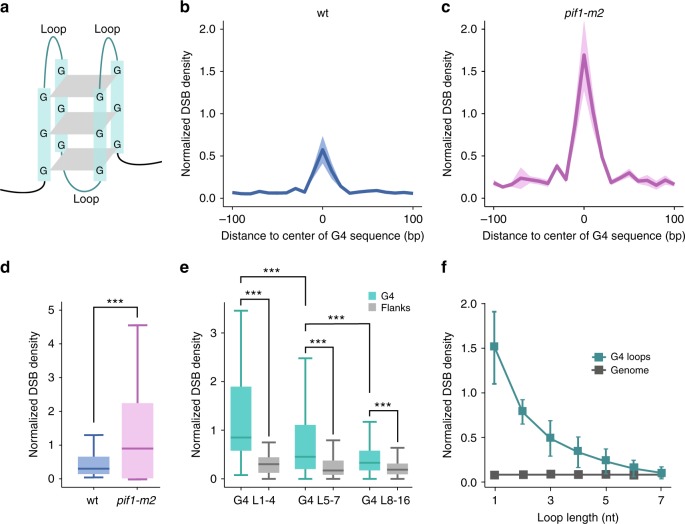
Maintenance of genome stability is a key issue for cell fate that could be compromised by chromosome deletions and translocations caused by DNA double-strand breaks (DSBs). Thus development of precise and sensitive tools for DSBs labeling is of great importance for understanding mechanisms of DSB formation, their sensing and repair. Until now there has been no high resolution and specific DSB detection technique that would be applicable to any cells regardless of their size. Here, we present i-BLESS, a universal method for direct genome-wide DNA double-strand break labeling in cells immobilized in agarose beads. i-BLESS has three key advantages: it is the only unbiased method applicable to yeast, achieves a sensitivity of one break at a given position in 100,000 cells, and eliminates background noise while still allowing for fixation of samples. The method allows detection of ultra-rare breaks such as those forming spontaneously at G-quadruplexes.


Conflict of interest statement

The authors declare no competing interests.

Figures

Fig. 1
Fig. 1
i-BLESS method and its validation. a i-BLESS workflow. Briefly, cells are encapsulated in agarose beads, lysed and deproteinated, DSBs are labeled with a biotinylated adapter (proximal) and captured on streptavidin. Free ends of DNA fragments are ligated to the second adapter (distal), and the resulting fragments are amplified and sequenced. b Impact of experimental protocol parameters on quality of i-BLESS data. mec1-1 sml1-1 cells were treated with hydroxyurea and subjected to indicated treatments: intensive fixation: cell fixation with 2% formaldehyde for 30 min; gentle fixation: cell fixation with 2% formaldehyde for 5 min; storage: storage of fixed cells for 7 days at 4 °C; intensive proteinase K: 50 µg mL−1 overnight at 50 °C; and gentle proteinase K: 1 µg mL−1 for 5 min at 37 °C. For each sample, i-BLESS signal around replication origins (dotted vertical lines) in a representative region of chromosome VII, autocorrelation of i-BLESS signal, cross-correlation of i-BLESS data with MNase-seq data and averaged i-BLESS signal around replication origins are shown. i-BLESS data in the top two panels, for which signal-to-noise ratio is the lowest (as illustrated by averaged meta-profiles of i-BLESS signal around replication origins), shows clear periodicity in autocorrelation pattern related to nucleosome spacing, suggesting over-fixation as a main source of noise during DSB detection. Reads were normalized to 1 million total reads. c Cross-correlation of i-BLESS data with nucleosome positioning data (MNase-seq) characteristic for DSBs located preferentially between nucleosomes (left) or within nucleosomes (right). As MNase signal is increased in nucleosome depleted regions, a peak for cross-correlation observed at position 0 bp (left panel) implies DSBs enriched between nucleosomes, while peaks observed at positions +/−80 bp (right panel) indicate DSBs enriched within nucleosomes. d Averaged i-BLESS signal in a 22 bp window around BamHI cutting sites (marked with red arrows). e Number of i-BLESS reads at NotI (5′ overhangs), SrfI (blunt ends) and AsiSI (3′ overhangs) recognition sites in wild type cells treated with all 3 enzymes simultaneously. Median (center line), lower/upper quartiles (box limits), and lower/upper adjacent (whiskers) are shown
Fig. 2
Fig. 2
Comparison of i-BLESS and Break-seq. a Design of Break-seq renders it unable to detect blunt ends and 3′-overhangs. P and D correspond to proximal and distal adapters, respectively. b i-BLESS and Break-seq signals around early replication origins (dotted vertical lines) in a representative region of chromosome XV for HU treated mec1-1 sml1-1 cells. Reads were normalized to 1 million total reads
Fig. 3
Fig. 3
i-BLESS high sensitivity allows detection of ultra-rare breaks. i-BLESS signal around I-SceI recognition site (red arrows) in: non-diluted in vivo Gal treated YBP-275 cells, in vitro I-SceI treated YBP-275 cells mixed with wild type cells in ratios of 1:10,000 and 1:100,000, and untreated YBP-275 cells
Fig. 4
Fig. 4
G4-related genome instability. a Schematic representation of G4 structure. b,c Averaged i-BLESS signal in a 200 bp window centered on G4s, calculated by aligning all G4 centers and using 10 bp bins for wild type and pif1-m2 cells. Mean values (solid line) and standard deviation (color shade) for three biological replicates are shown. d DSB densities inside G4 sequences for wild type (blue, wt) and pif1-m2 (purple) cells. DSB density was defined as a number of i-BLESS reads mapped to a given region, divided by region length. Median (center line), lower/upper quartiles (box limits), and lower/upper adjacent (whiskers) are shown. P value was calculated by paired Wilcoxon signed-rank test, ***P < 0.001. e DSB densities inside and outside of G4s containing loops of the indicated length. G4: canonical G-quadruplex structures identified by AllQuad software (see Methods). Flanks: left and right adjacent regions half of the length of their corresponding G4. G4 sequences are classified into: G4 L1–4: all loops ≤ 4 nt; G4 L5–7: all loops ≤ 7 nt, but at least one loop > 4 nt; G4 L8–16: all loops ≤ 16 nt, but at least one loop > 7 nt. Median (center line), lower/upper quartiles (box limits), and lower/upper adjacent (whiskers) are shown. P values were calculated by two-sided Kolmogorov-Smirnov test, ***P < 0.001. f Average DSB densities for G4 loops of length varying from 1 to 7 nucleotides and control genomic regions of the same length. The 1–7 nt-long control genomic regions were randomly selected. Mean values and standard deviation for three biological replicates are shown. The number of reads were normalized to the total mapped reads to compare DSB densities between replicates

References

    1. Mehta A, Haber JE. Sources of DNA double-strand breaks and models of recombinational DNA repair. Cold Spring Harb. Perspect. Biol. 2014;6:a016428. doi: 10.1101/cshperspect.a016428. - DOI - PMC - PubMed
    1. Richardson C, Jasin M. Frequent chromosomal translocations induced by DNA double-strand breaks. Nature. 2000;405:697–700. doi: 10.1038/35015097. - DOI - PubMed
    1. Mills KD, Ferguson DO, Alt FW. The role of DNA breaks in genomic instability and tumorigenesis. Immunol. Rev. 2003;194:77–95. doi: 10.1034/j.1600-065X.2003.00060.x. - DOI - PubMed
    1. Negrini S, Gorgoulis VG, Halazonetis TD. Genomic instability—an evolving hallmark of cancer. Nat. Rev. Mol. Cell Biol. 2010;11:220–228. doi: 10.1038/nrm2858. - DOI - PubMed
    1. Szilard RK, et al. Systematic identification of fragile sites via genome-wide location analysis of gamma-H2AX. Nat. Struct. Mol. Biol. 2010;17:299–305. doi: 10.1038/nsmb.1754. - DOI - PMC - PubMed